Search by title
Filter by tag
Showing 412 of 412 samples
Loading samples…
3D icon rotation
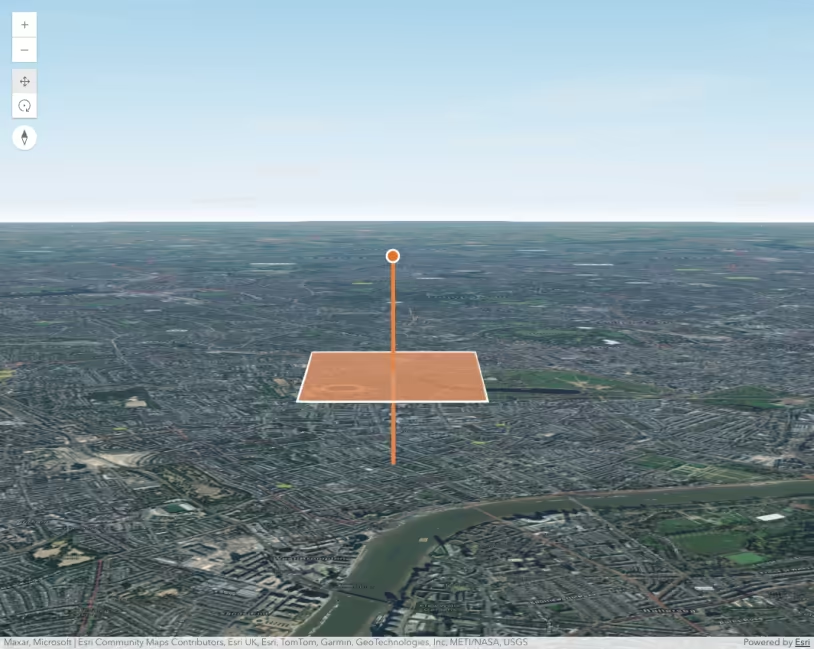
3D Scene - visibleArea
Access features with hitTest
Add a Legend to the LayerList
Add edges to a SceneLayer
Add Graphics to a Scene component
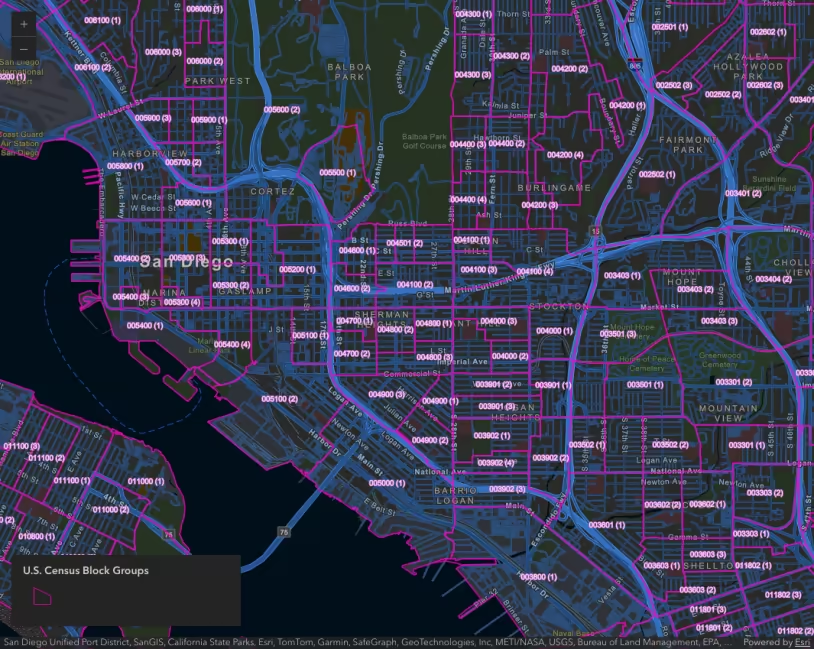
Add labels to a FeatureLayer
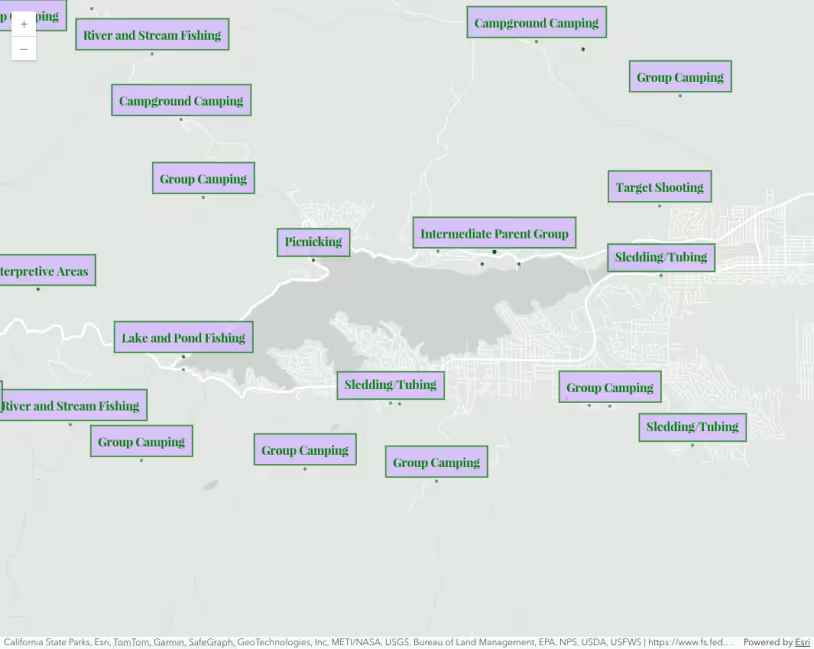
Add multiple label classes to a layer
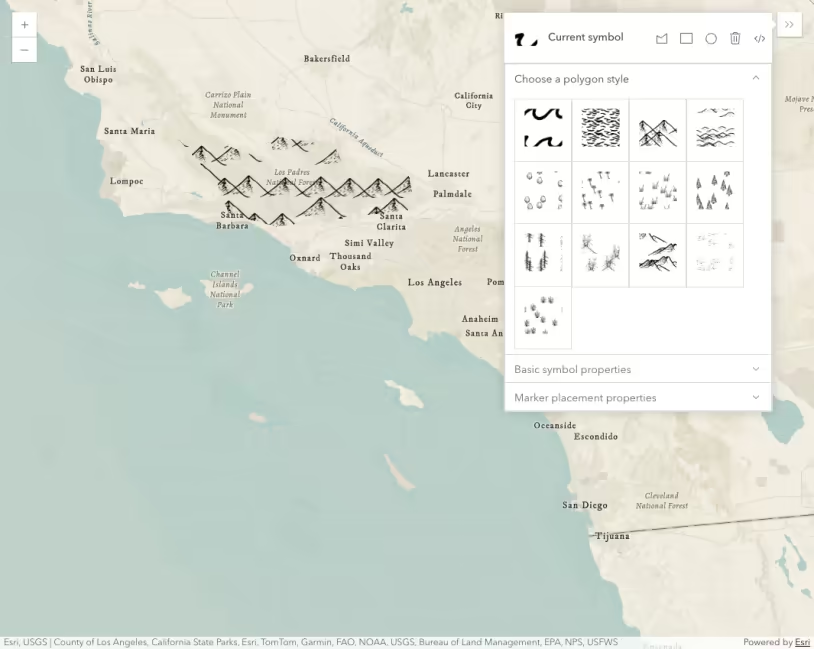
Adjust marker placement in polygon symbols
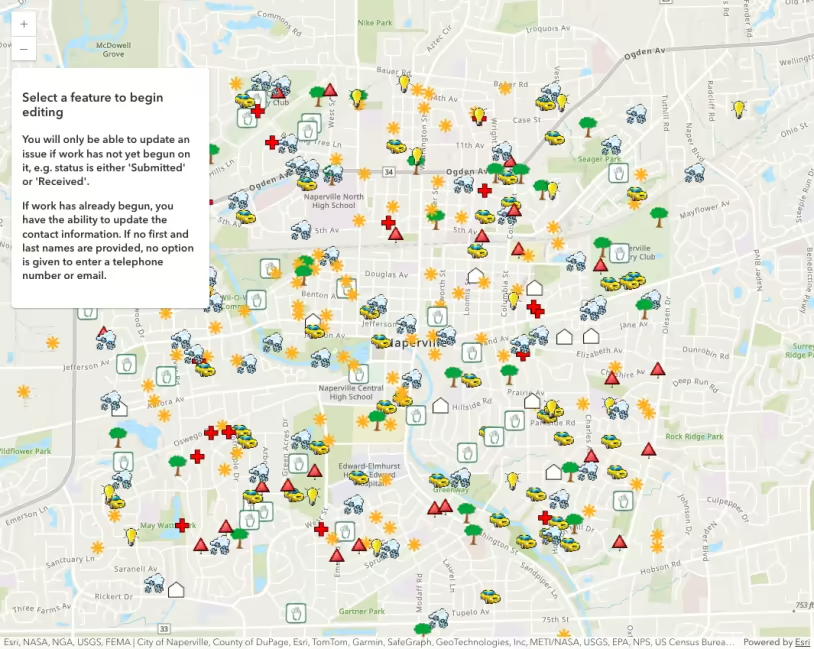
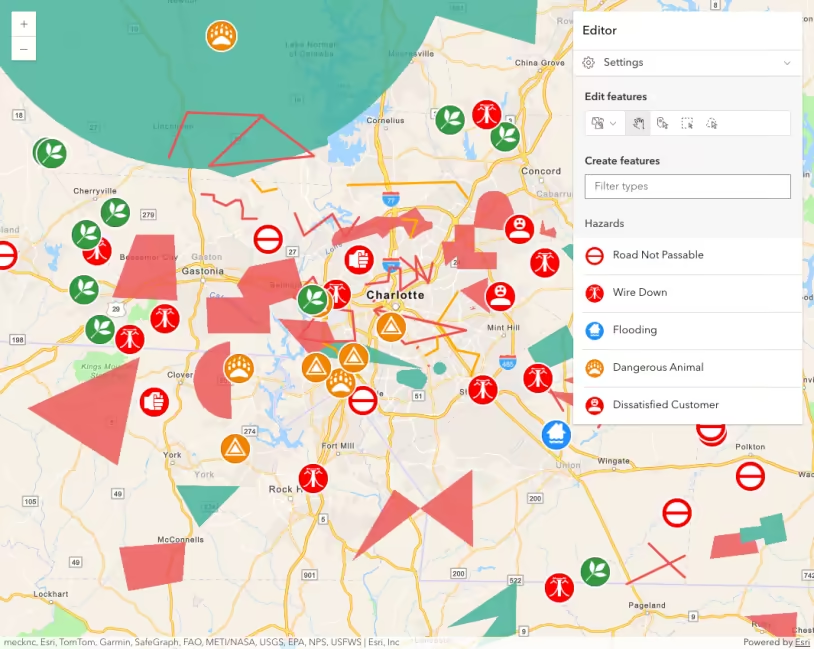
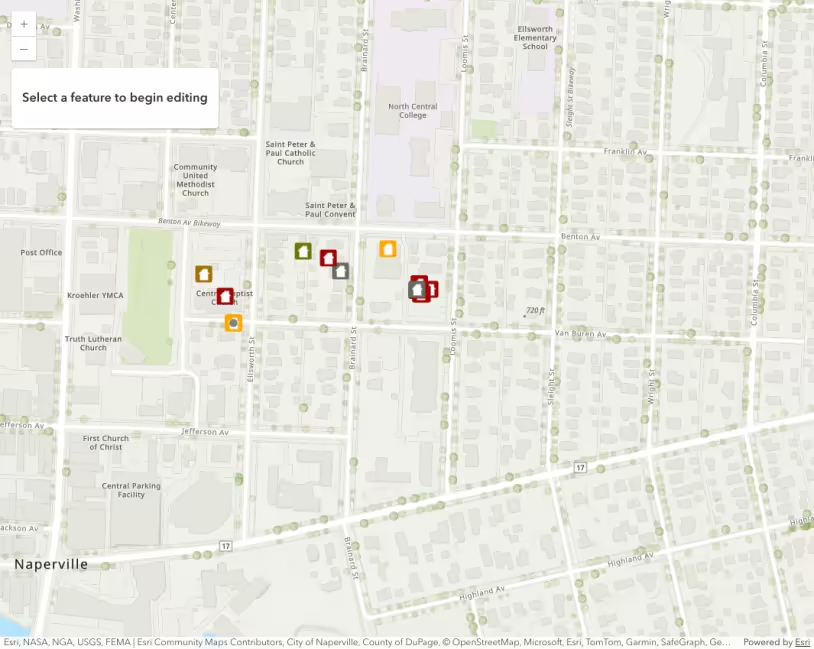
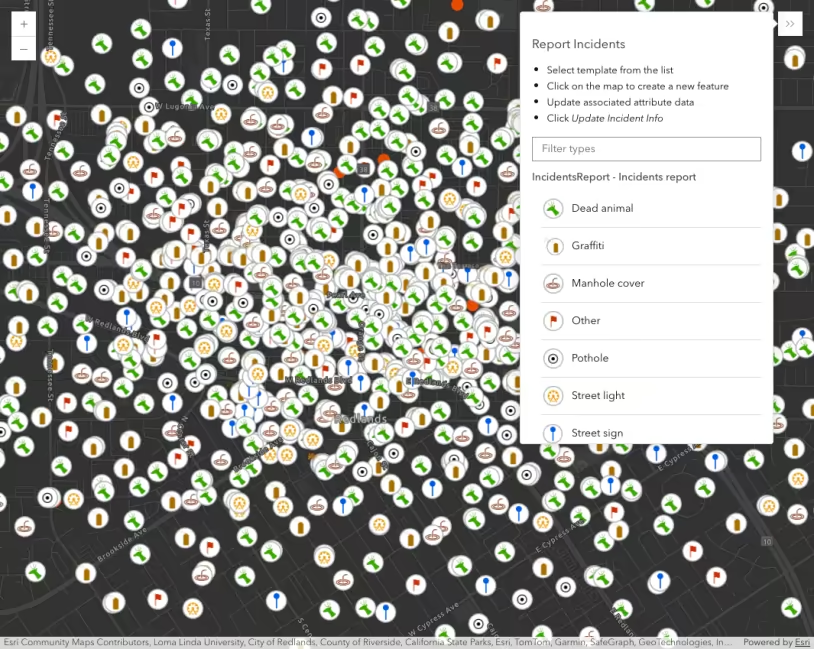
Advanced Attribute Editing
Aggregate spatial statistics
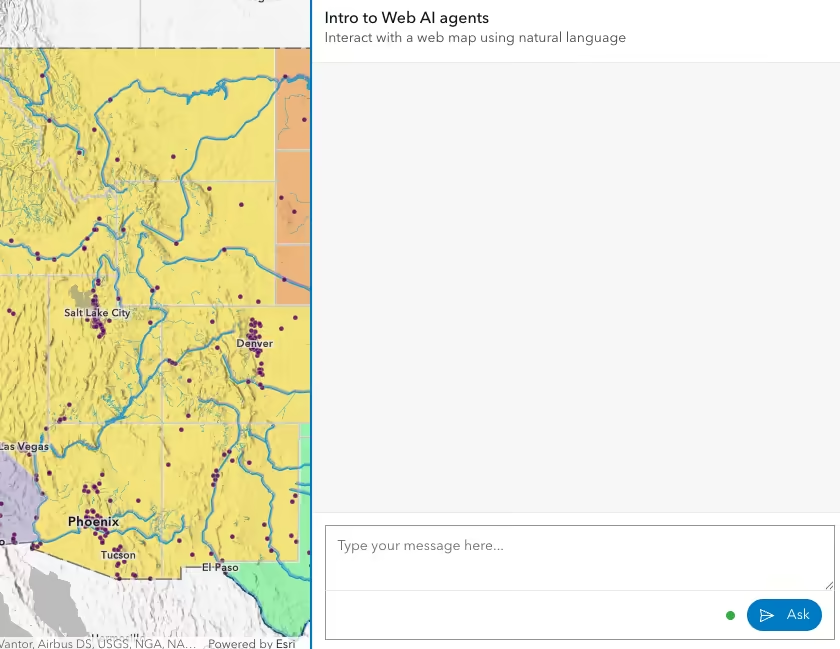
AI Assistant component (beta)
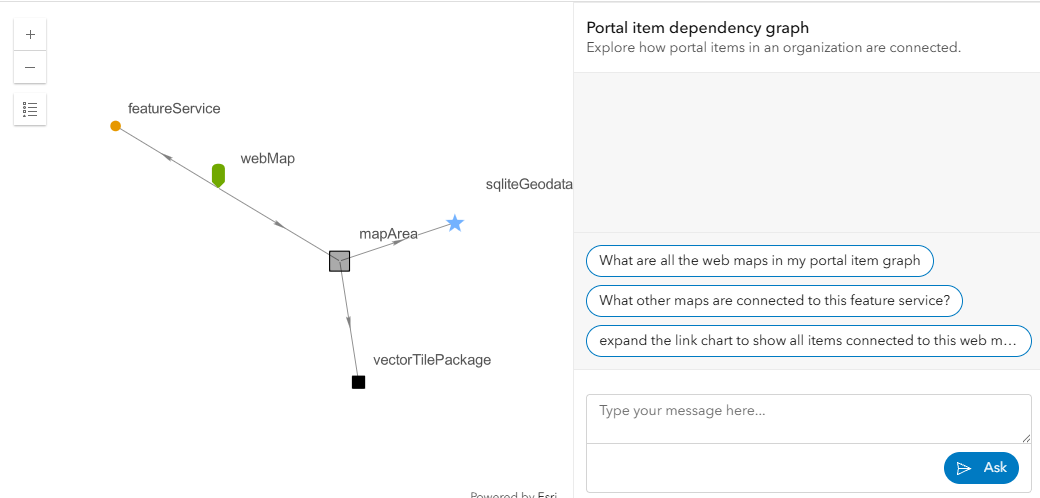
AI Assistant Knowledge Agent (beta)
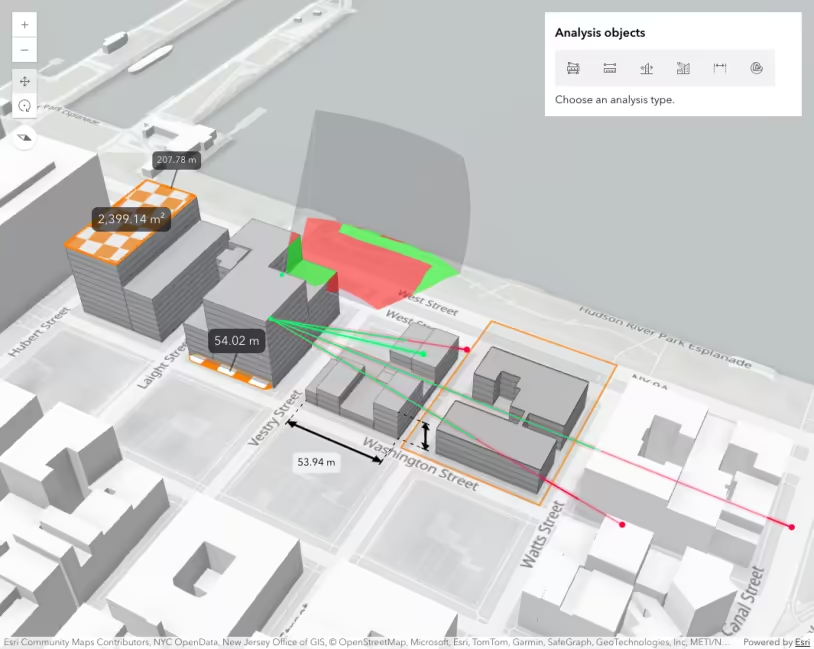
Analysis objects
Animate color visual variable
Animate layer view effect
Animated lines with WebGL
Animated symbols
Apply drop-shadow effects to layerview
Apply effects to features
Apply featureEffect to a FeatureLayer
Area measurement analysis object
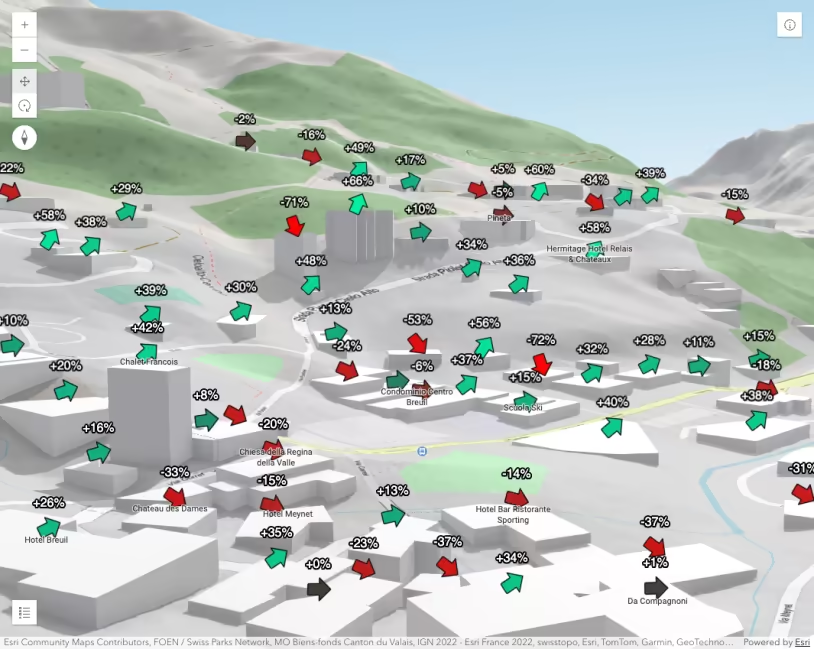
Arrows along a line
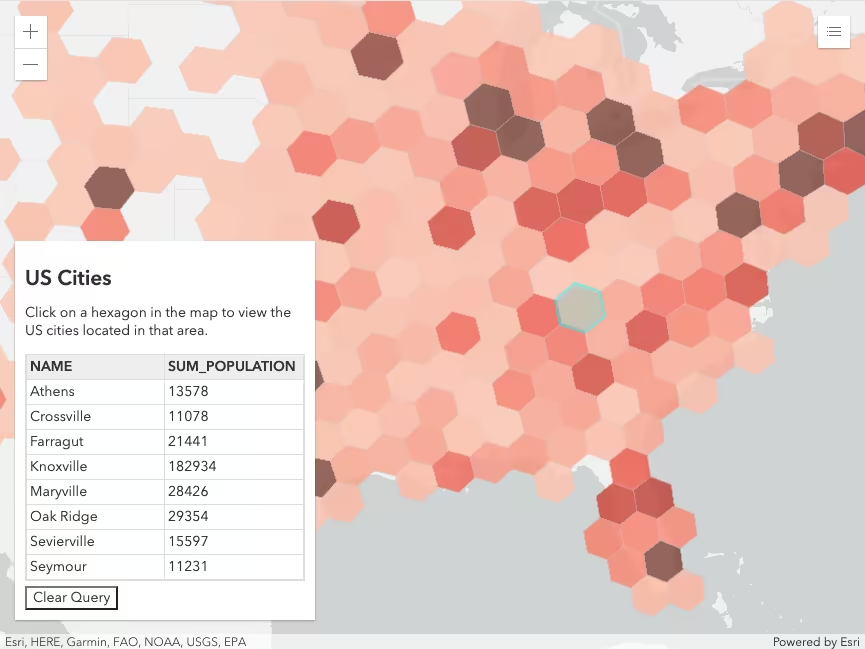
Attribute Bins Query
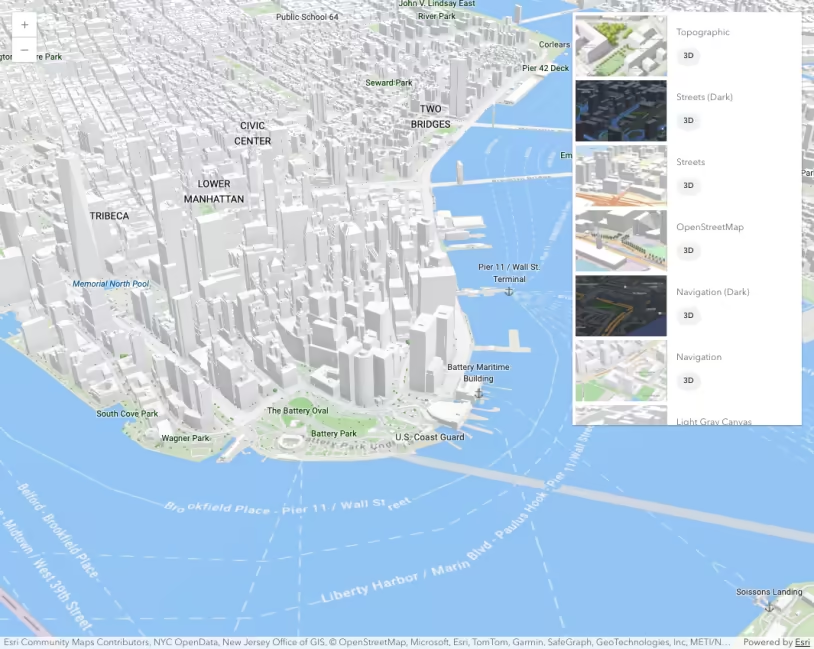
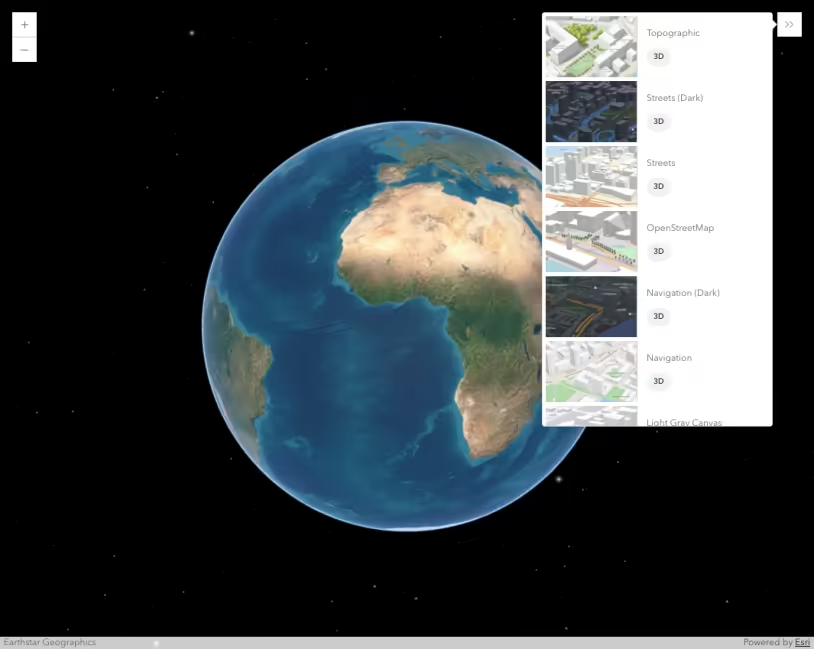
Basemap Gallery component
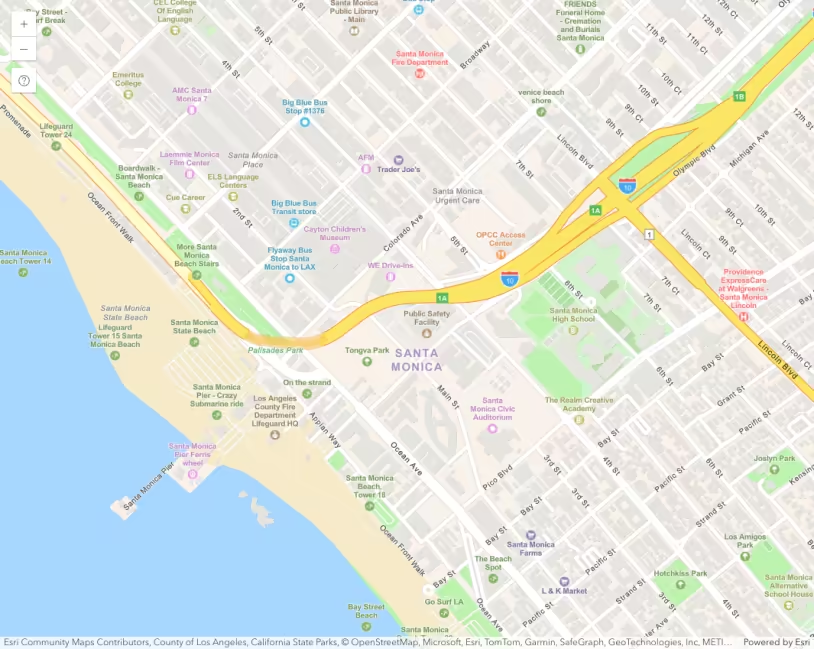
Basemap places
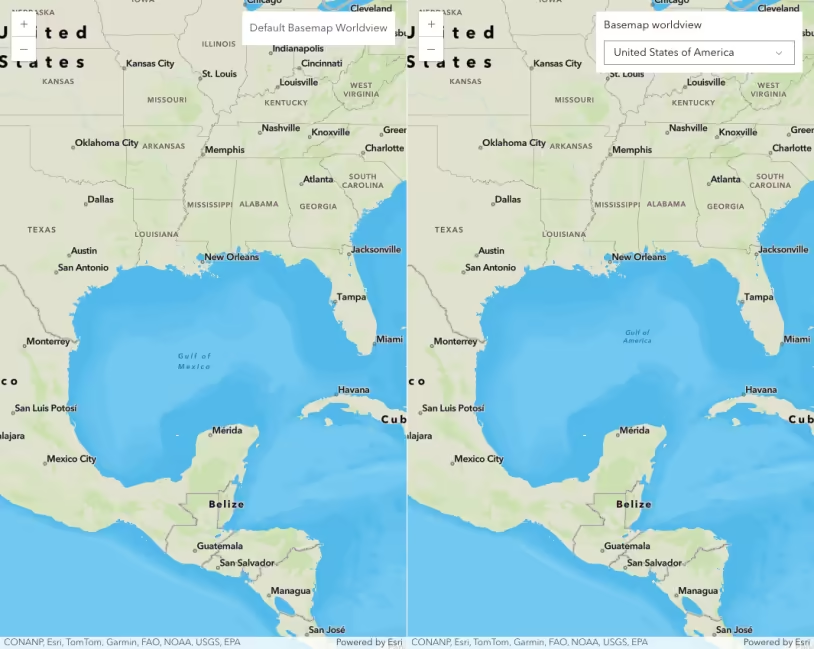
Basemap worldview
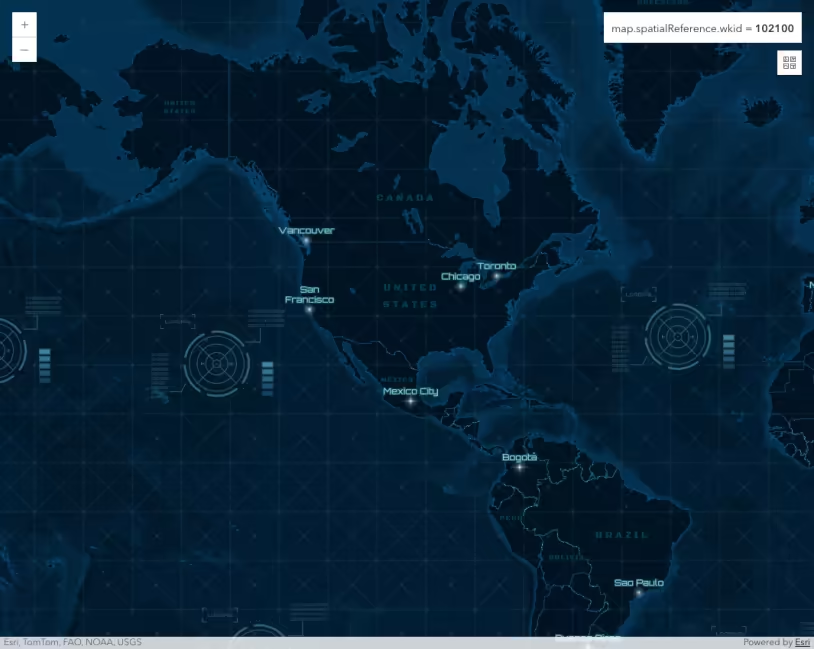
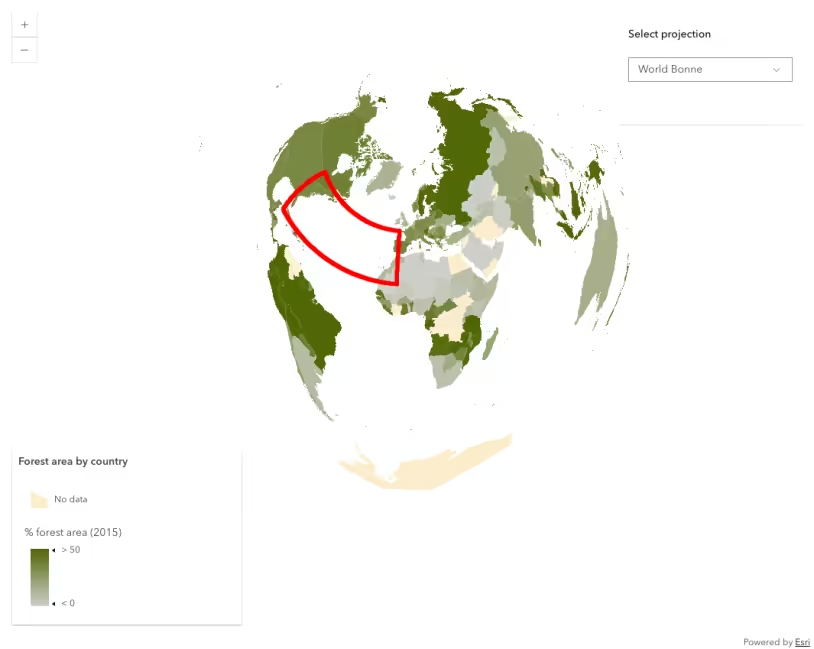
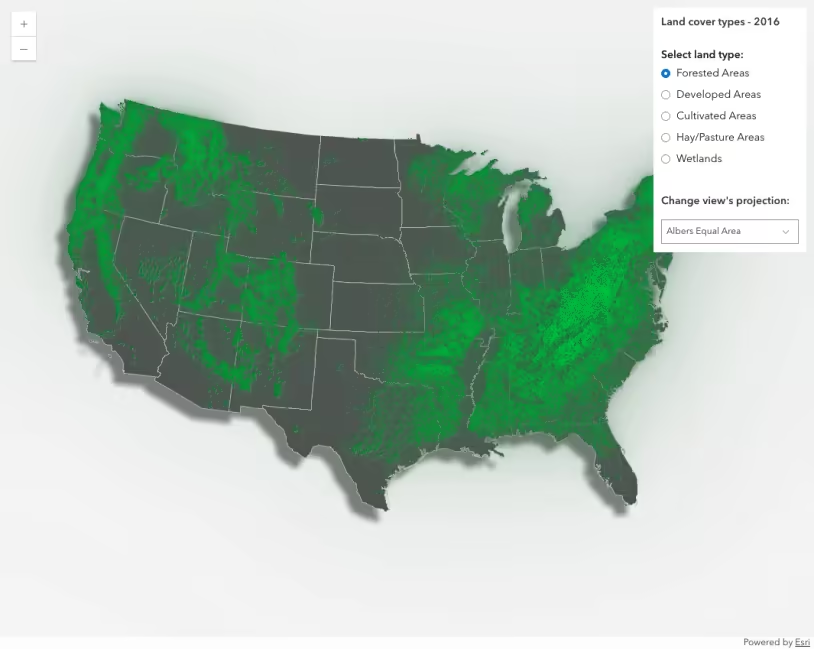
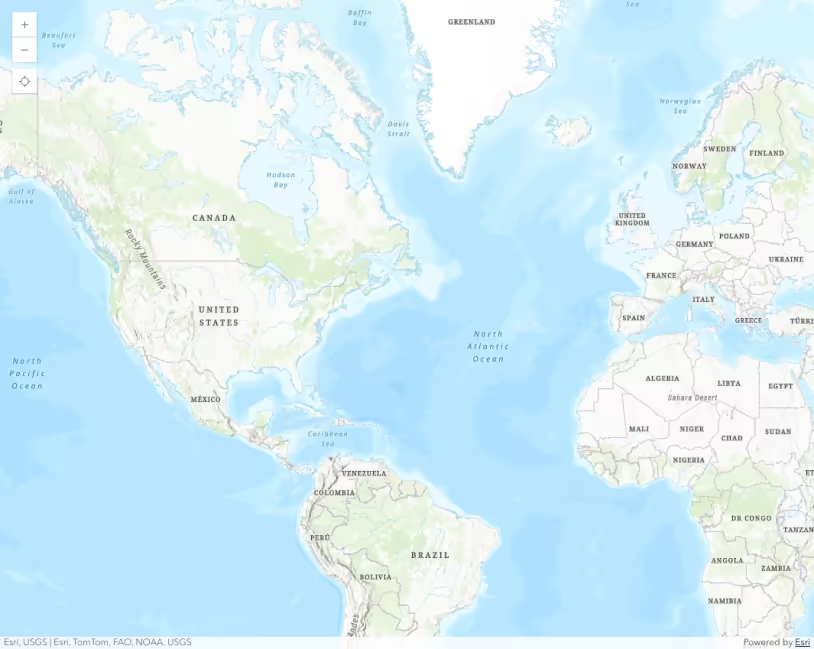
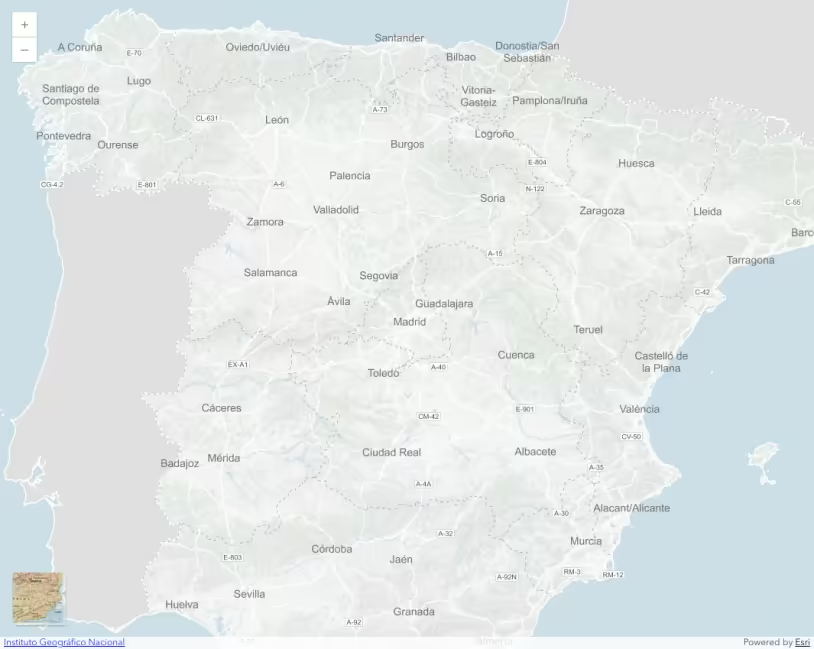
Basemaps with different projections
Binning - Filter by category
Binning polylines
Binning with aggregate fields
Blend modes in 3D
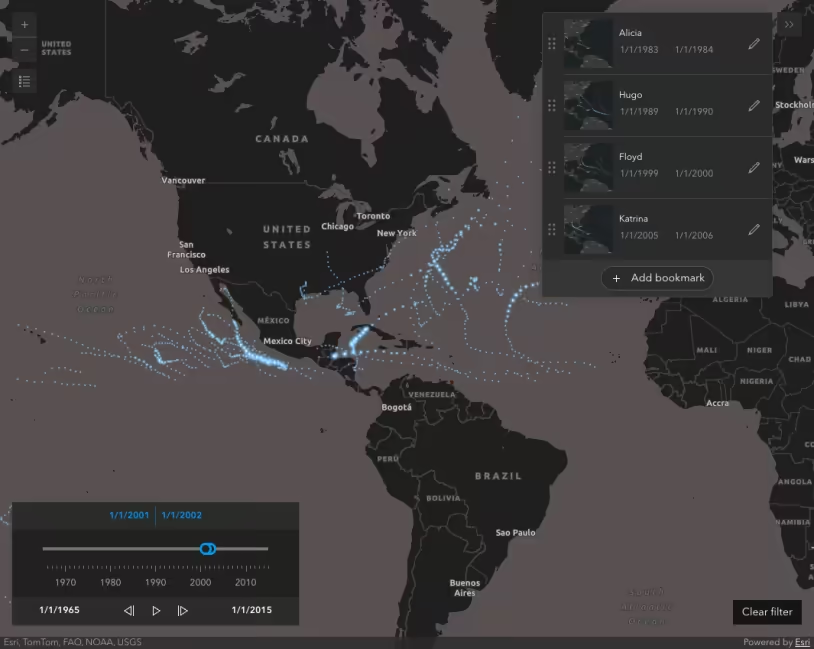
Bookmarks component
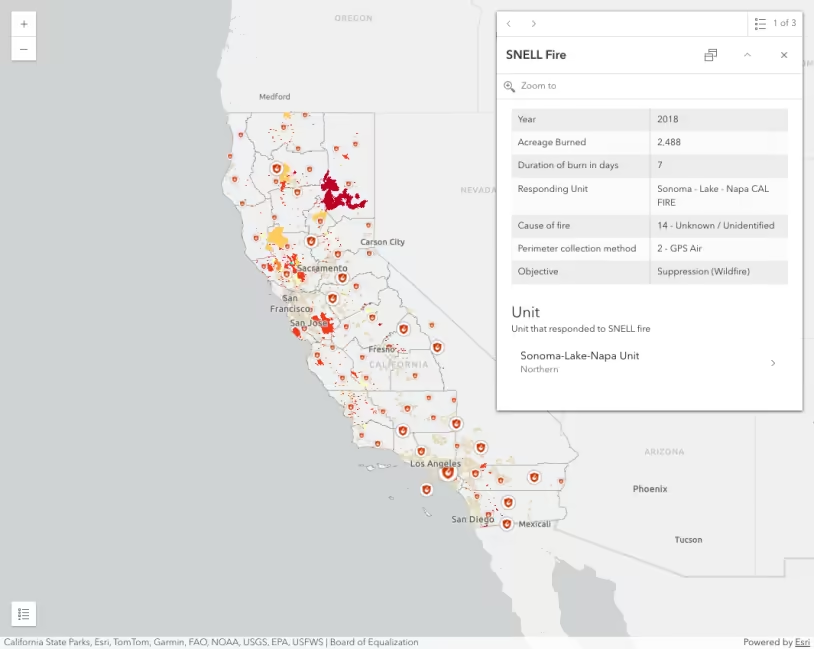
Browse related records in a popup
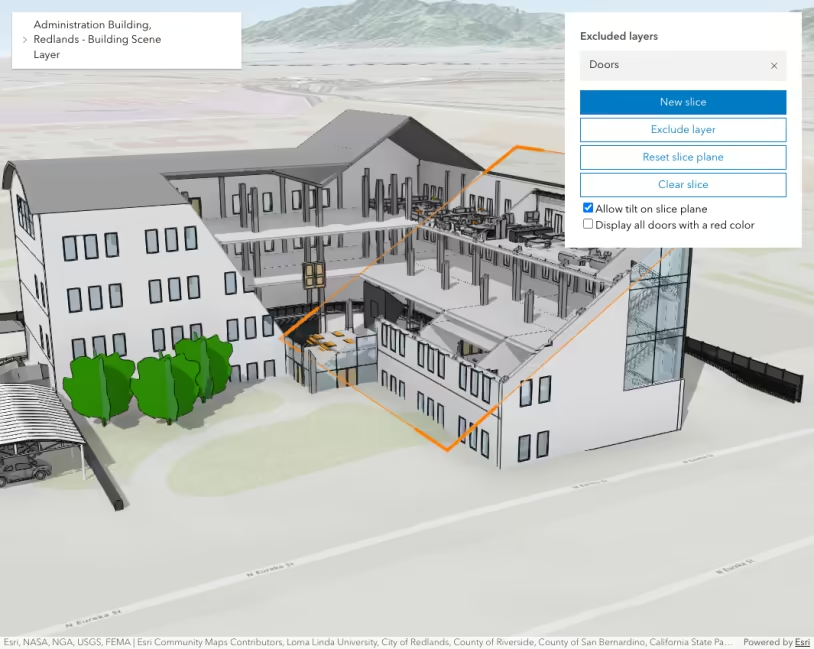
BuildingSceneLayer with Slice component
CIMSymbol lines and polygons
Client-side projection
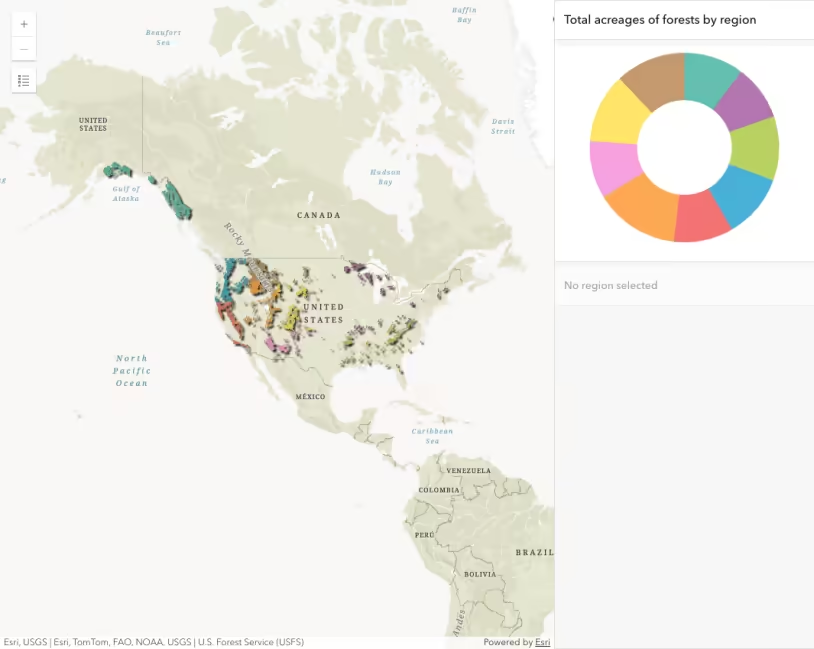
Client-side statistics and ArcGIS Pie Chart
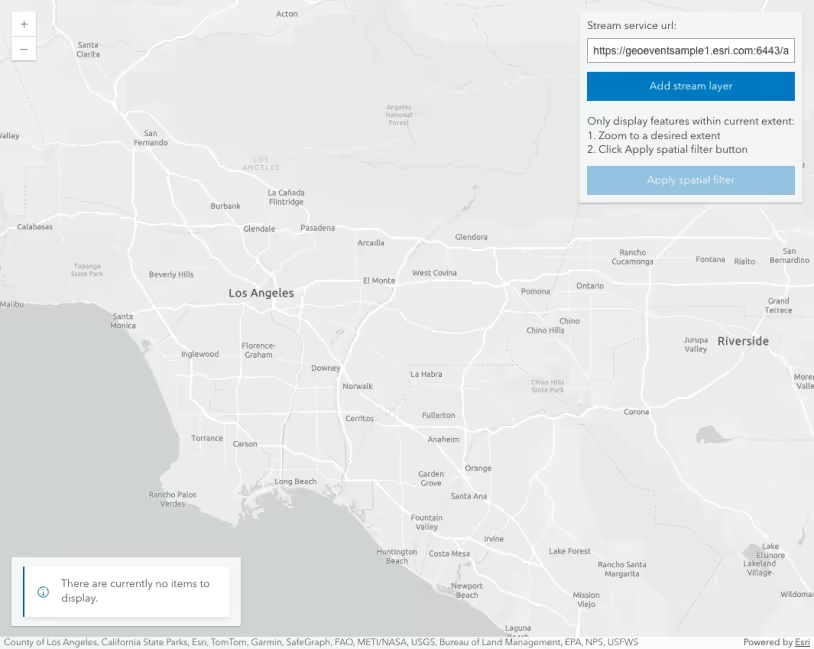
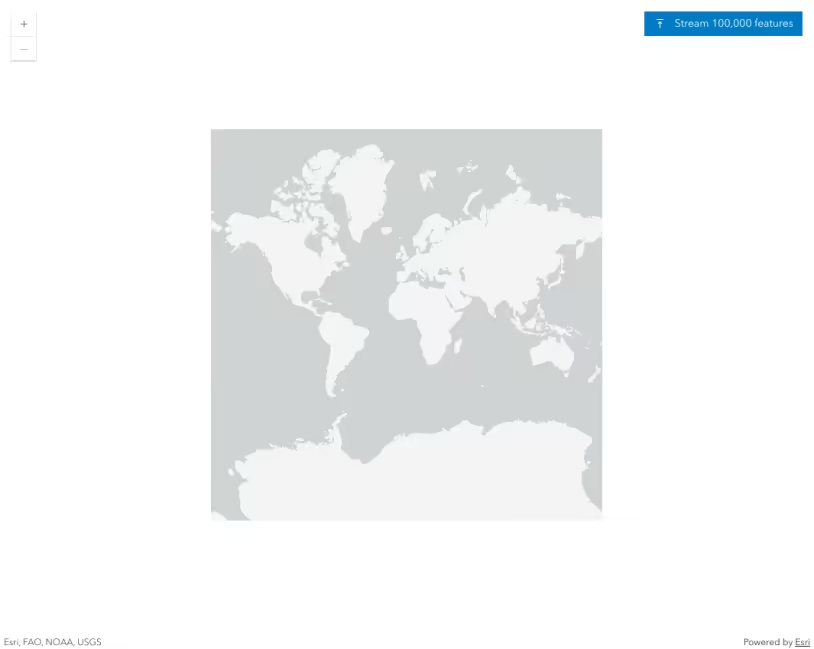
Client-side StreamLayer
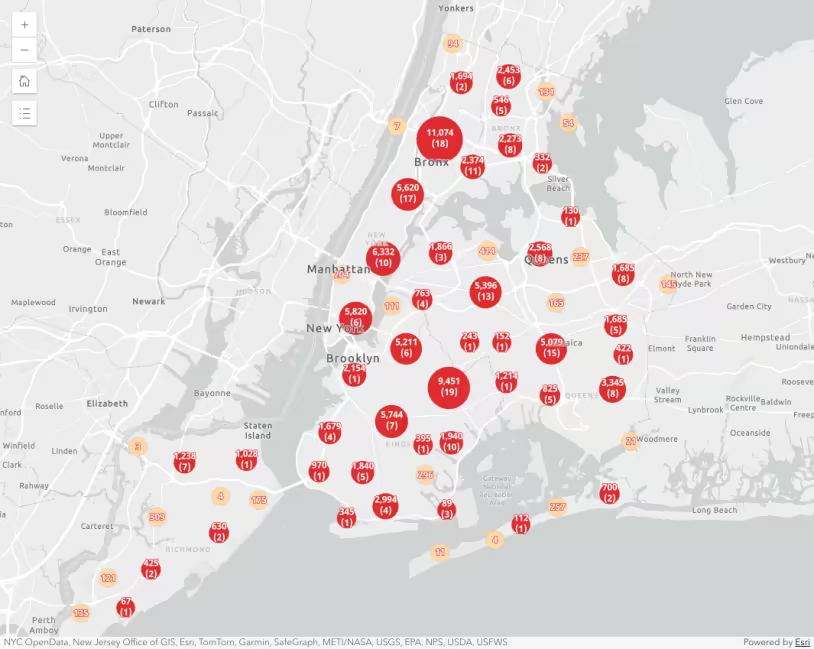
Cluster size based on the sum of a field
Clustered polygons
Clustering - advanced configuration
Clustering - filter popup features
Clustering - generate suggested configuration
Clustering - query clusters
Clustering with aggregate fields
Clustering with visual variables
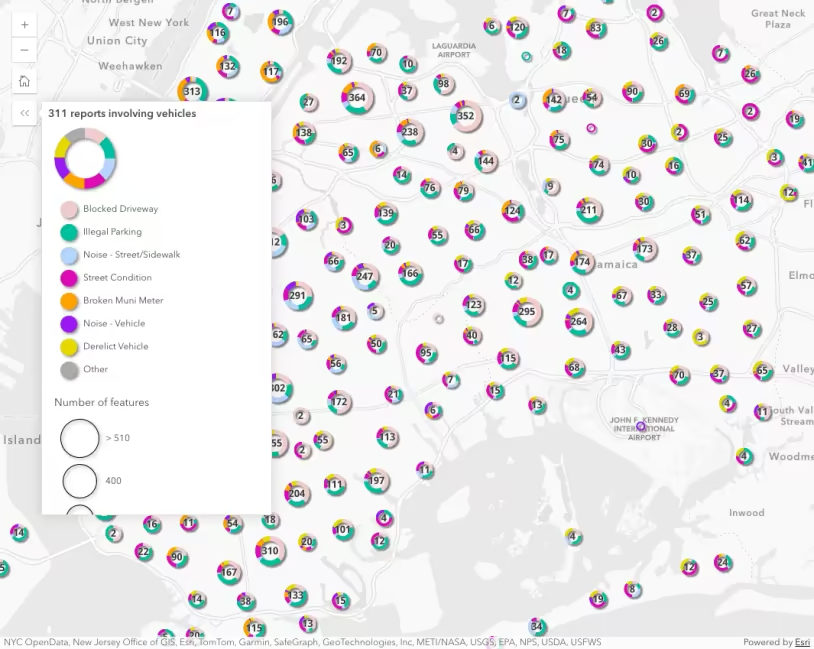
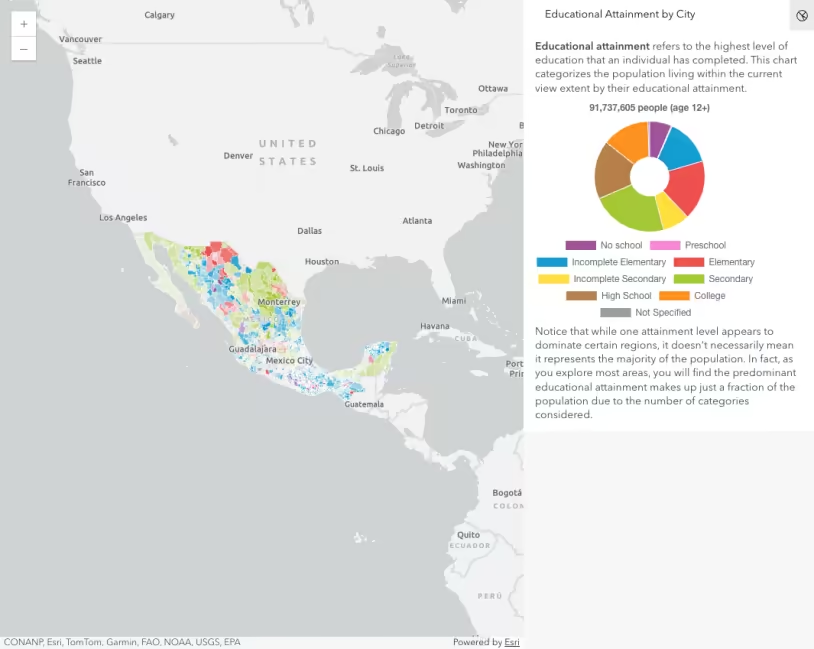
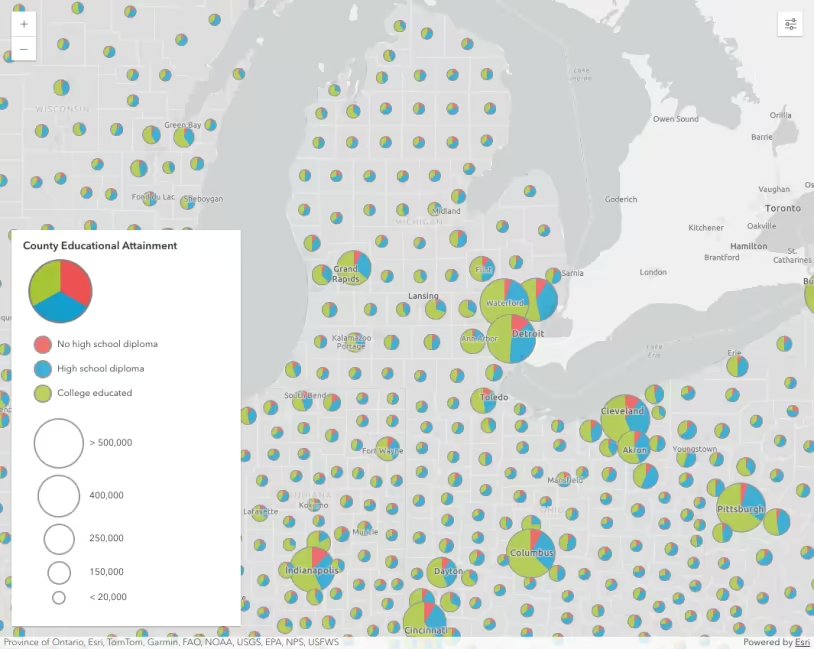
Clusters as pie charts
Color theming for interactive tools
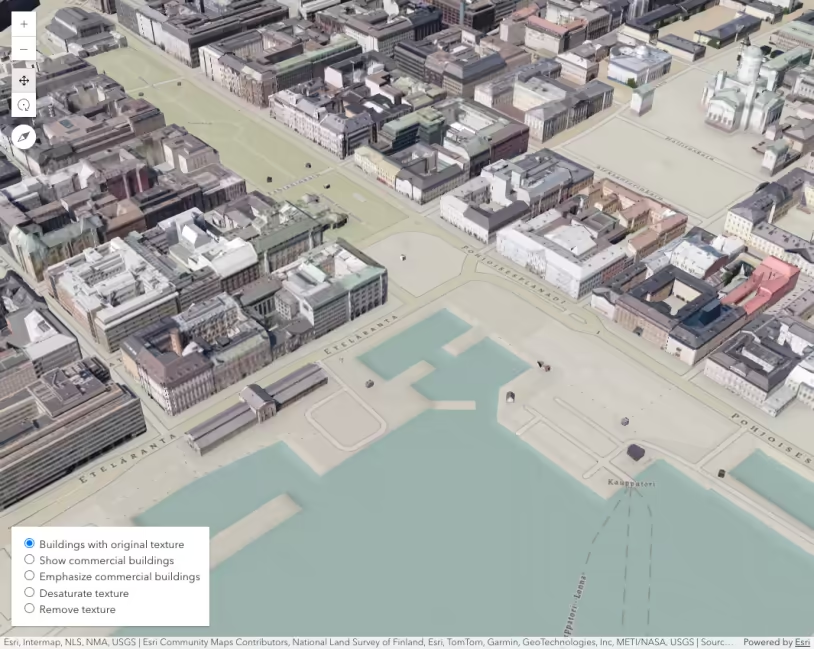
Coloring options for textured buildings
Composite blending
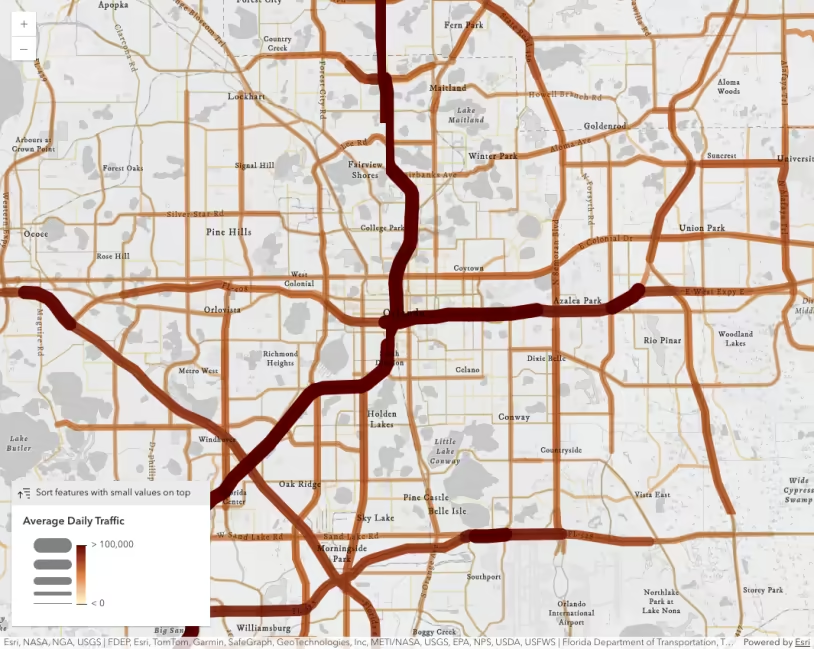
Configure feature sort order
Configuring the popup of a VoxelLayer
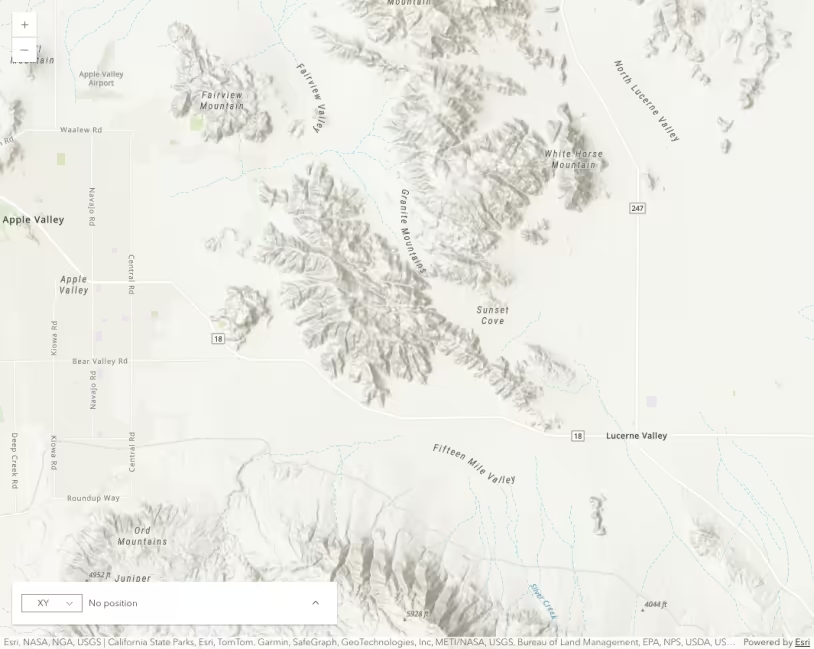
Coordinate Conversion component
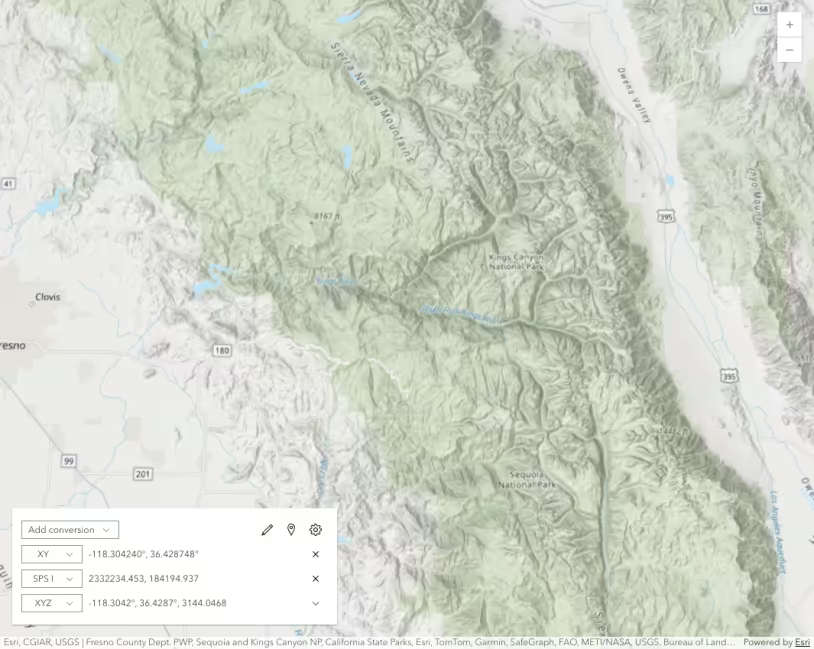
Coordinate Conversion component - Custom Formats
Create a custom visualization using Arcade
Create a FeatureLayer from a shapefile
Create a FeatureLayer with client-side graphics
Create a layer from a portal item
Create a LinkChart
Create a local scene
Create a reference size visualization
Create a scale-dependent visualization
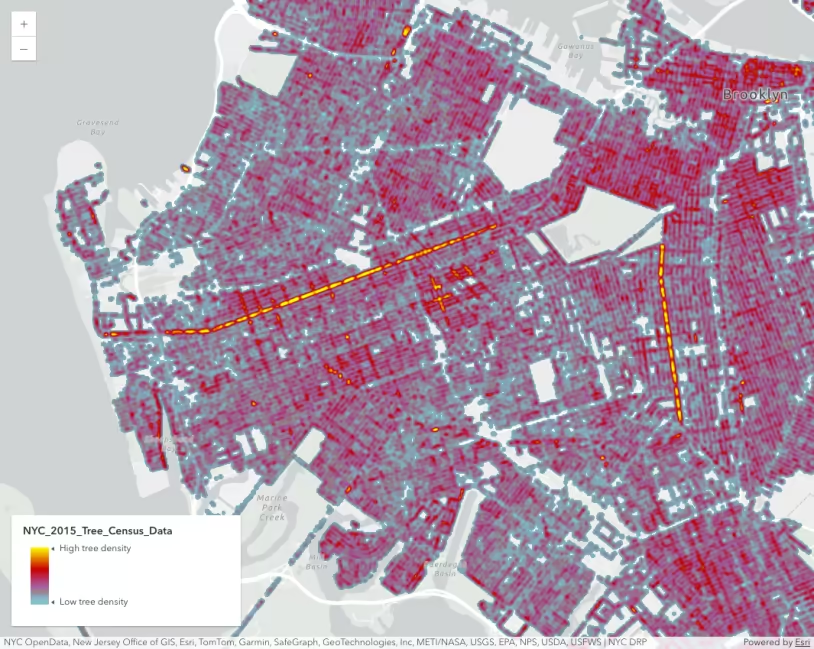
Create a static heatmap
Create an app with composite views
Create area of interest for VoxelLayer
Create popup charts from Arcade expressions
CSVLayer - Project points on the fly
Custom background for Scene
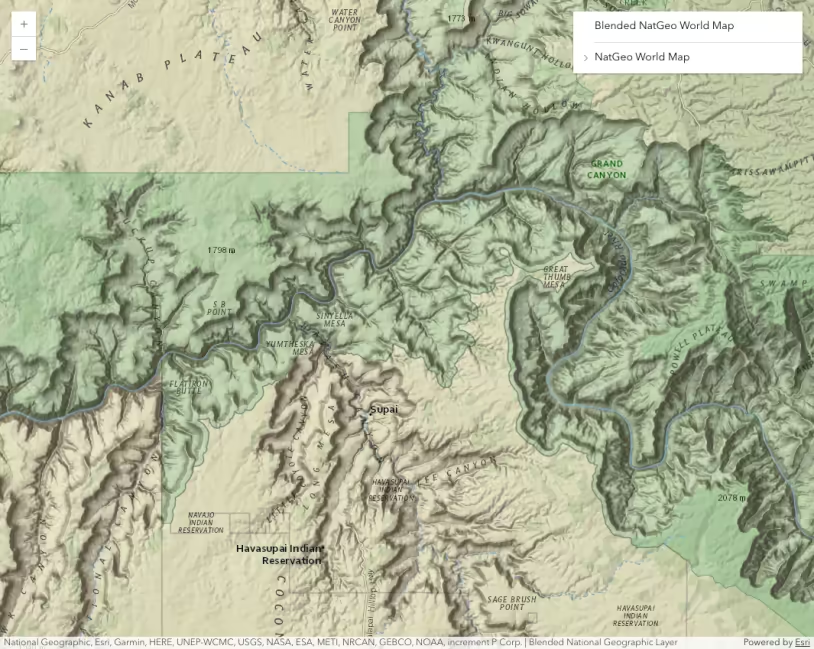
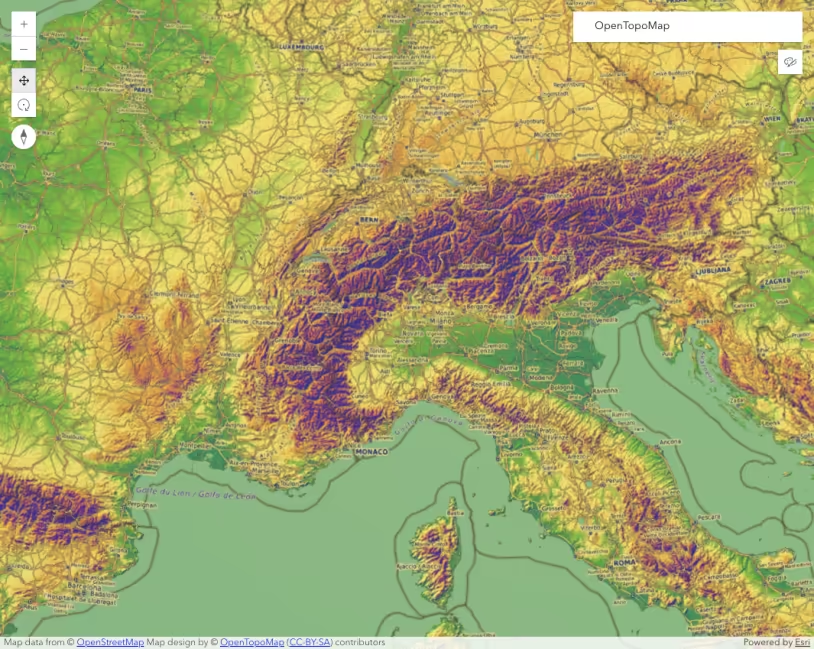
Custom Basemap
Custom BlendLayer
Custom DynamicLayer
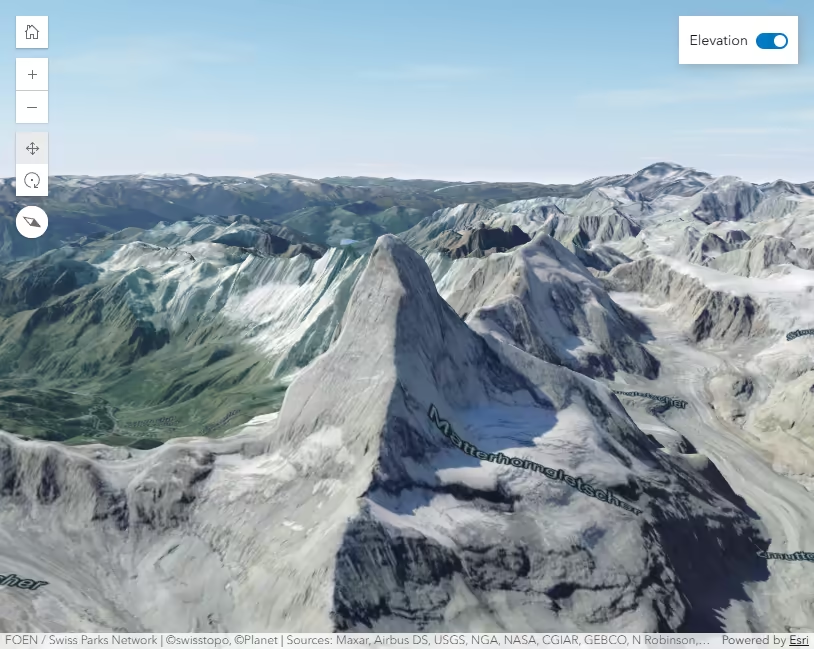
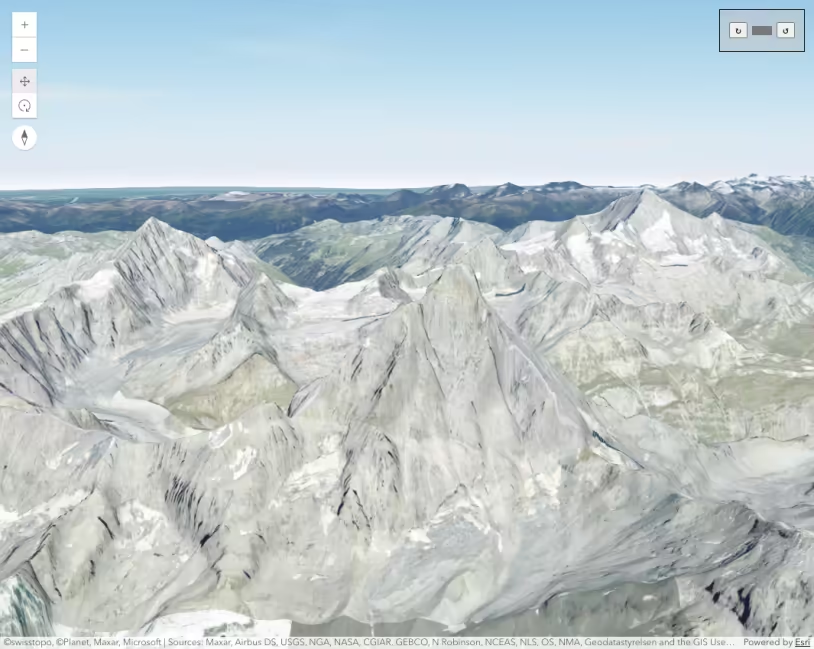
Custom ElevationLayer - Exaggerating elevation
Custom ElevationLayer - Thematic data as elevation
Custom LERC Layer
Custom popup actions per feature attribute
Custom popup content
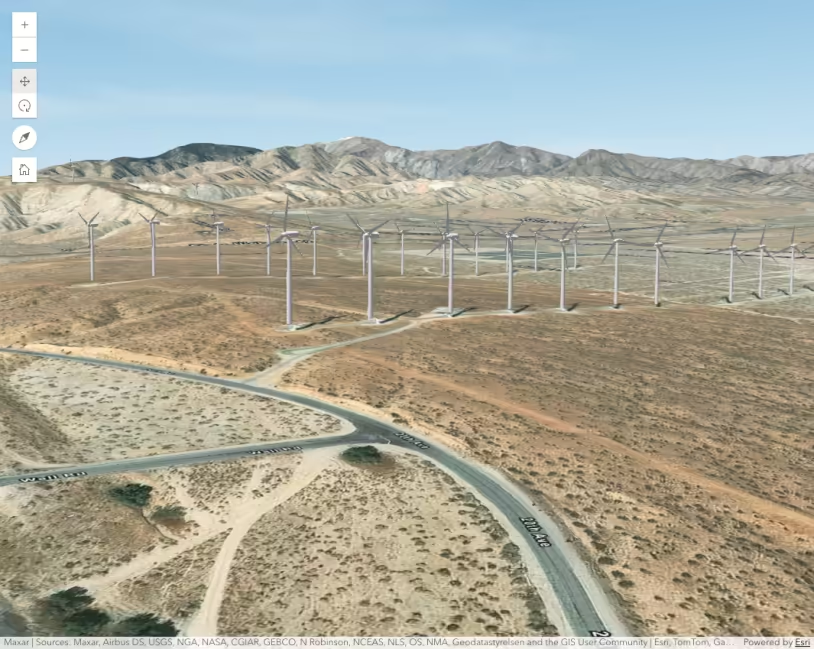
Custom RenderNode - Animated Windmills
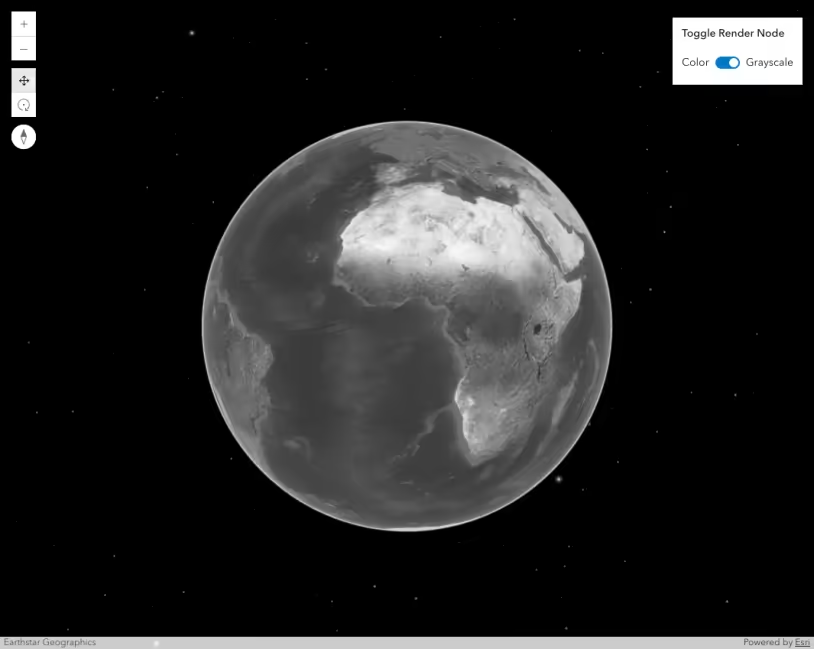
Custom RenderNode - Color modification
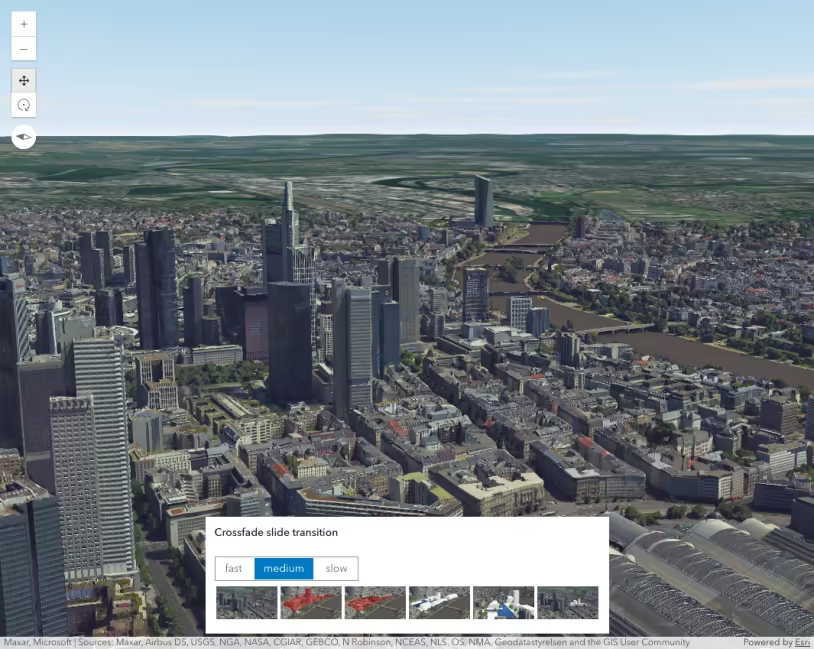
Custom RenderNode - Cross-fade slide transition
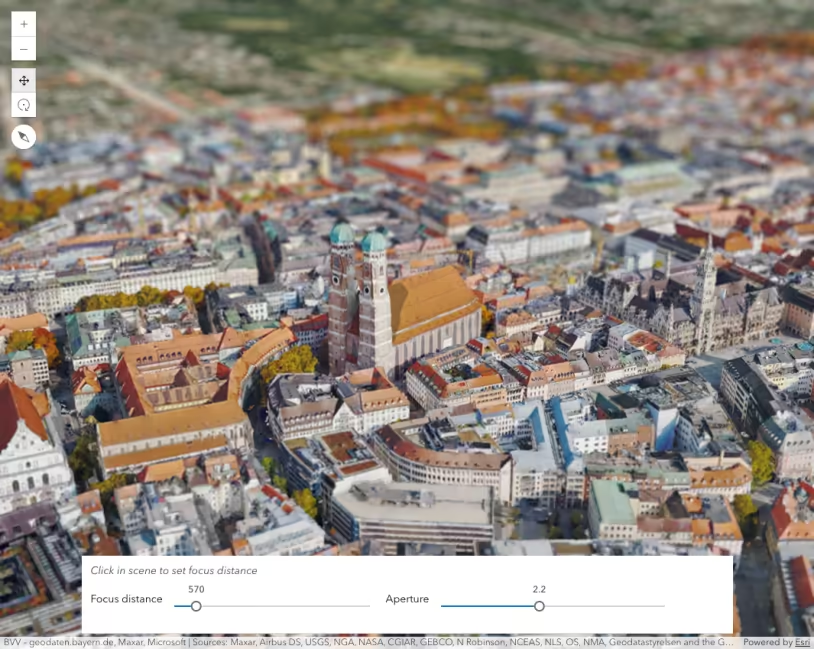
Custom RenderNode - Depth of field
Custom TileLayer
Custom WebGL layer view
Customize ColorSlider Histogram
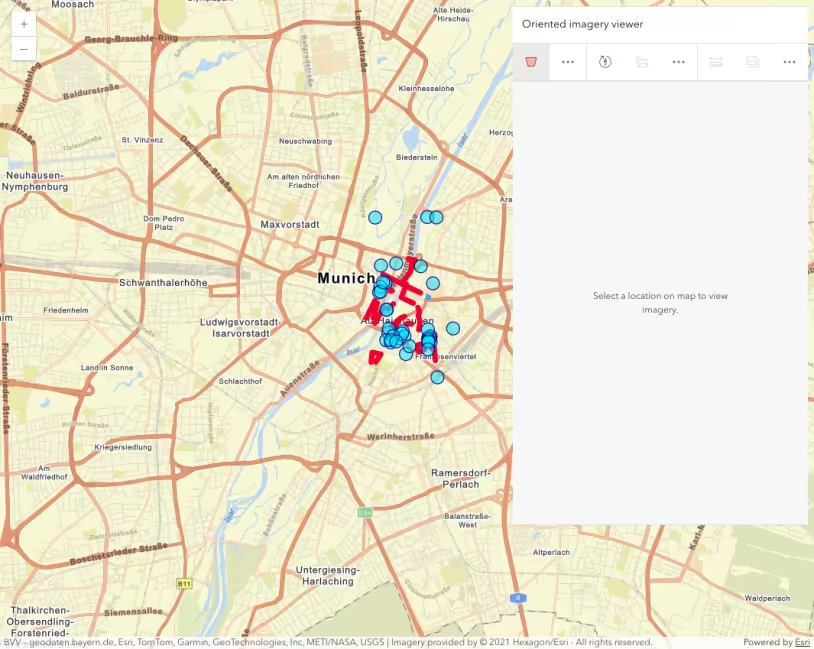
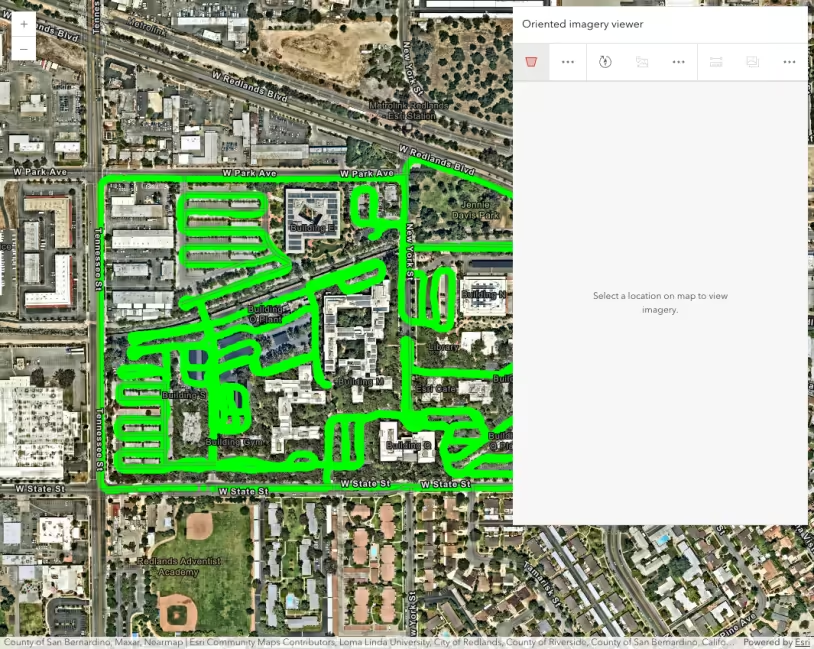
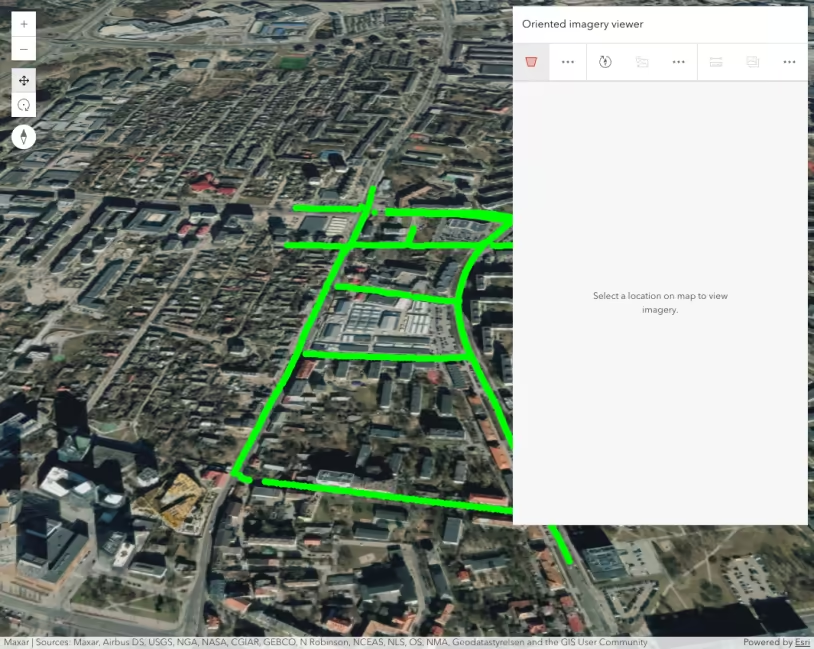
Data Capture in OrientedImageryViewer
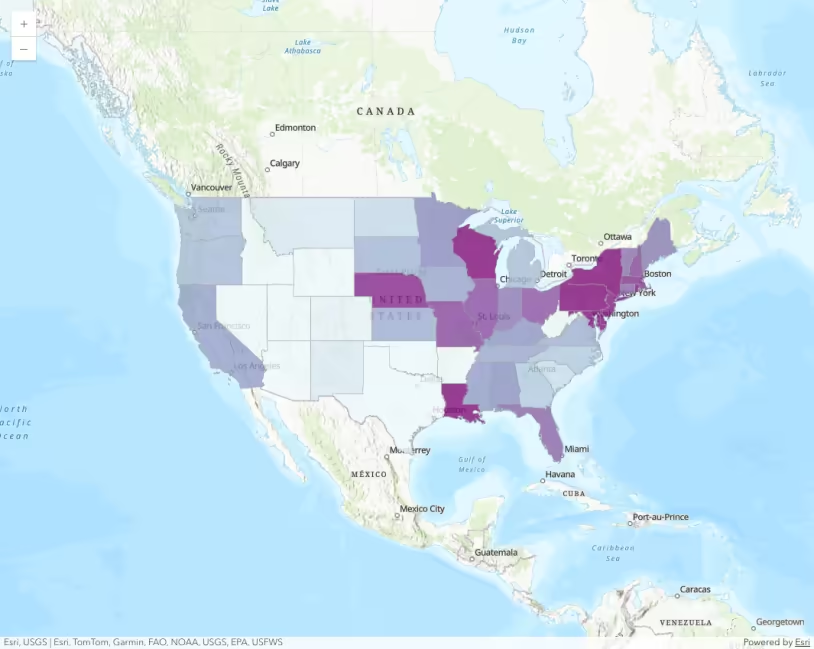
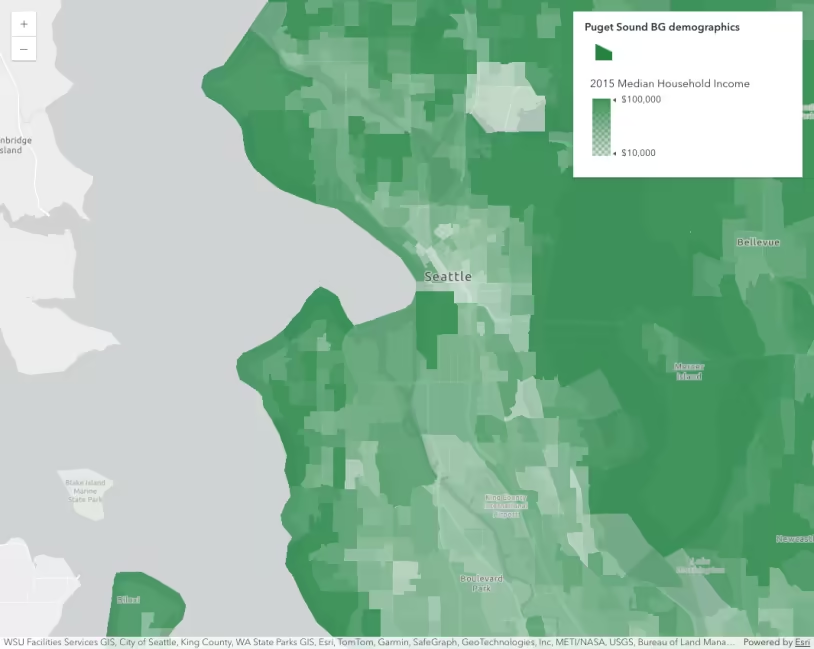
Data-driven continuous color
Data-driven continuous size
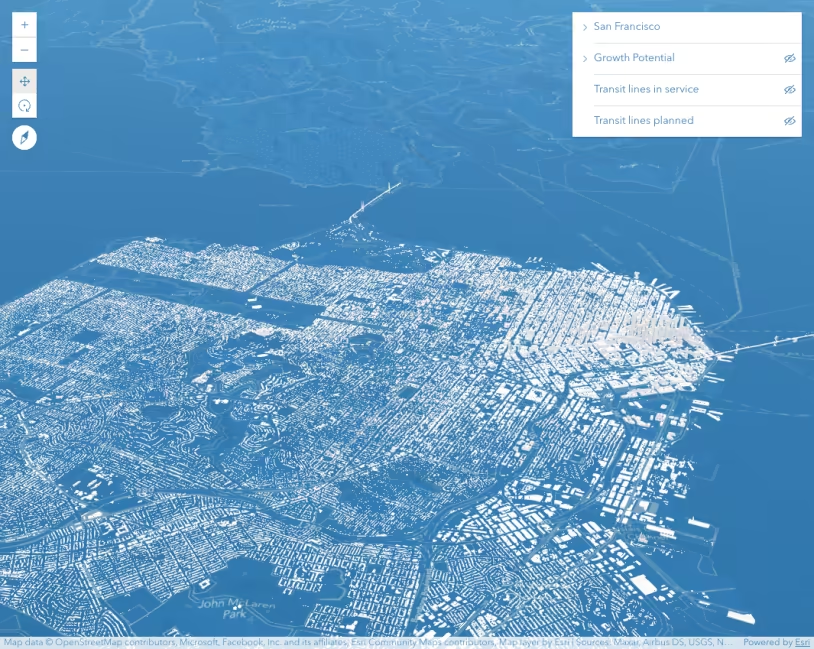
Data-driven extrusion
Data-driven opacity
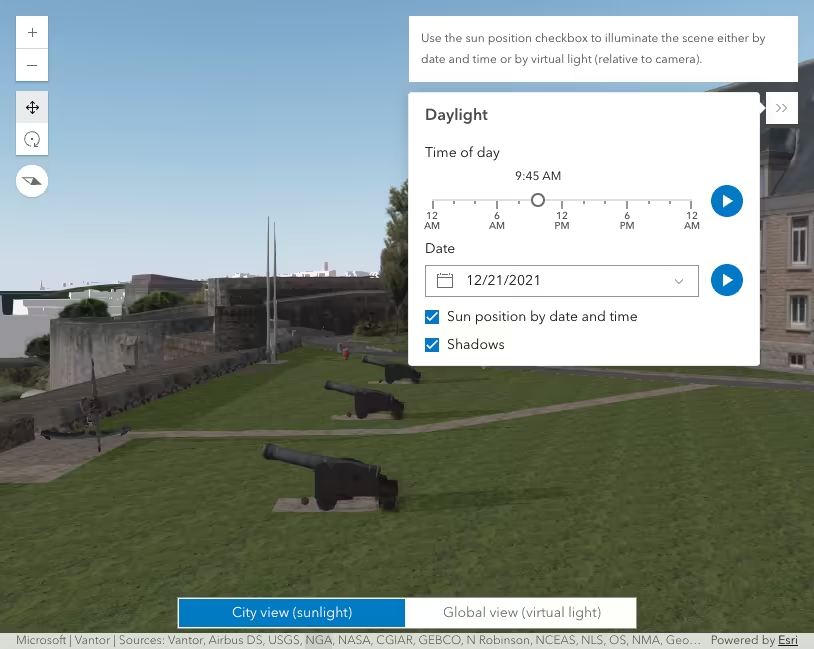
Daylight component
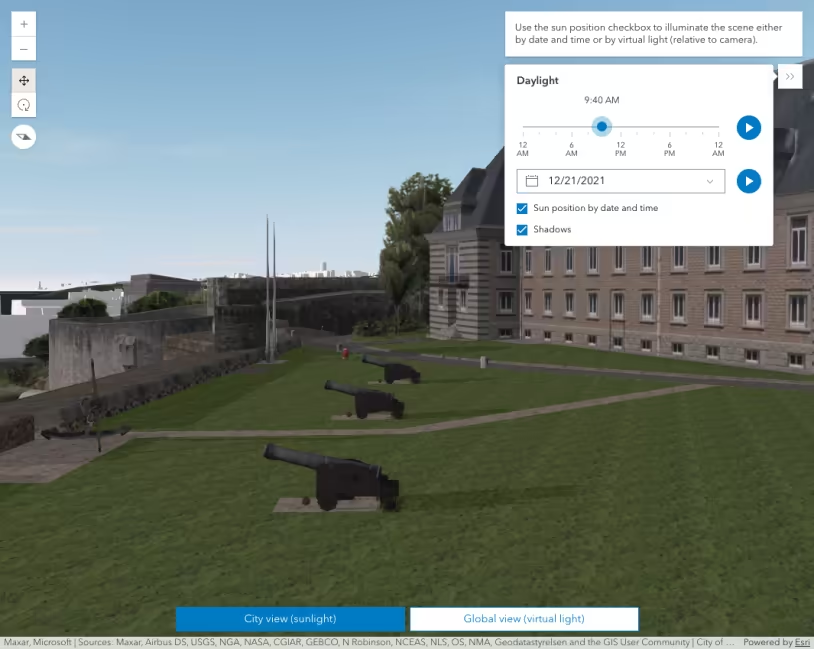
Daylight widget
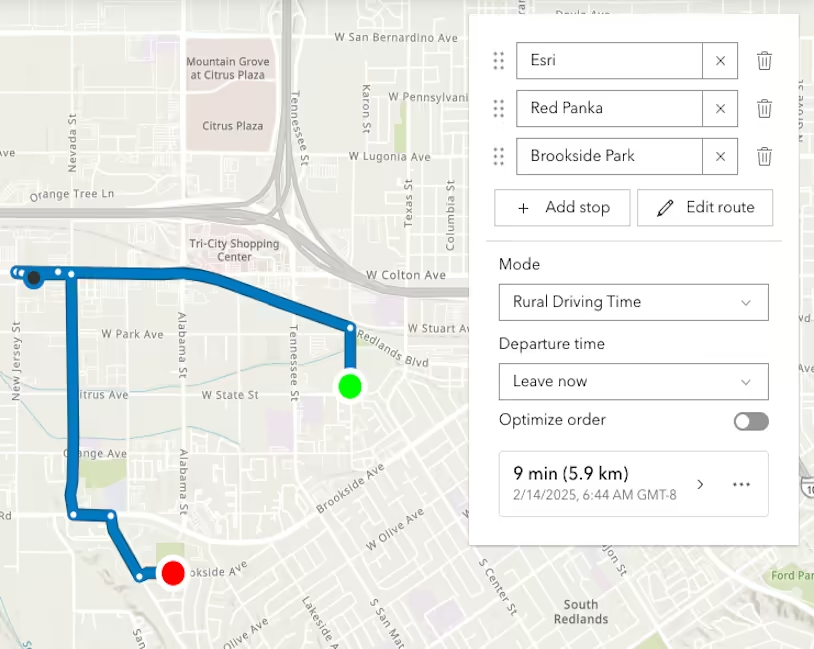
Directions component with RouteLayer
Disable all view navigation
Disable mouse-wheel and single-touch navigation
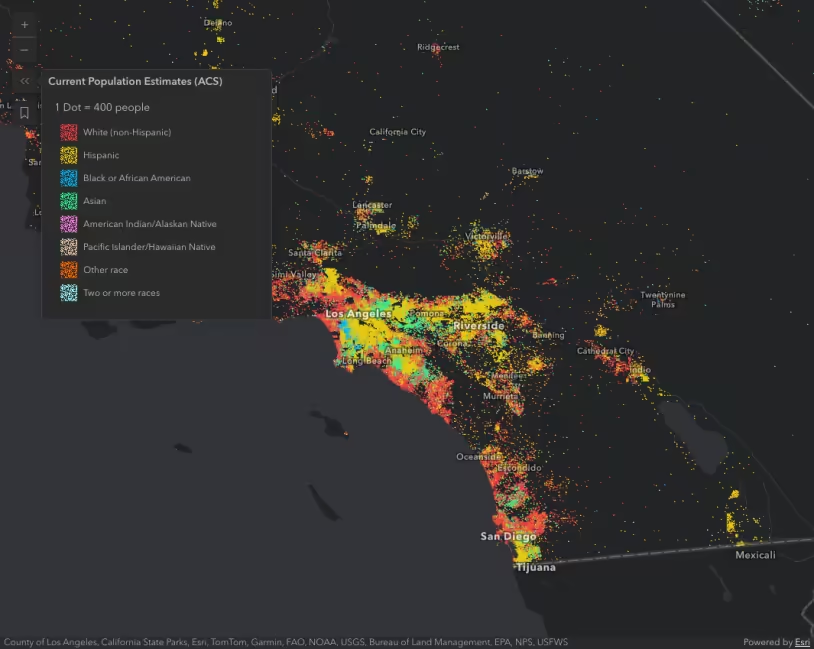
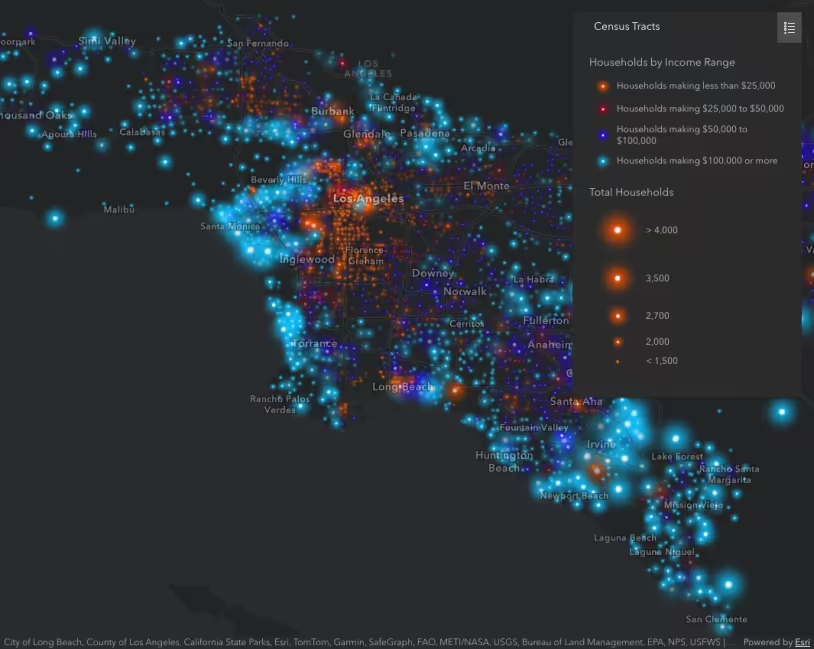
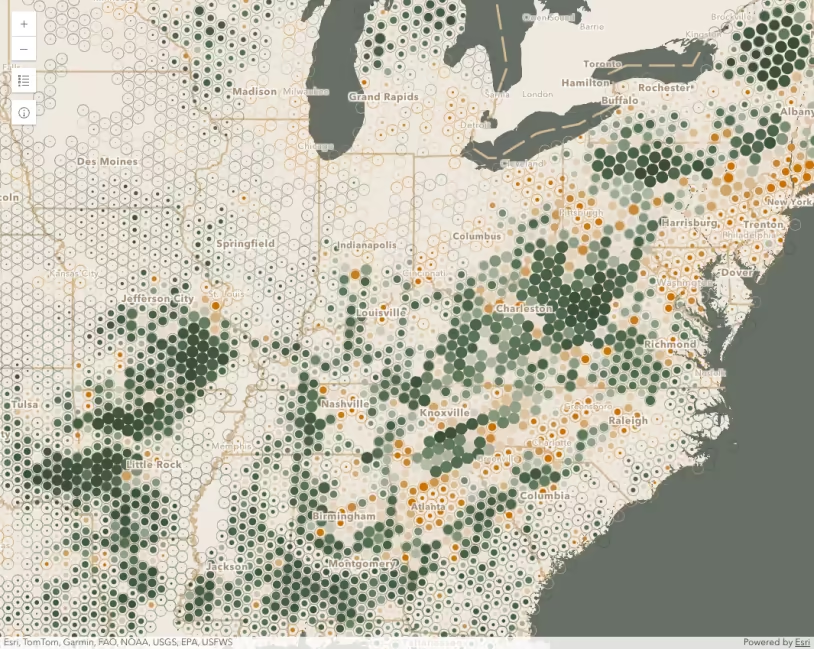
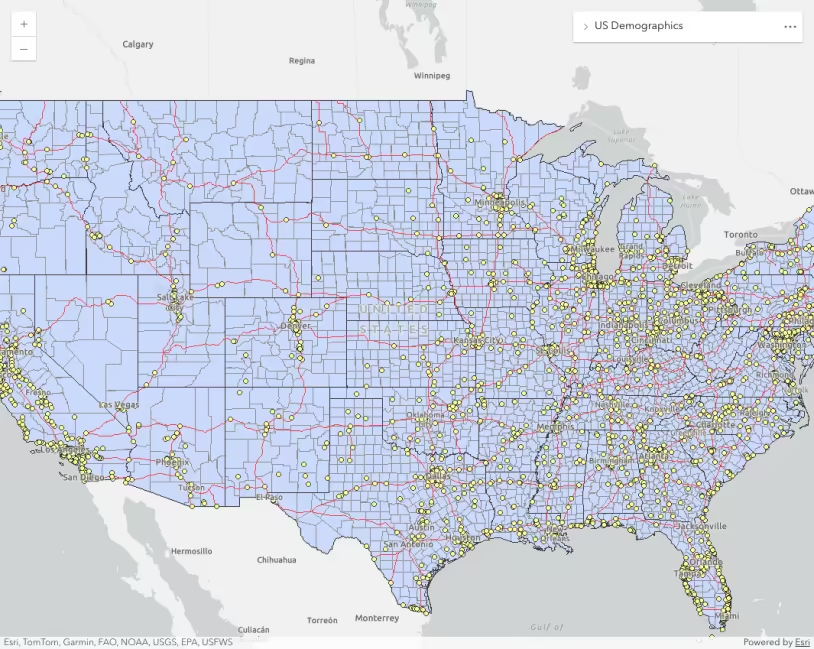
Dot density
Draw polyline
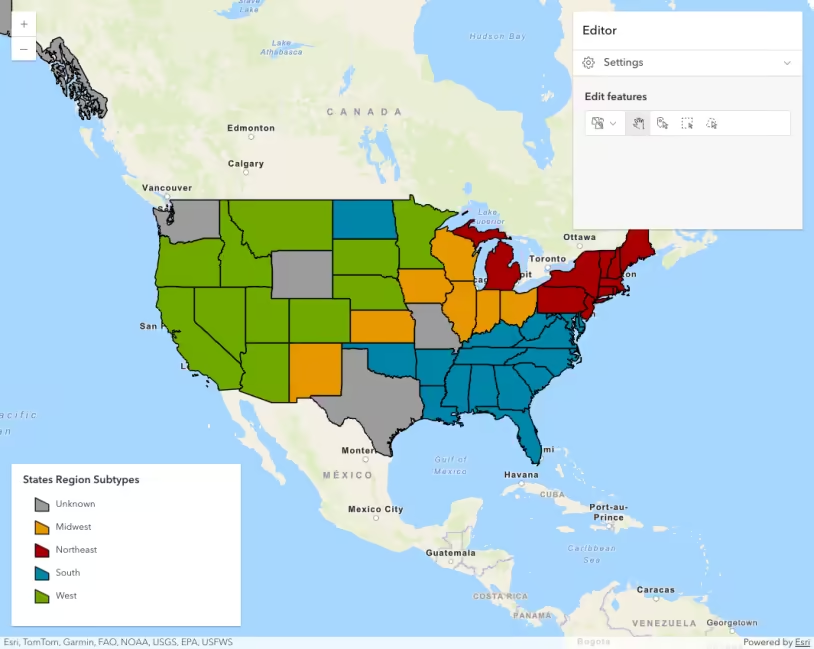
Edit FeatureLayer with subtypes
Edit FeatureLayers with form elements
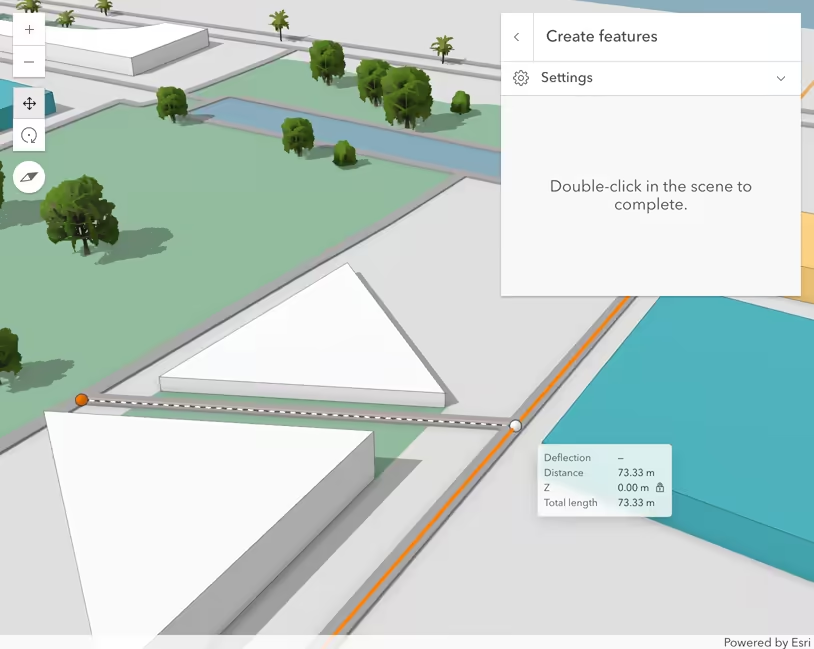
Edit features in 3D with the Editor component
Edit features in 3D with the Editor widget
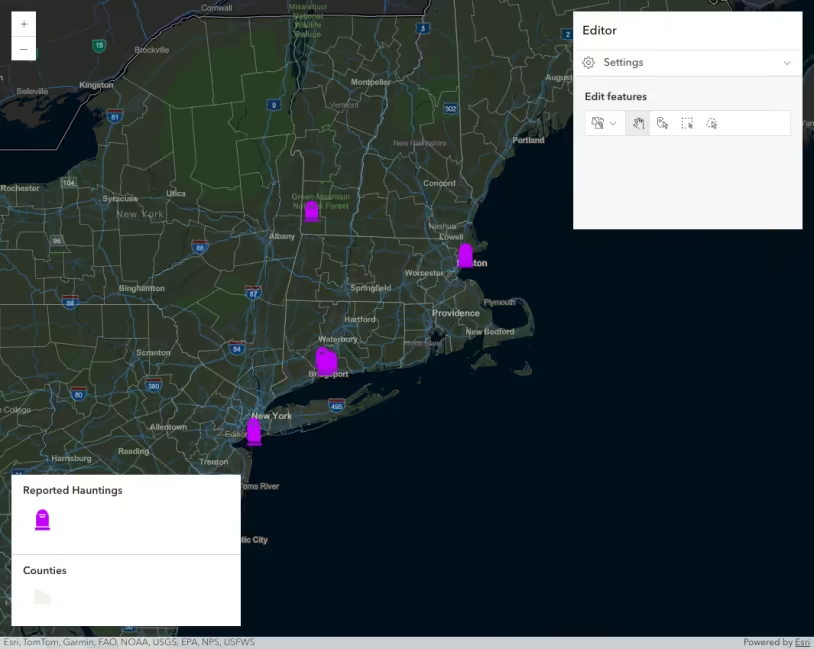
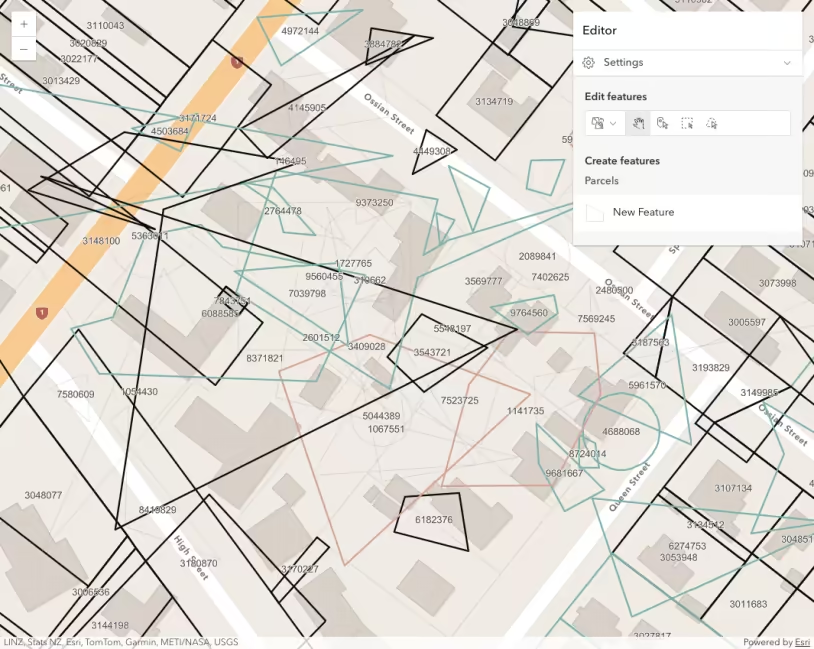
Edit features with the Editor component
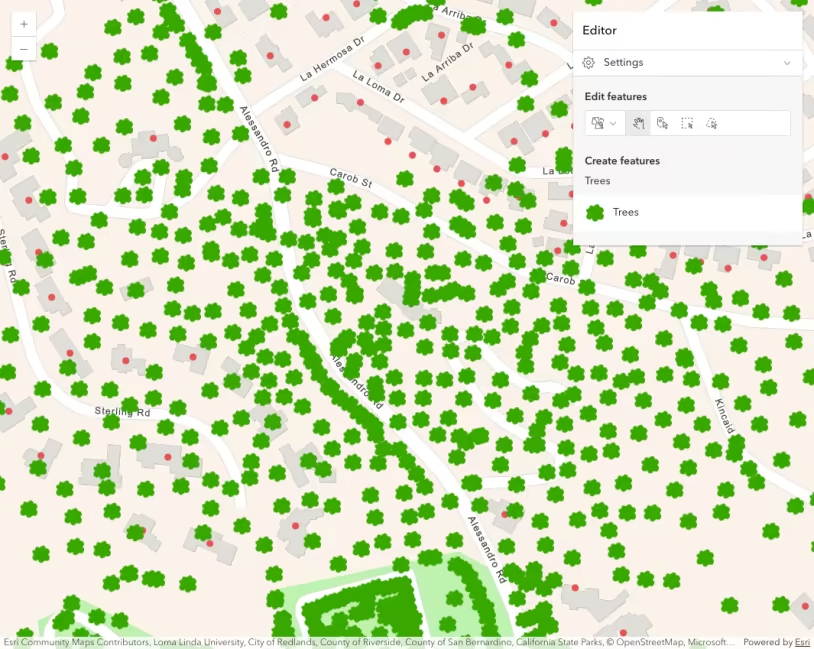
Edit features with the Editor widget
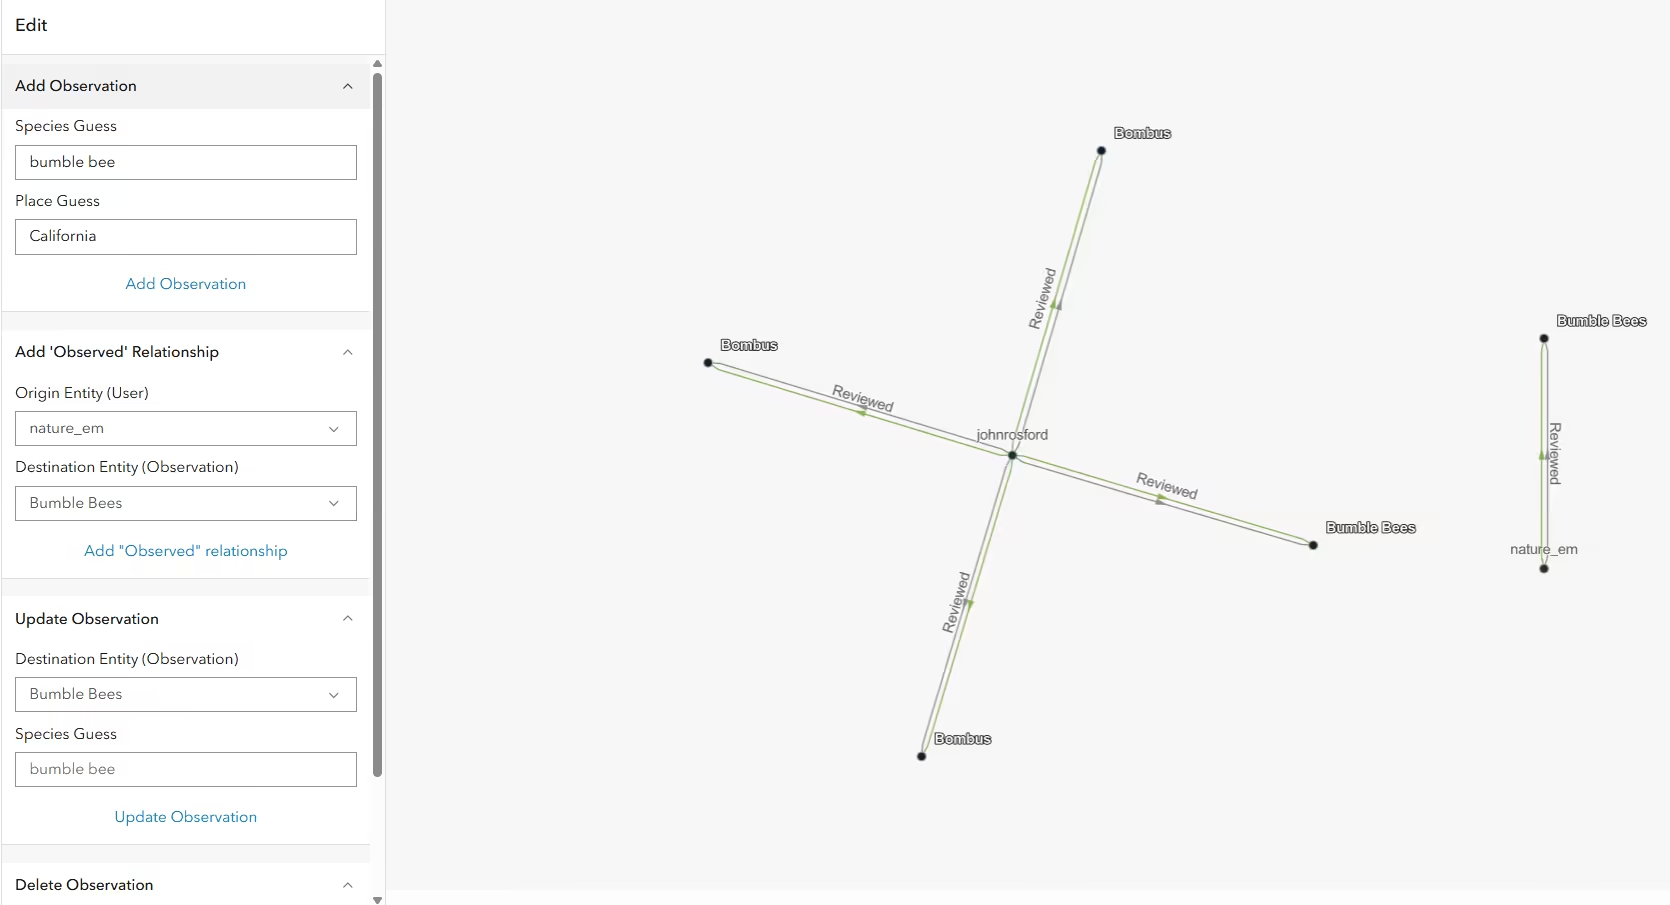
Edit Knowledge Graph Data
Editing related data with calculated expressions
Editing with calculated field expressions
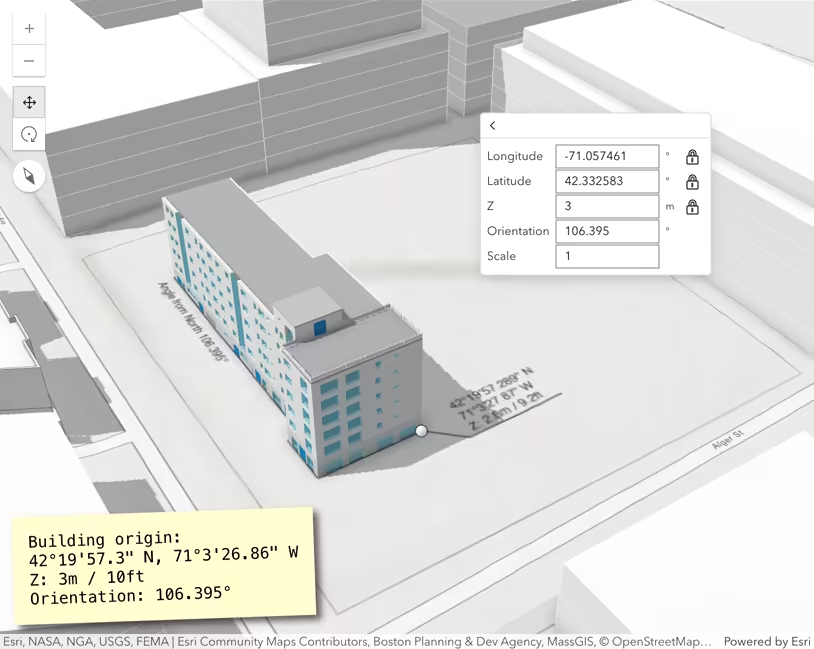
Editing with coordinate inputs
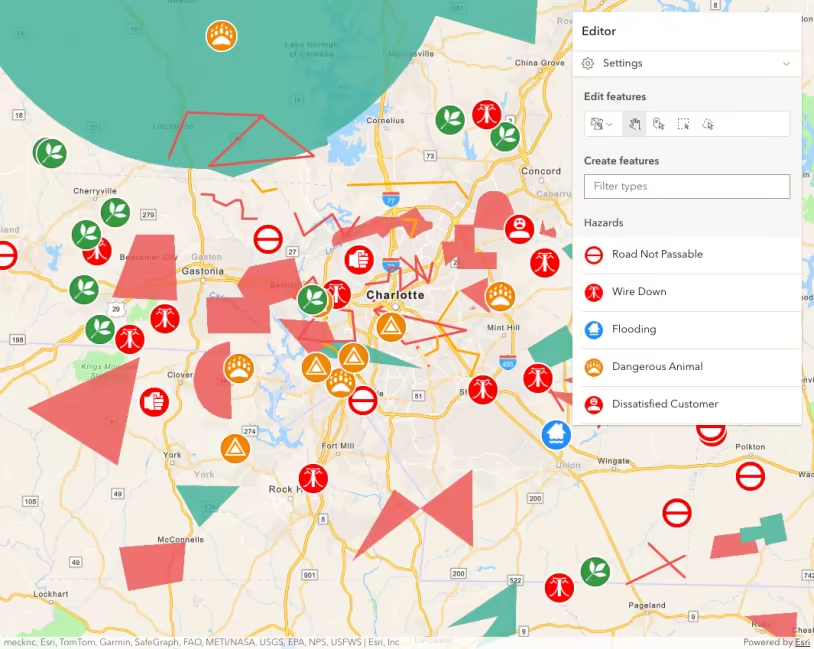
Editor widget with configurations
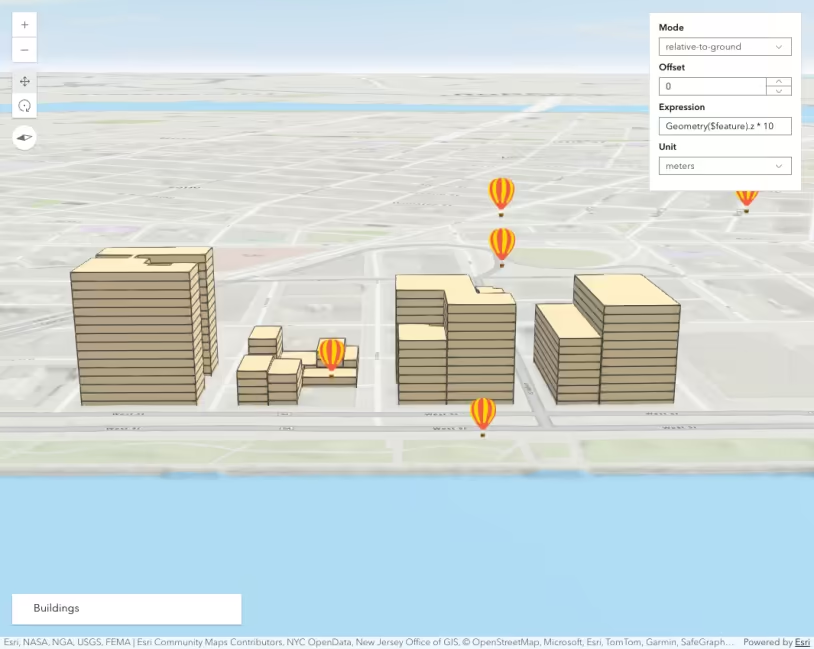
Elevation options
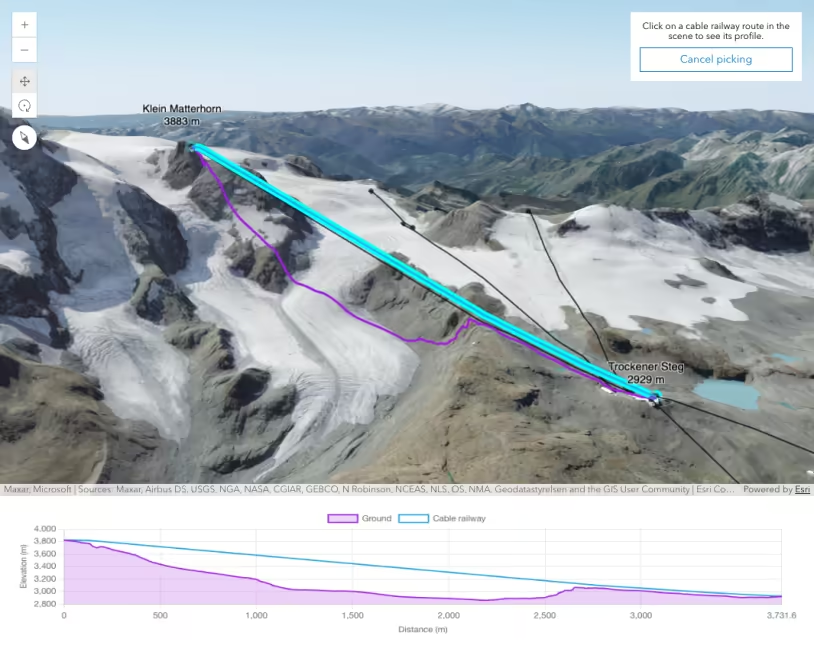
Elevation Profile analysis
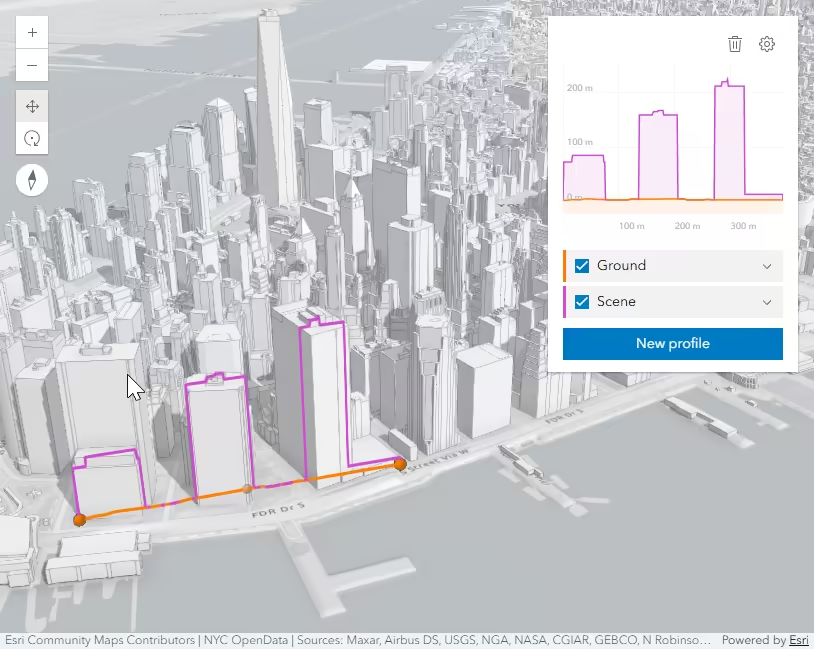
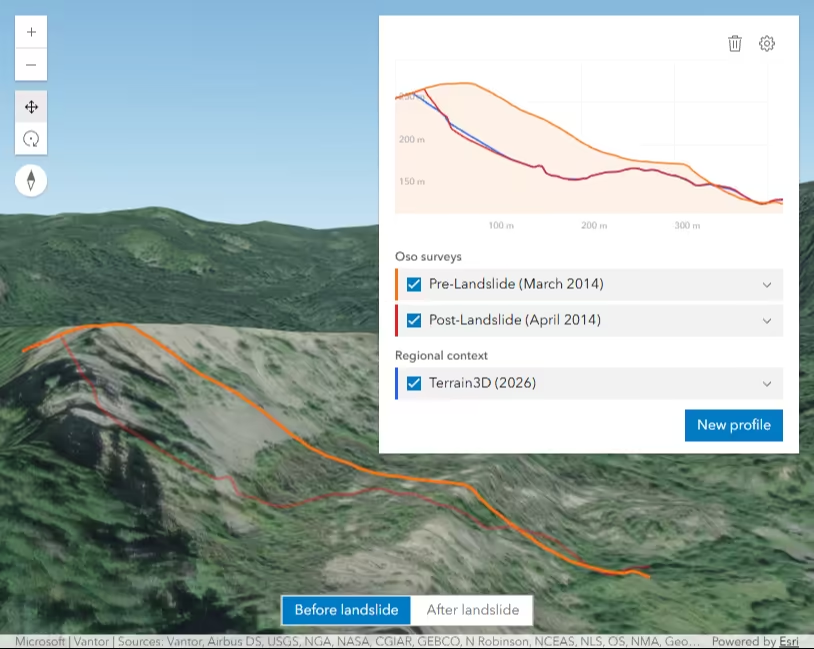
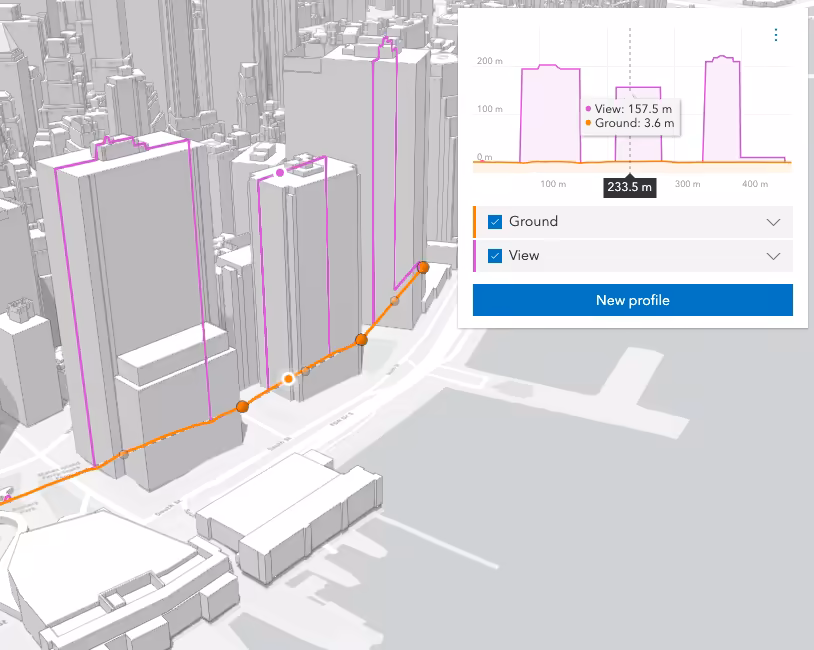
Elevation Profile component
Elevation Profile group
ElevationLayer
ElevationProfile Widget
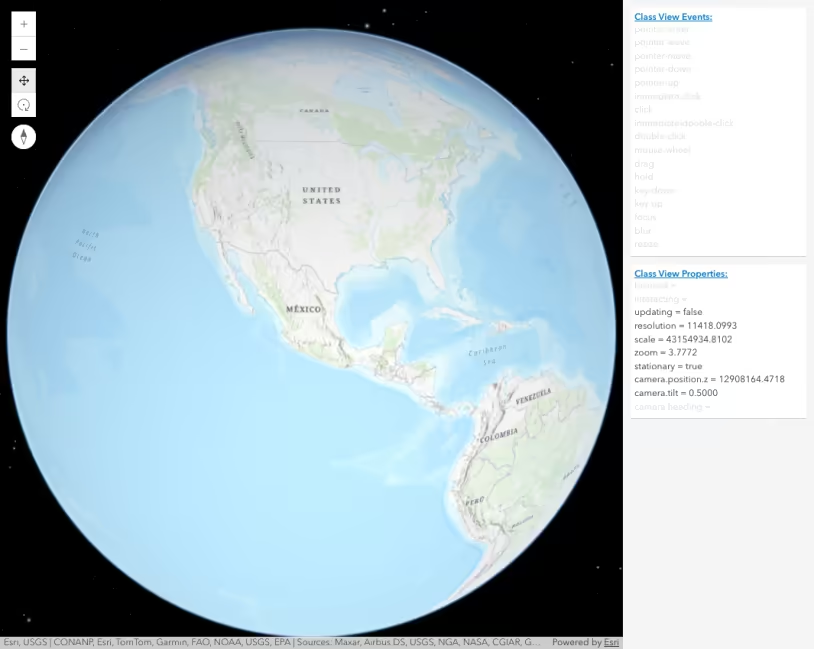
Event explorer / watch properties
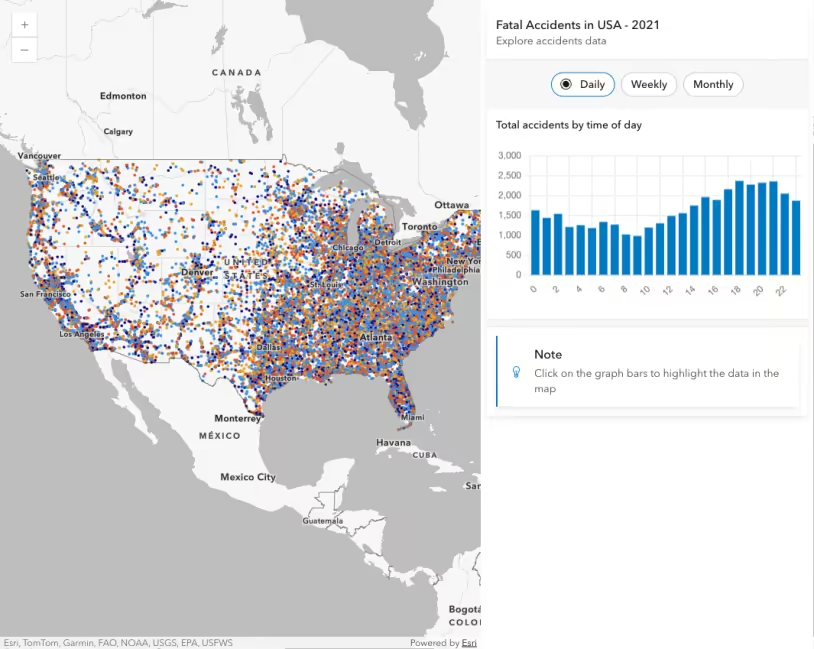
Execute Arcade for a custom chart
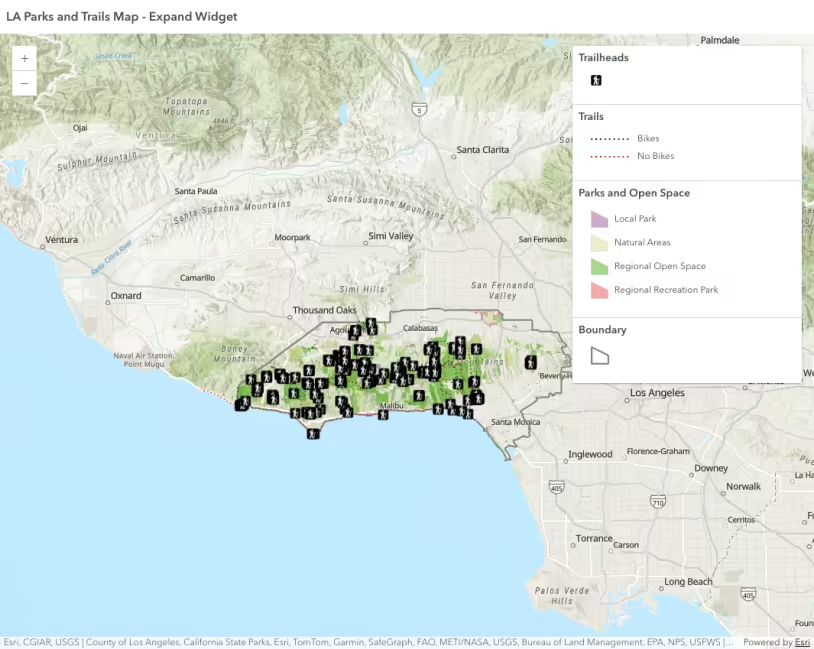
Expand component
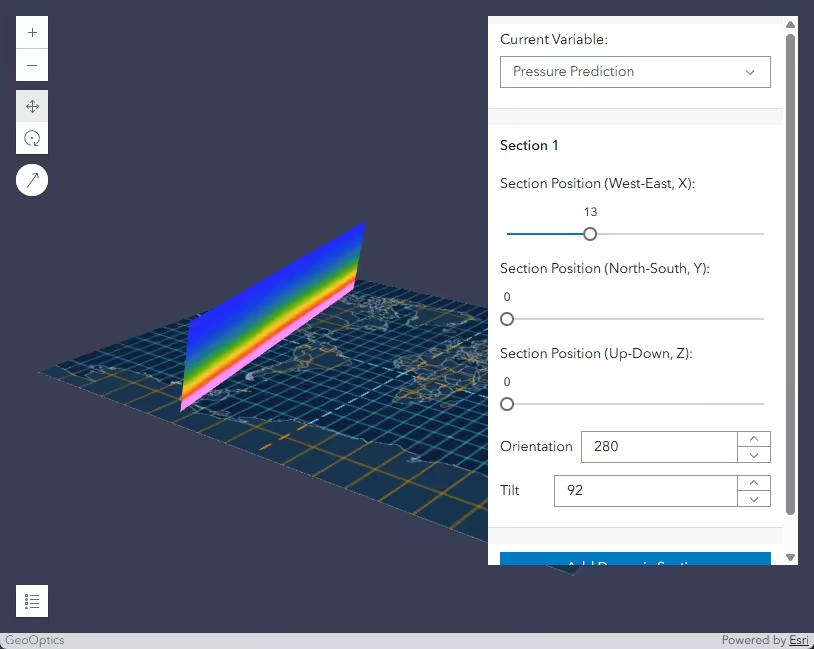
Explore a VoxelLayer using dynamic section
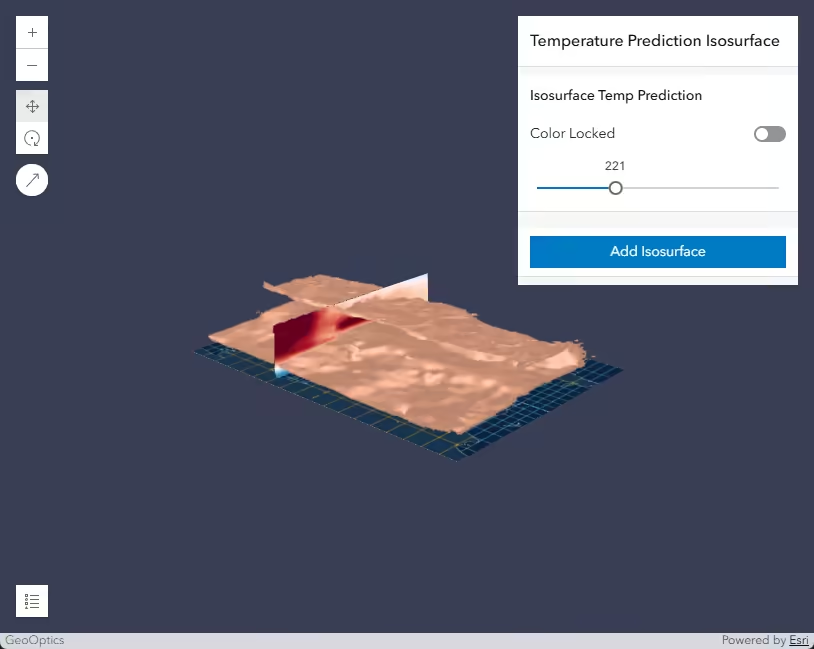
Explore a VoxelLayer using isosurface
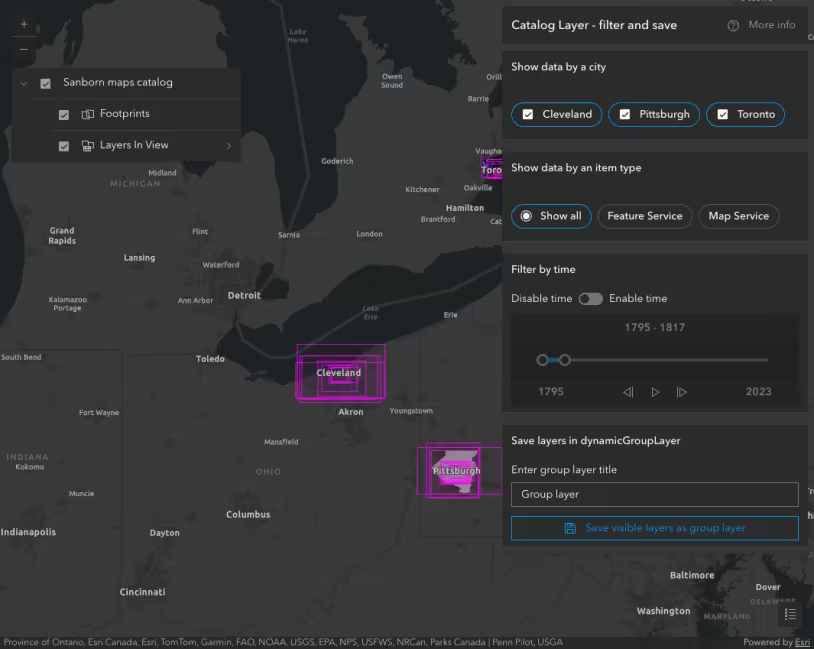
Explore data in CatalogLayer
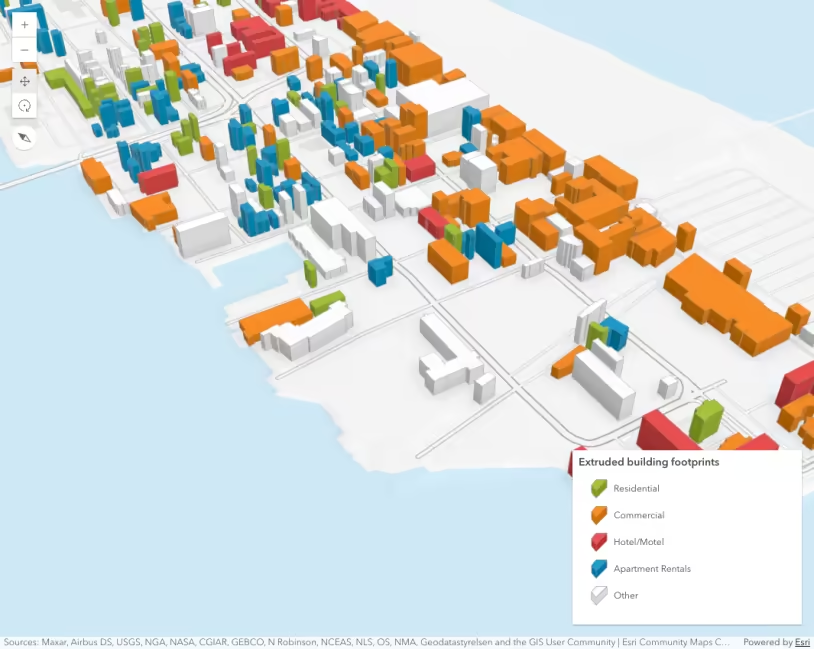
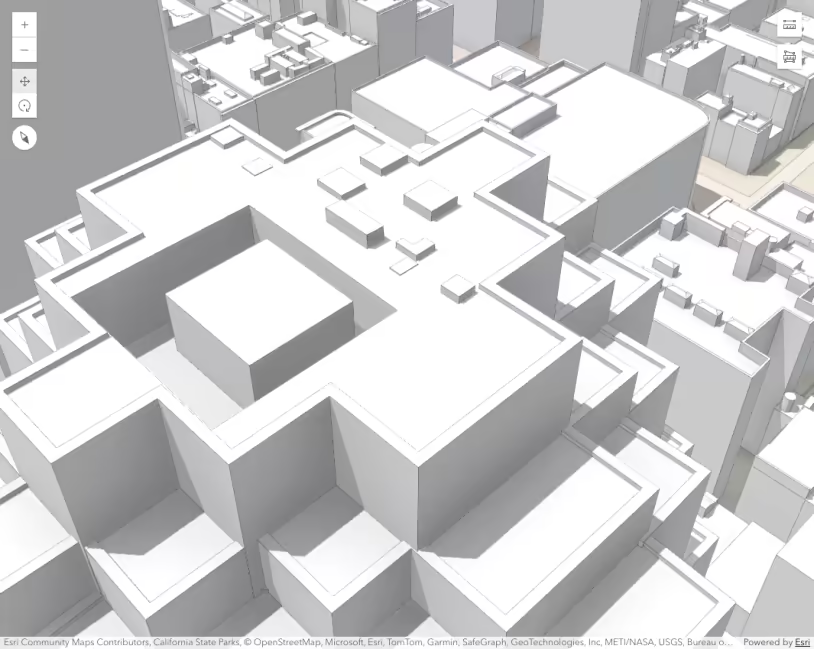
Extrude building footprints based on real world heights
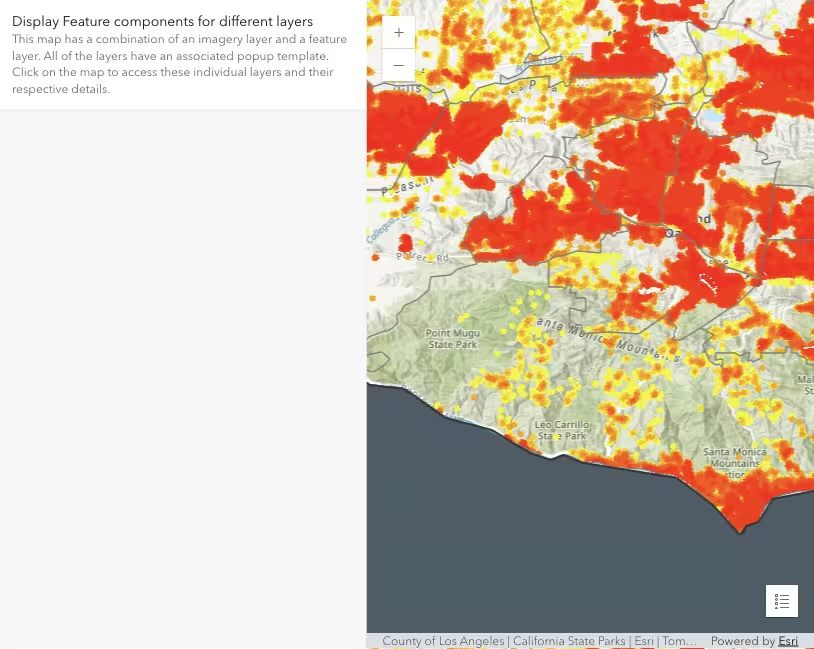
Feature component - Query graphics from multiple layers
Feature component in a side panel
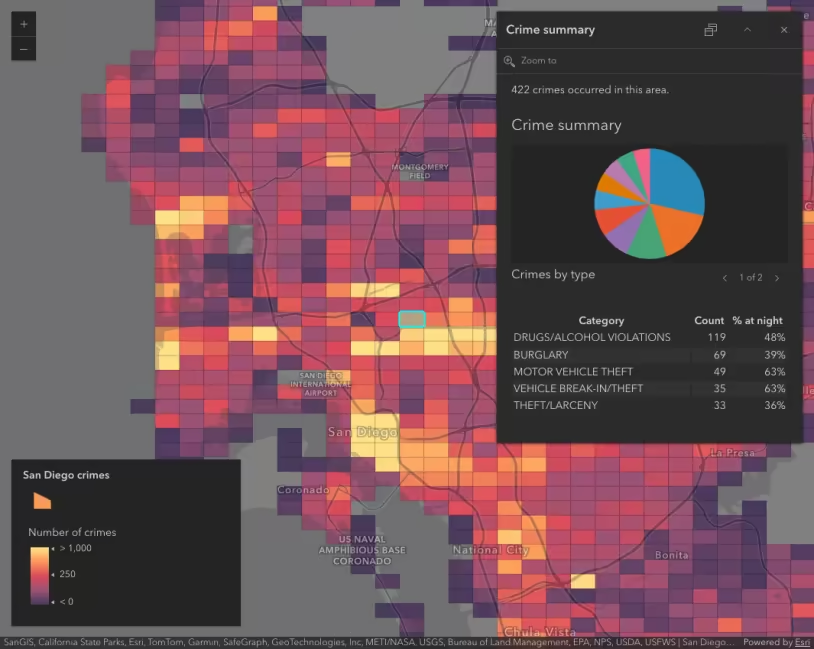
FeatureLayerView - query statistics by geometry
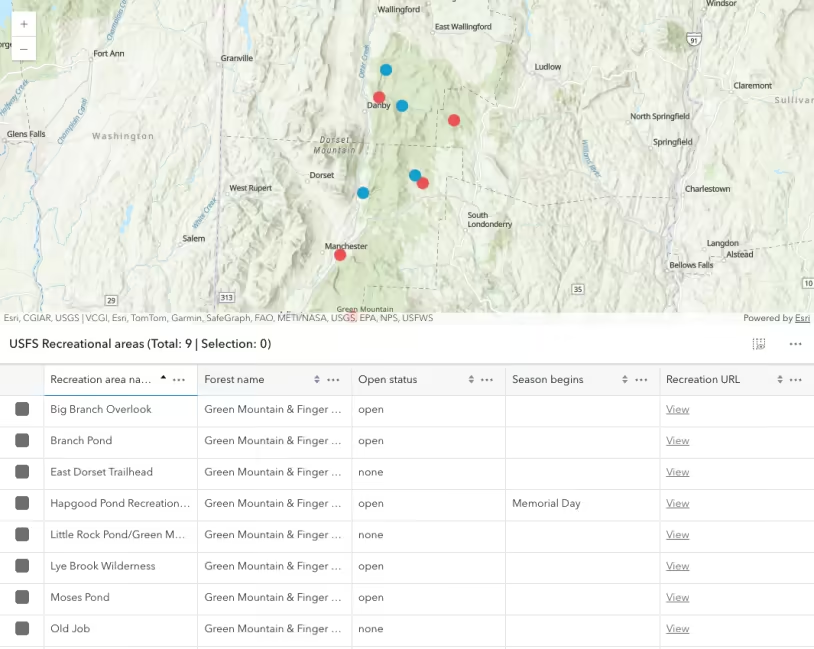
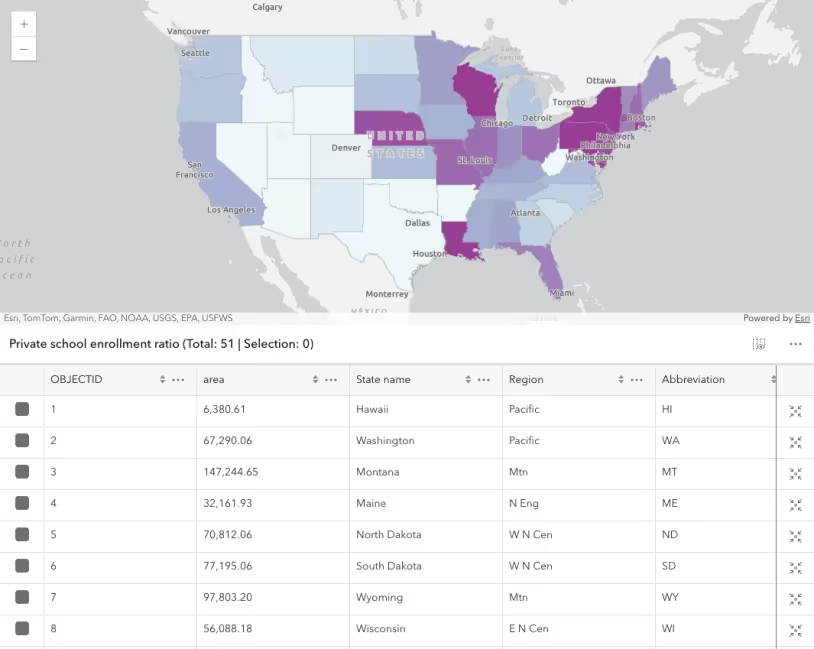
FeatureTable component
FeatureTable widget
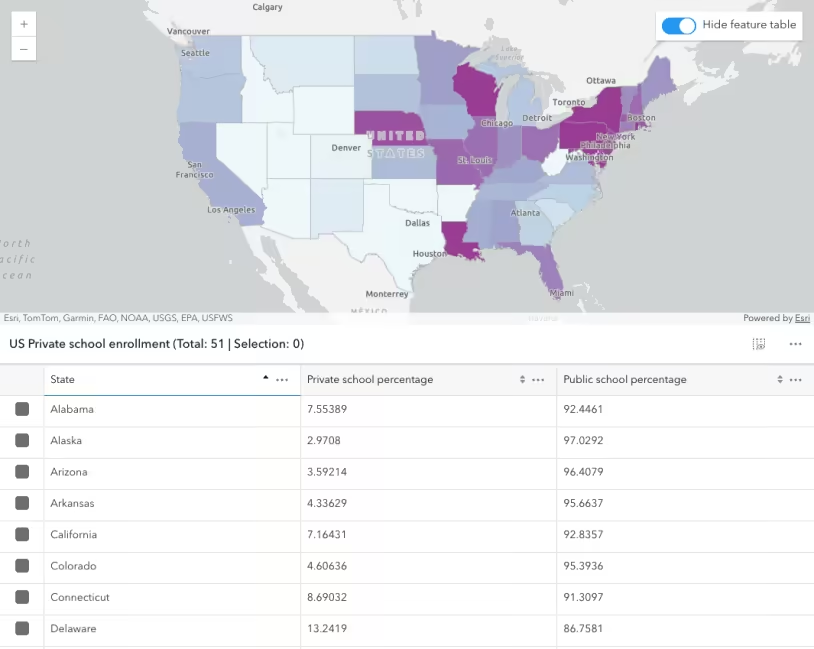
FeatureTable with a map
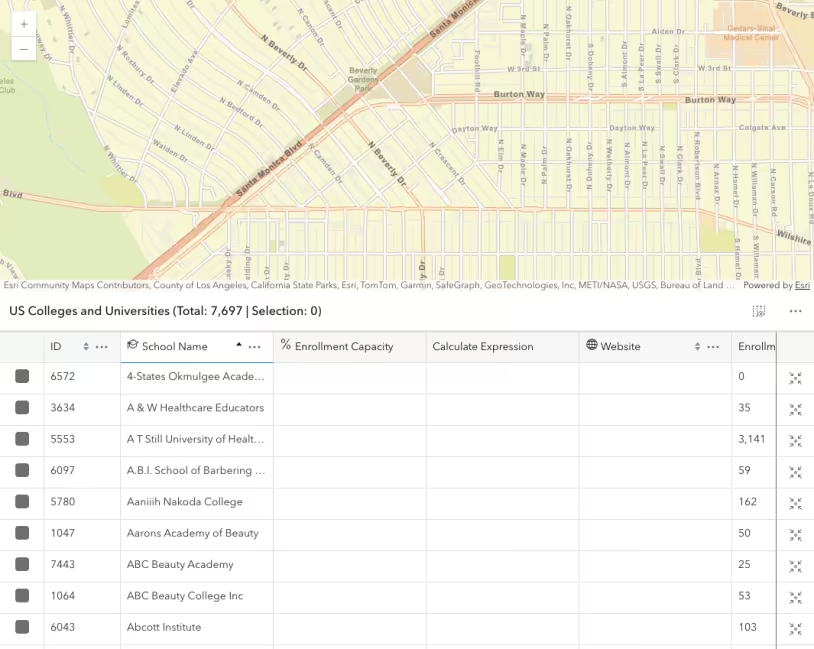
FeatureTable with custom content
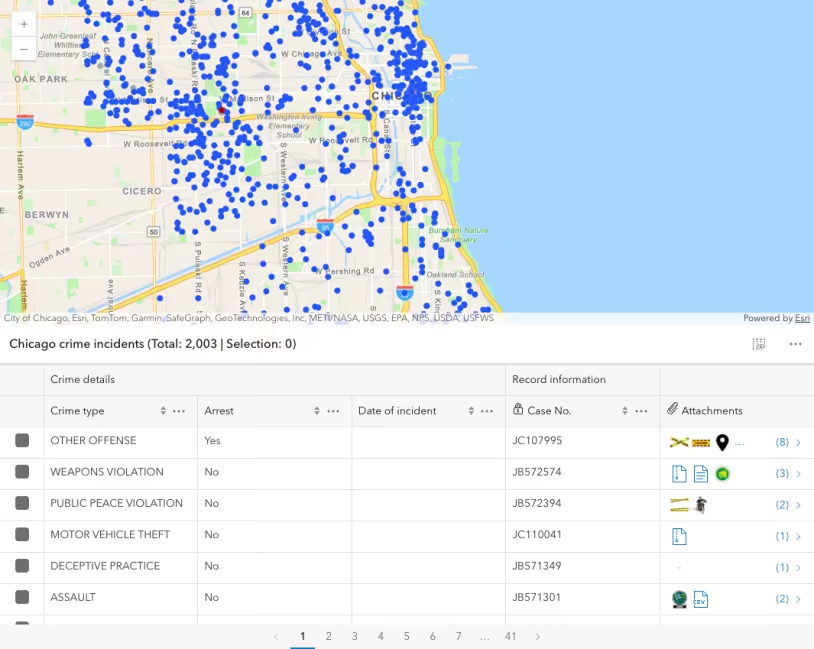
FeatureTable with editing and attachments enabled
FeatureTable with popup interaction
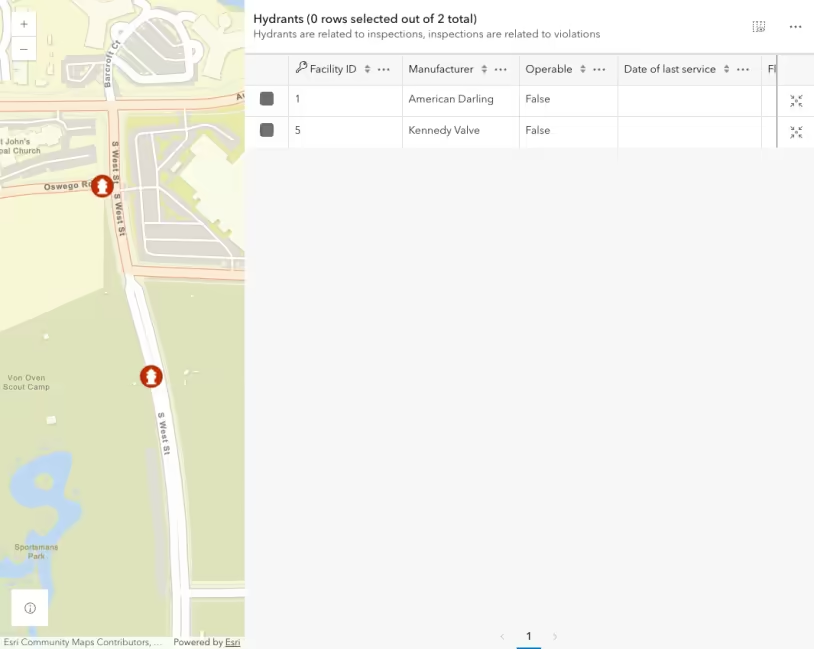
FeatureTable with related records
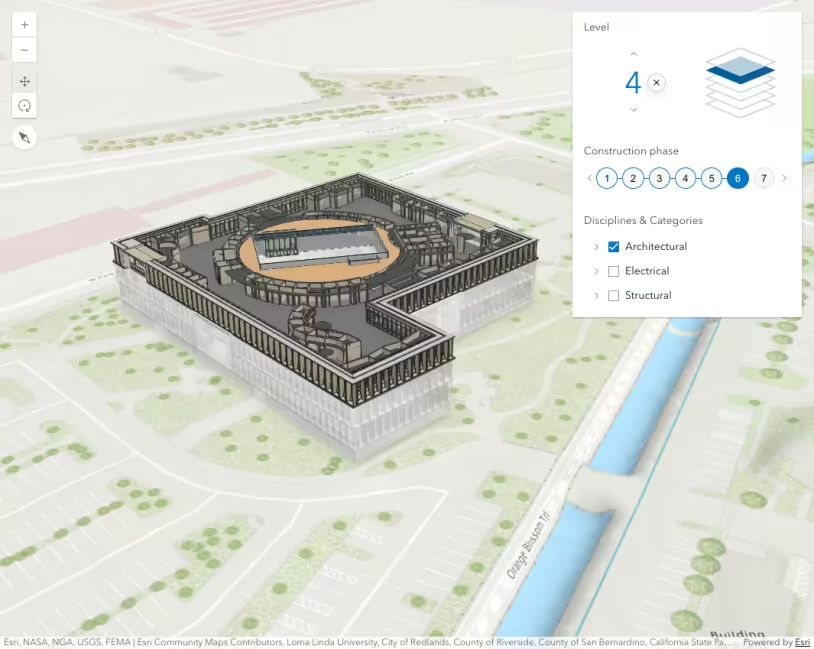
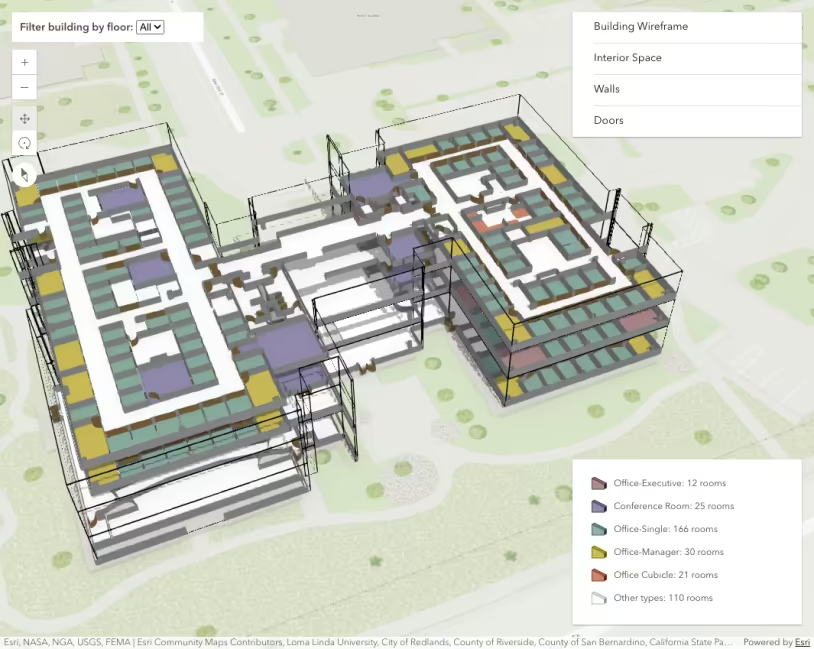
Filter BuildingSceneLayer with Building Explorer
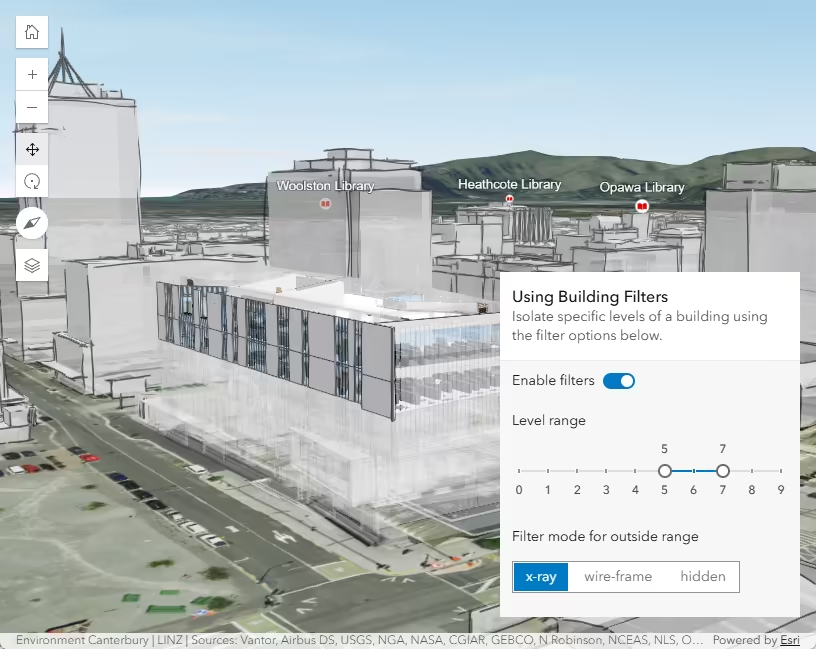
Filter BuildingSceneLayer with BuildingFilter
Filter features by attribute
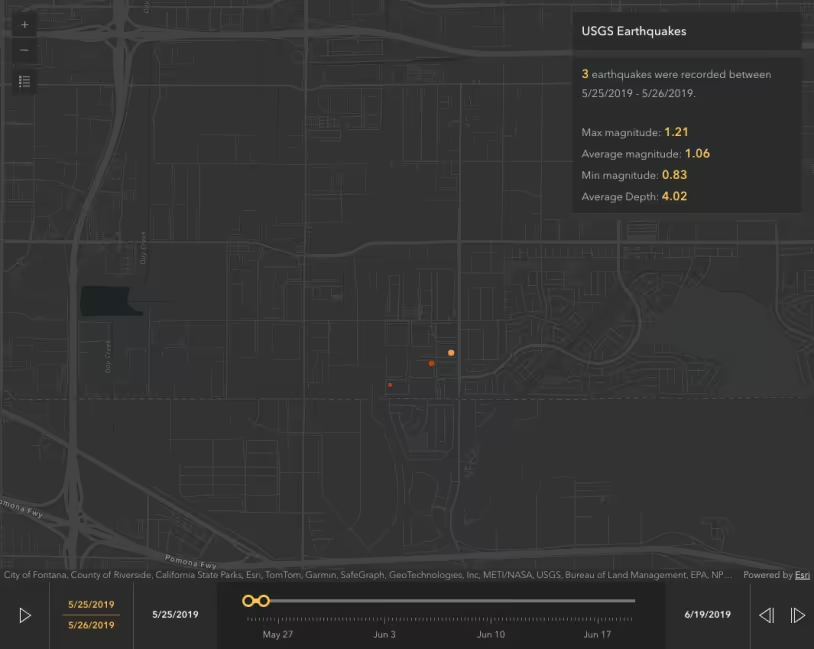
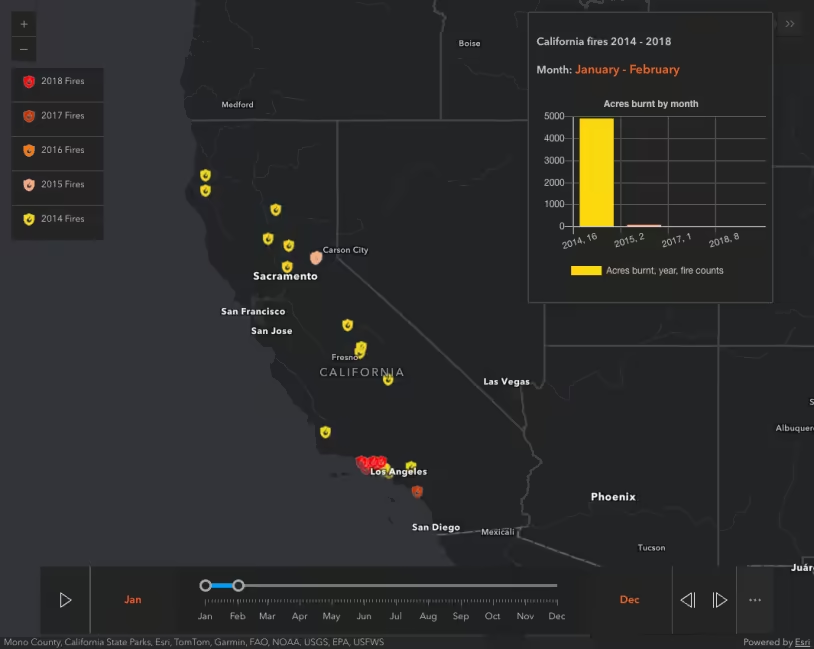
Filter features with TimeSlider component
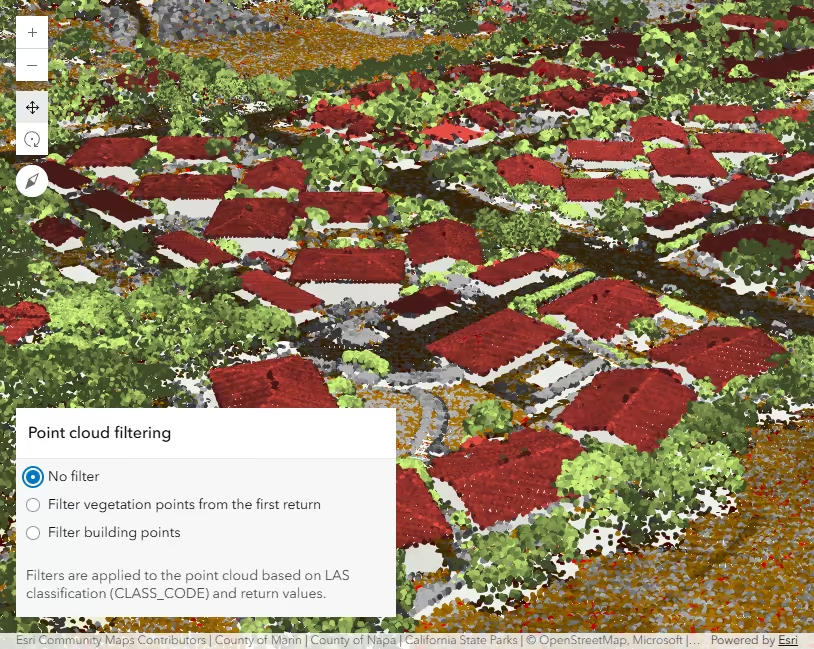
Filter points in a PointCloudLayer
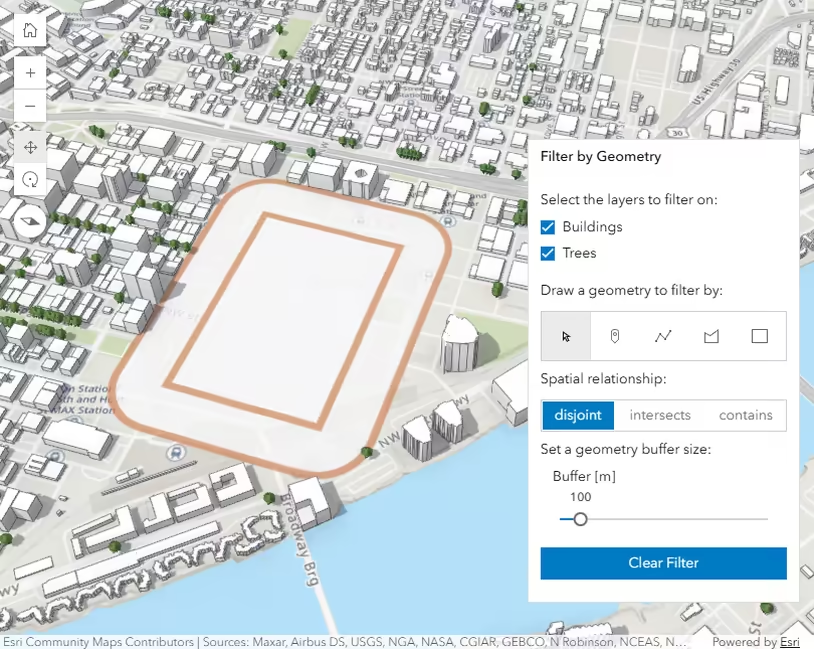
Filter SceneLayer with FeatureFilter
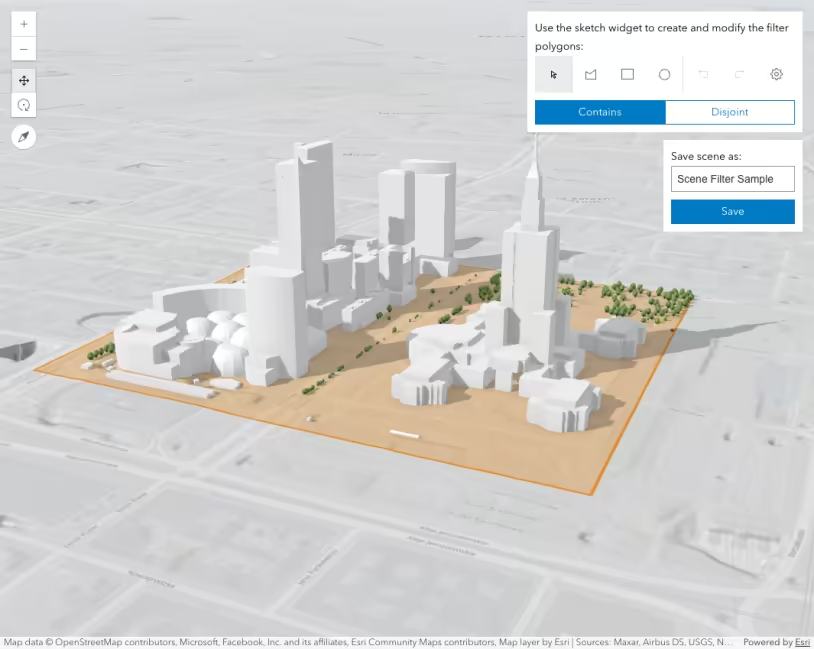
Filter SceneLayer with SceneFilter
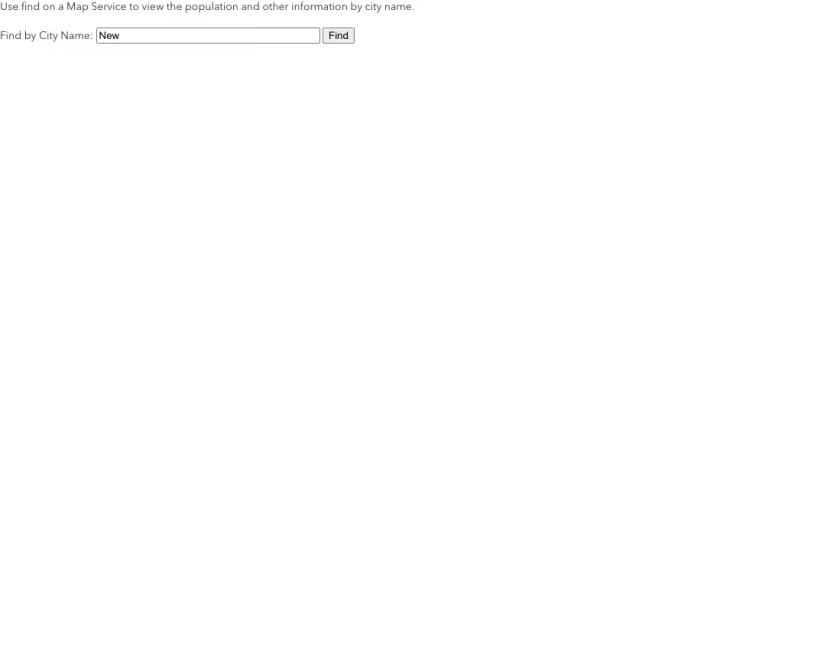
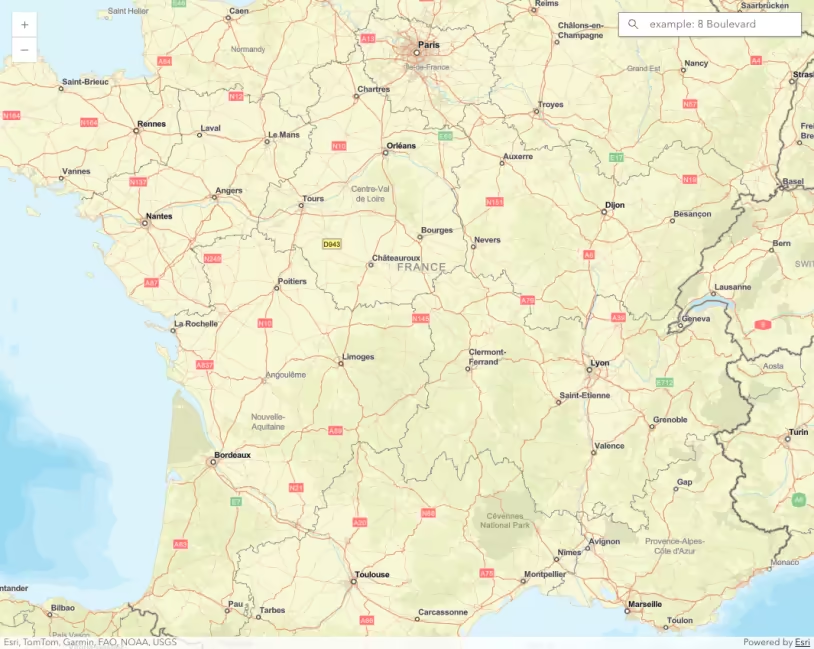
Find
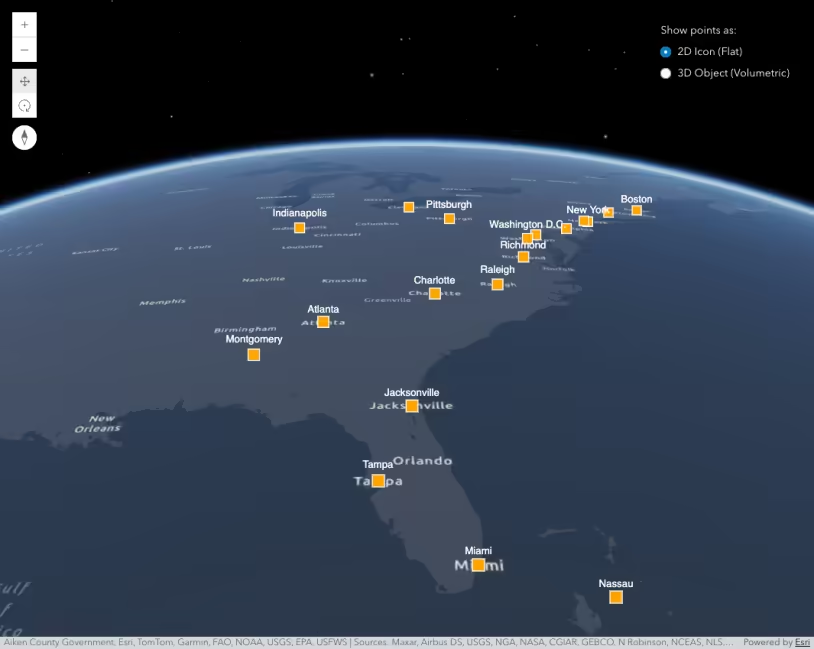
Flat vs. volumetric 3D symbol layers
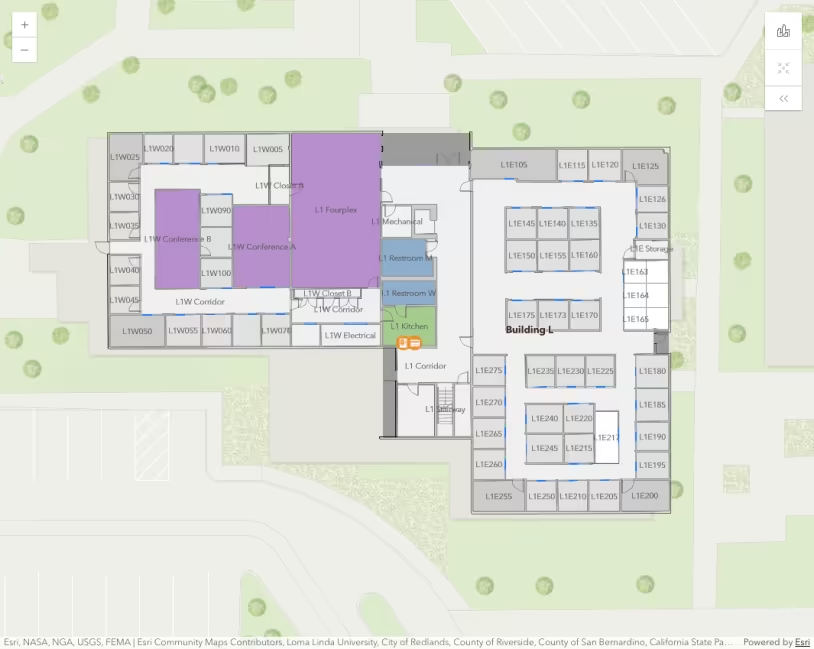
FloorFilter component
FlowRenderer in a 3D scene
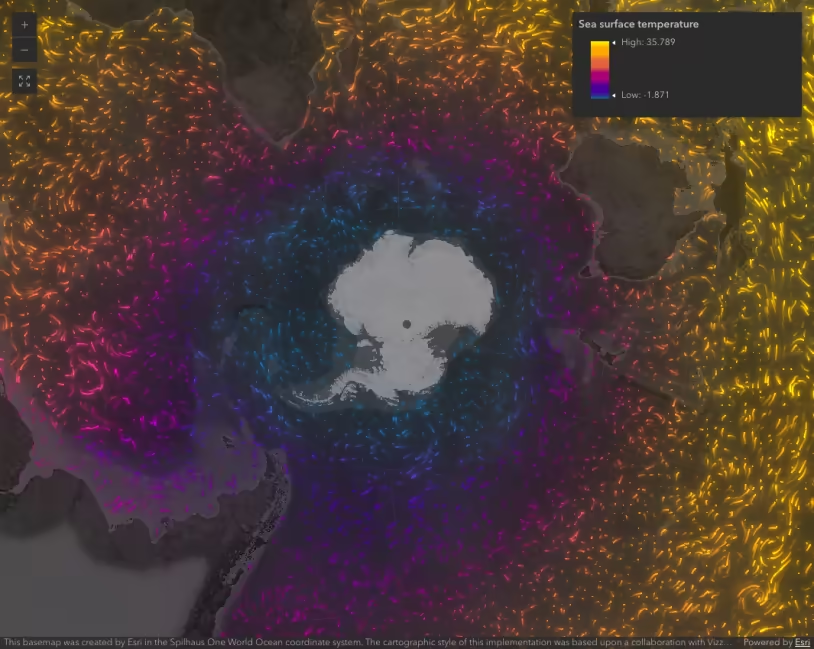
FlowRenderer with effects and blending
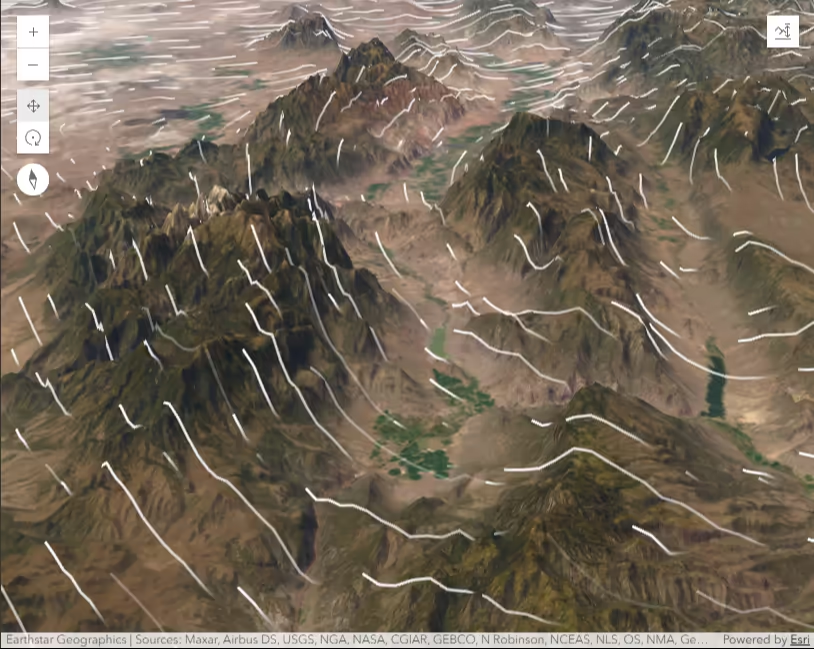
FlowRenderer with elevation modes
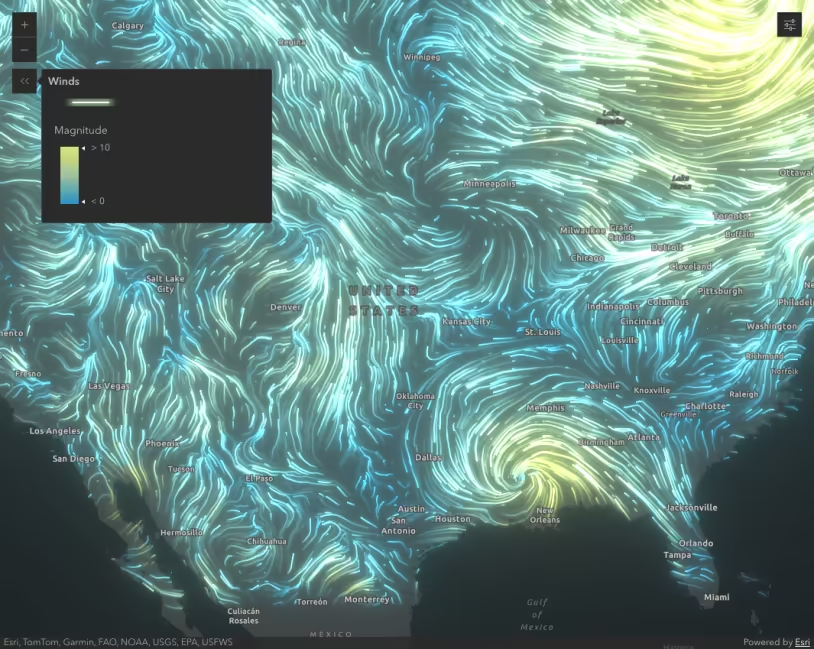
FlowRenderer with visual variables
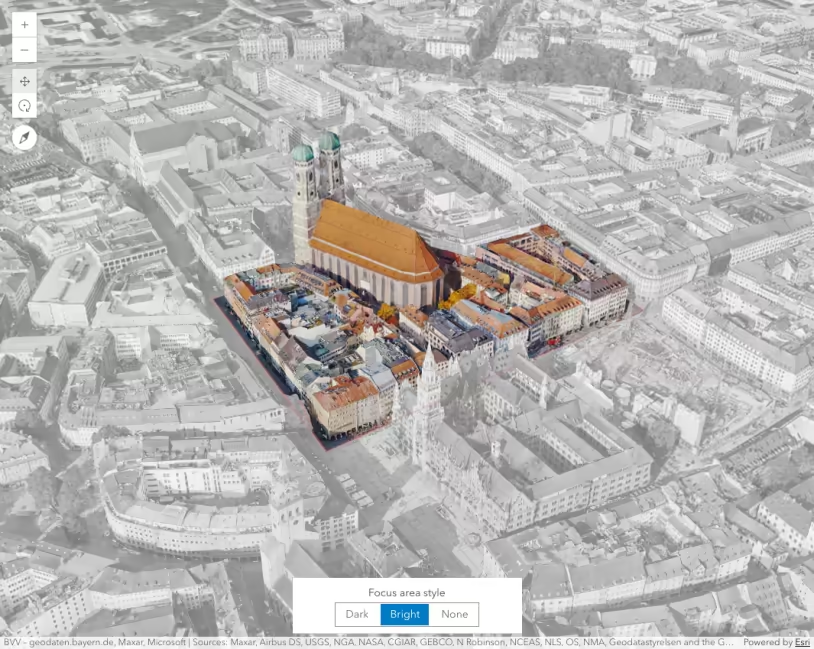
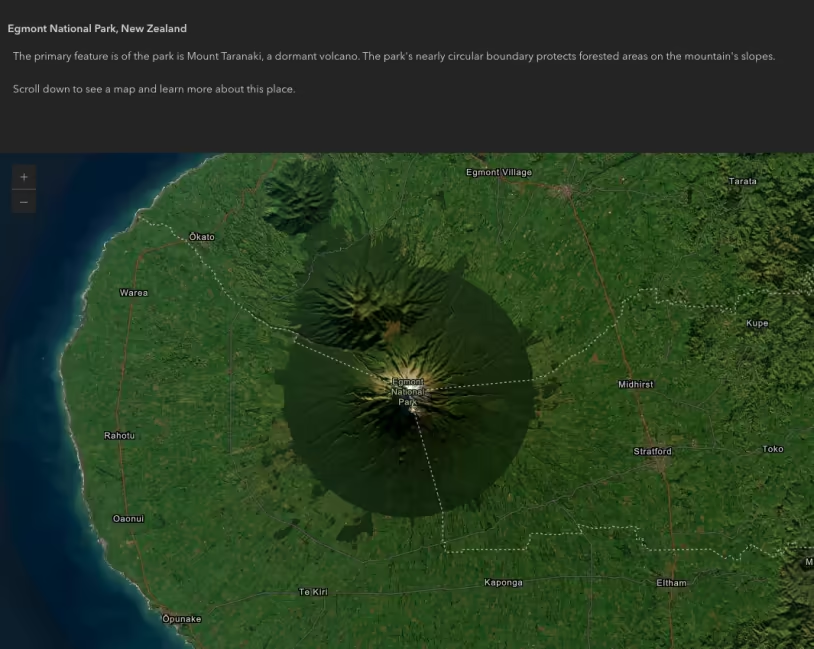
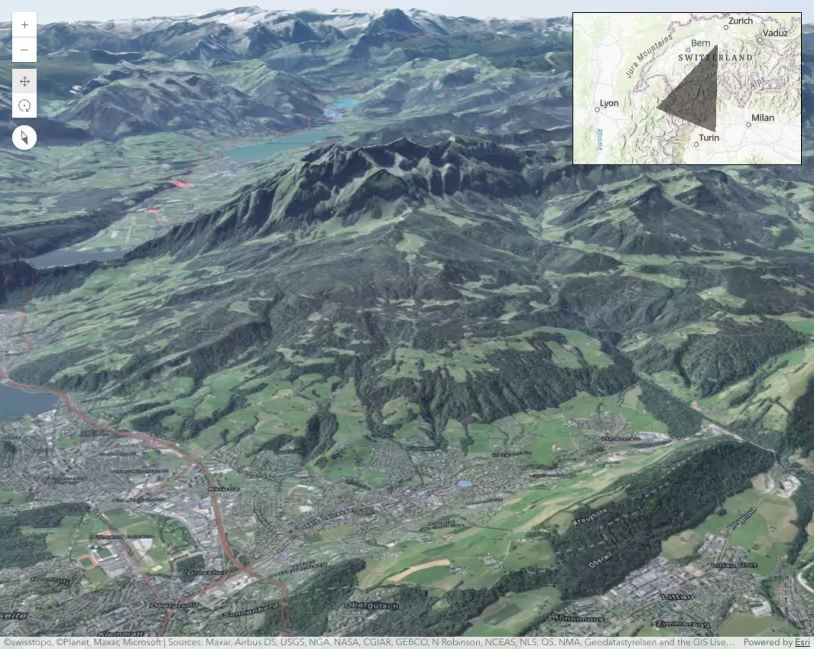
Focus Area
GaussianSplatLayer
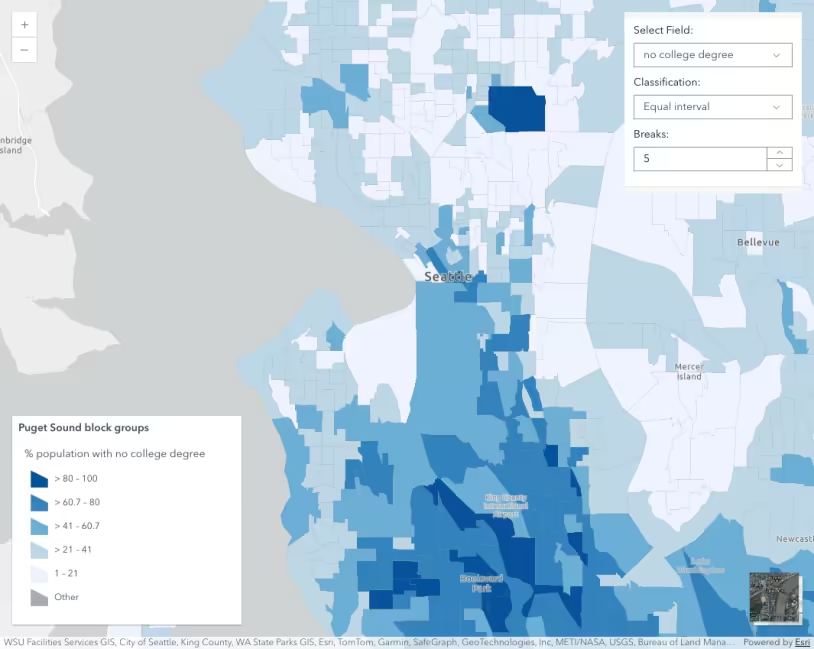
Generate a class breaks visualization
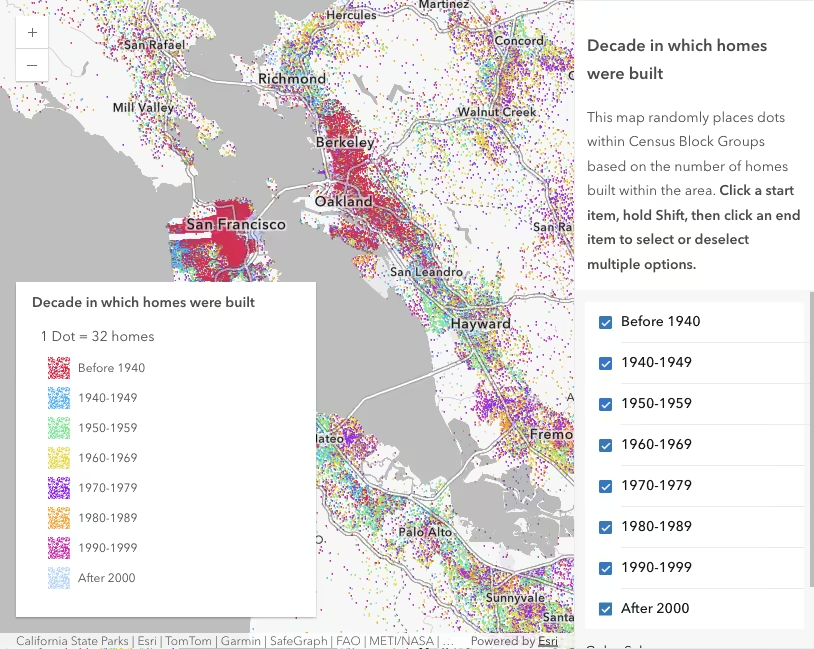
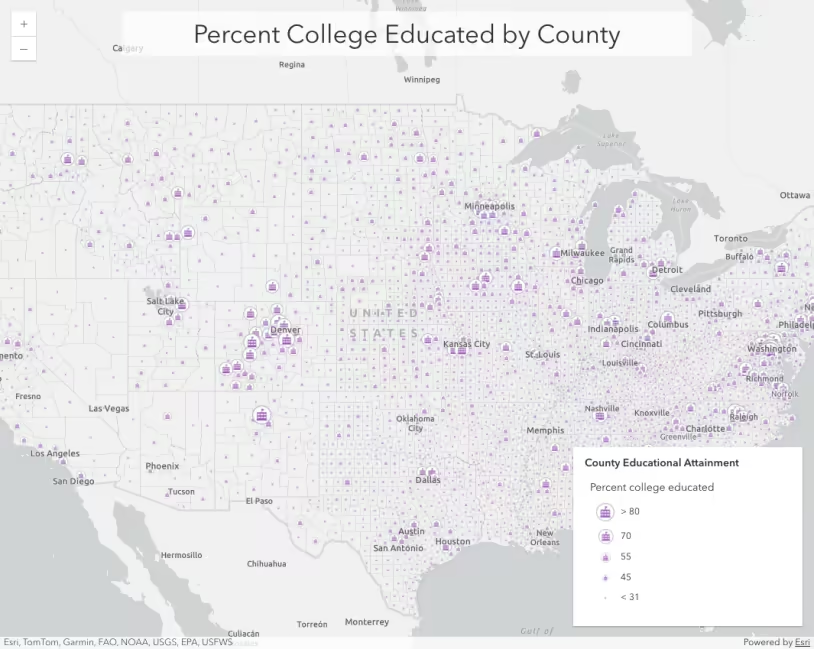
Generate a dot density visualization
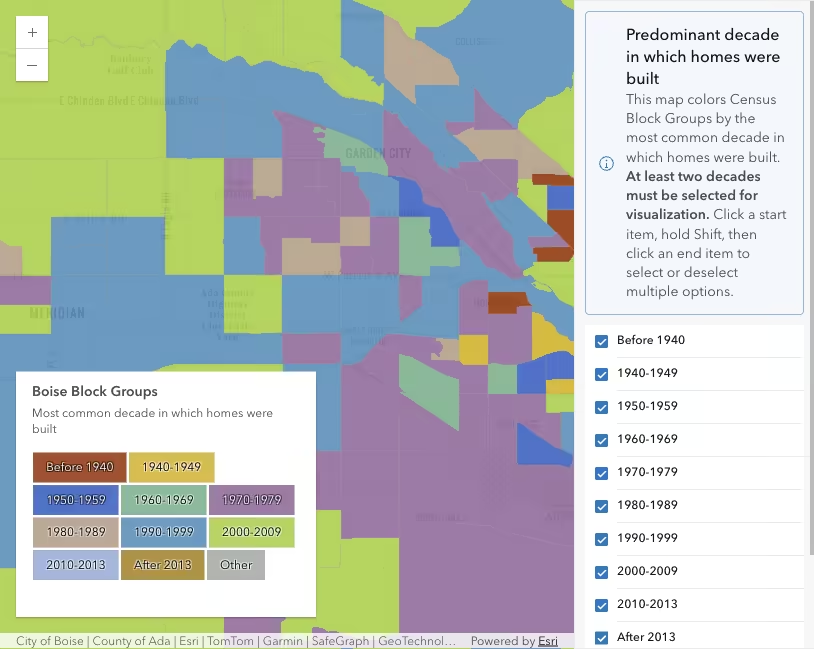
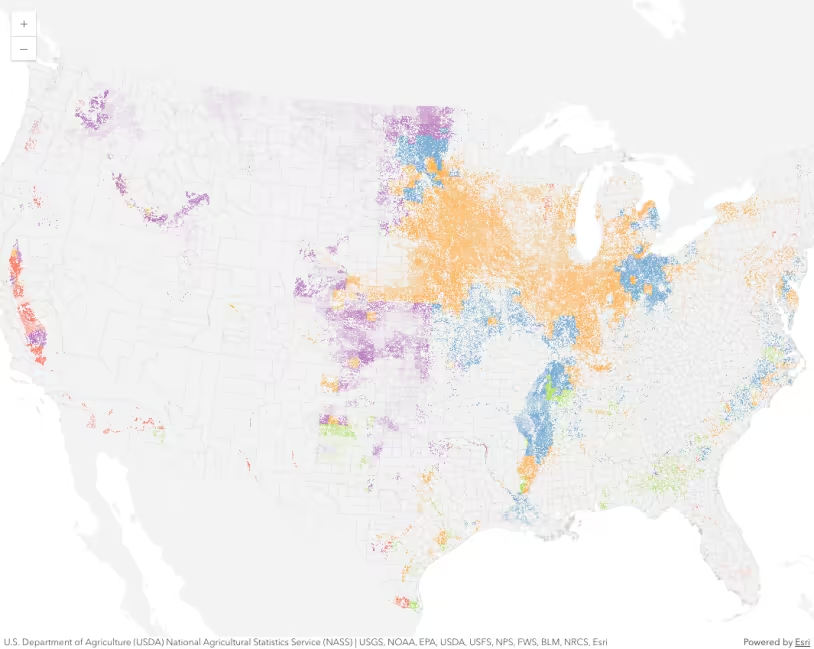
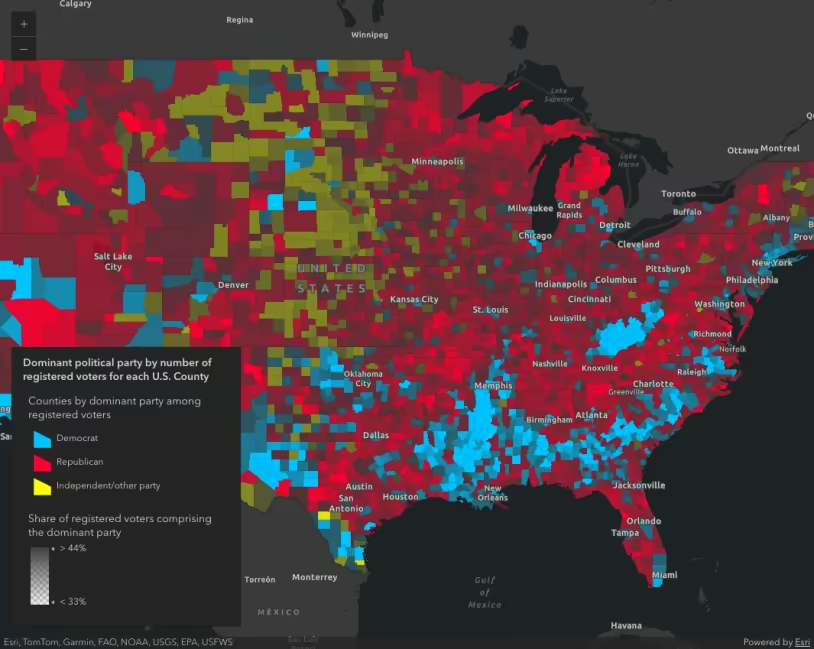
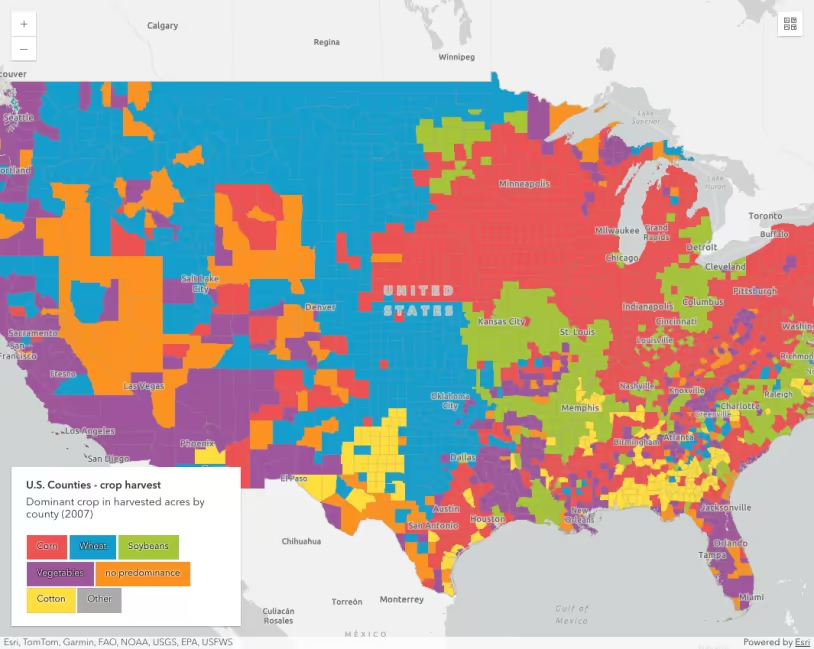
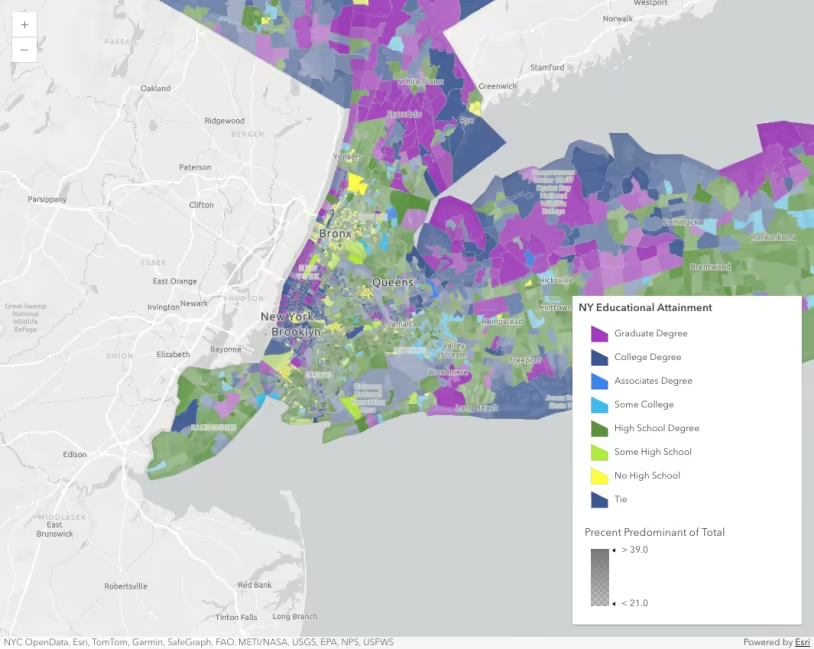
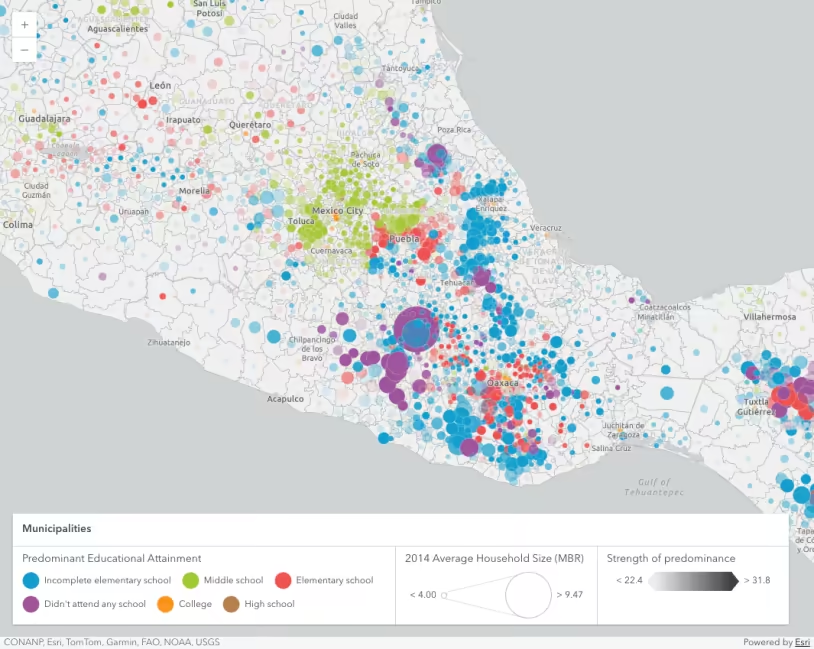
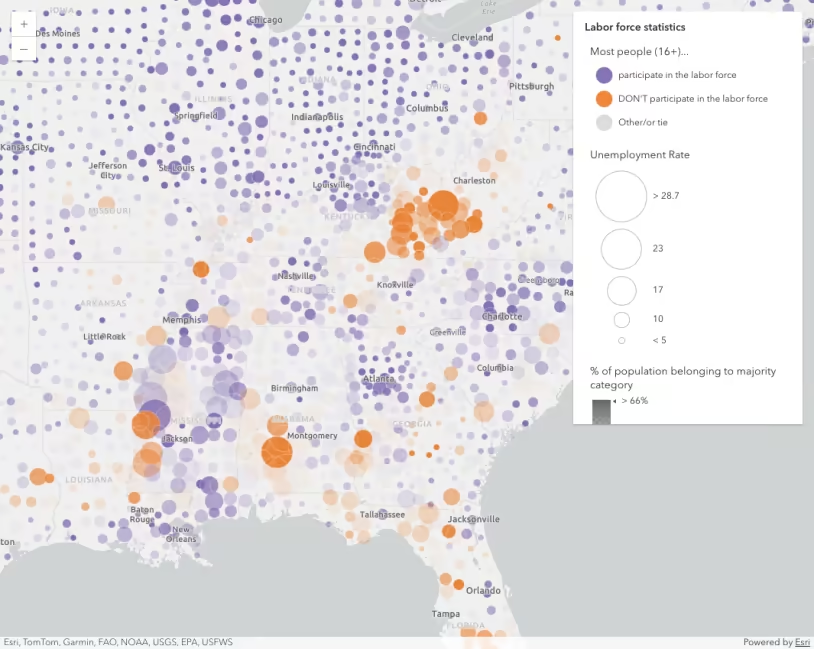
Generate a predominance visualization
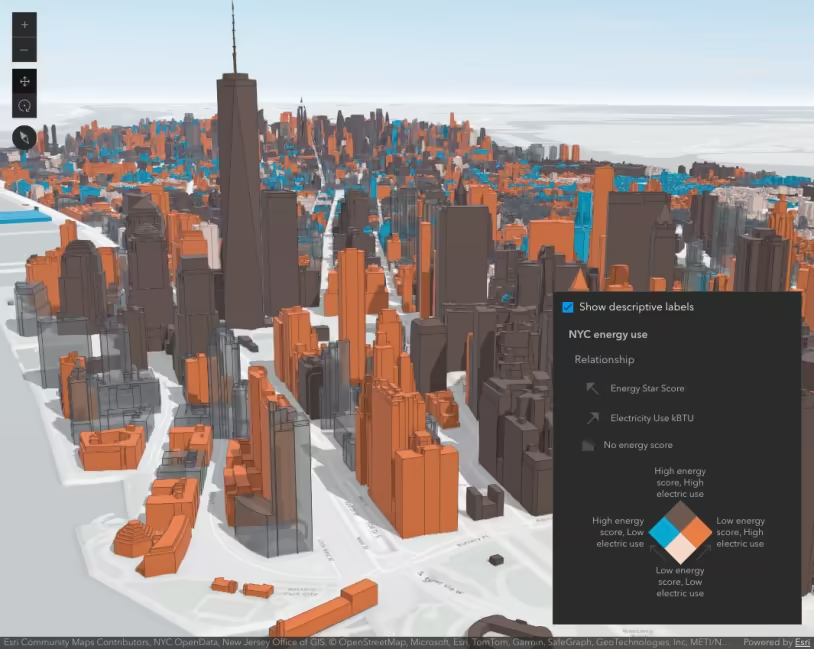
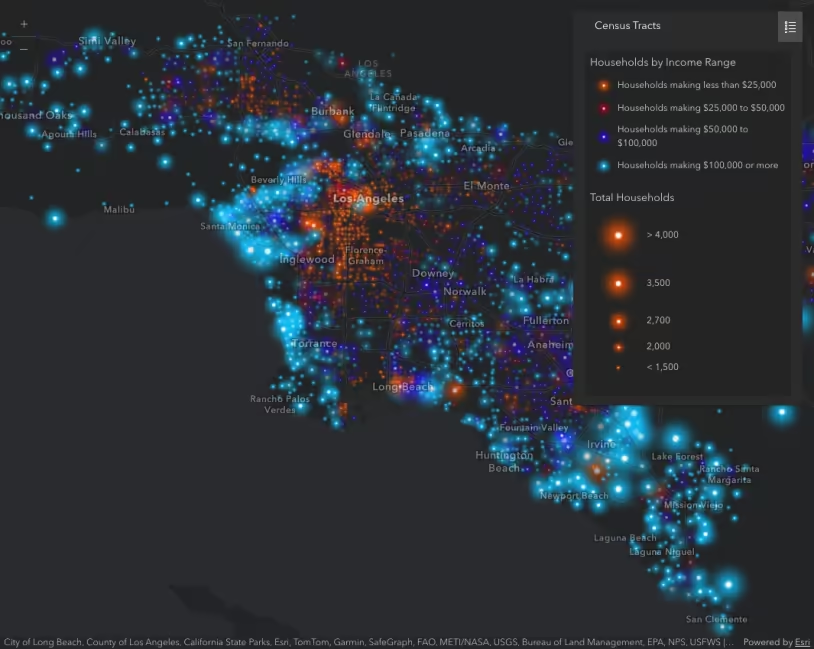
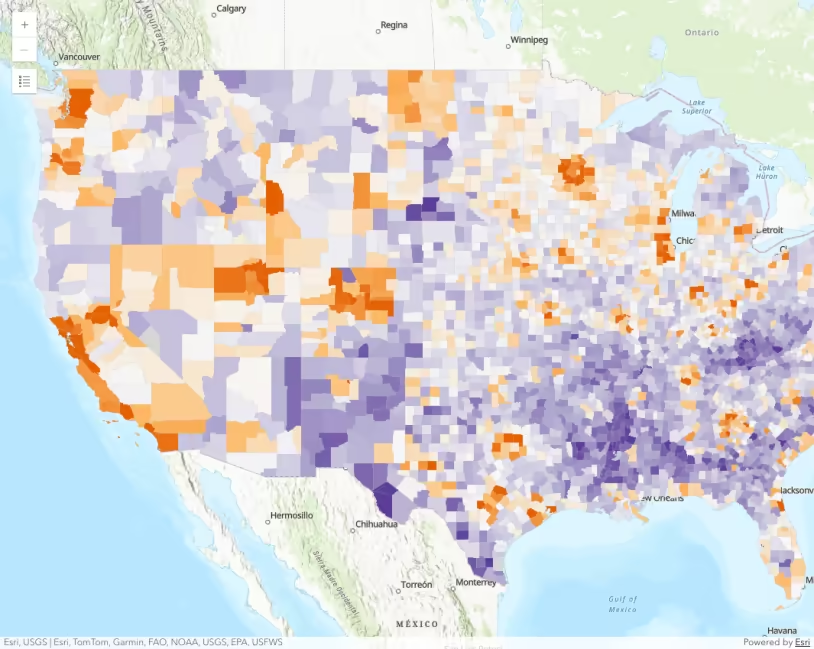
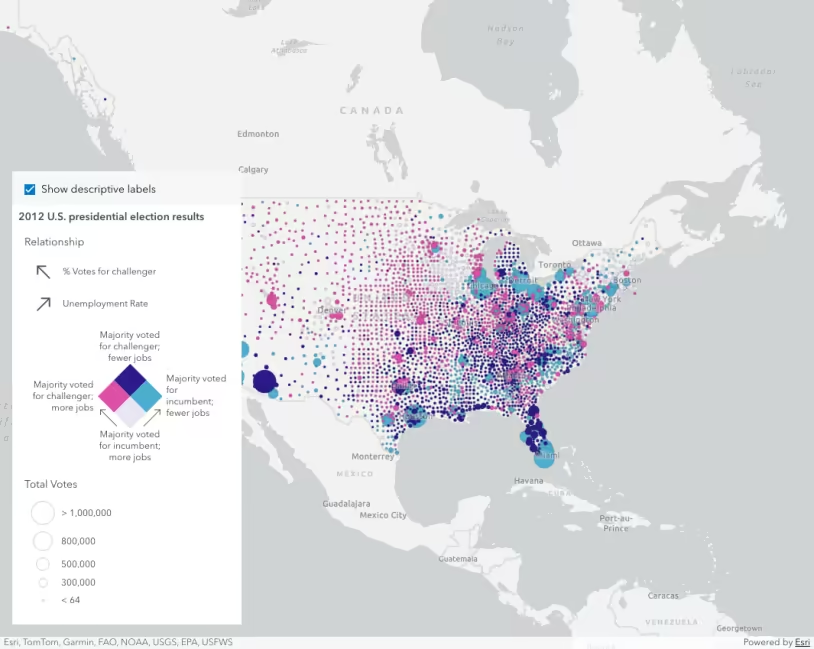
Generate a relationship visualization
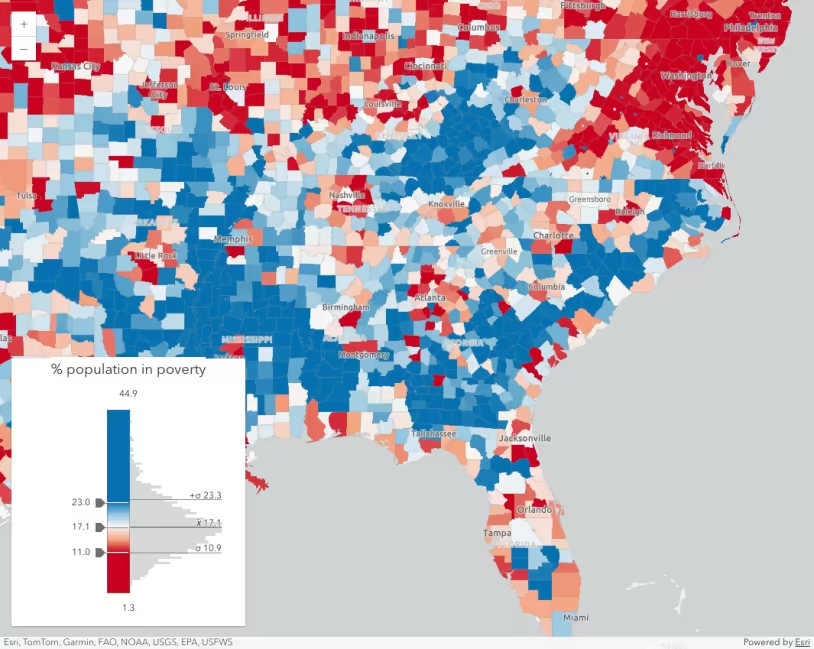
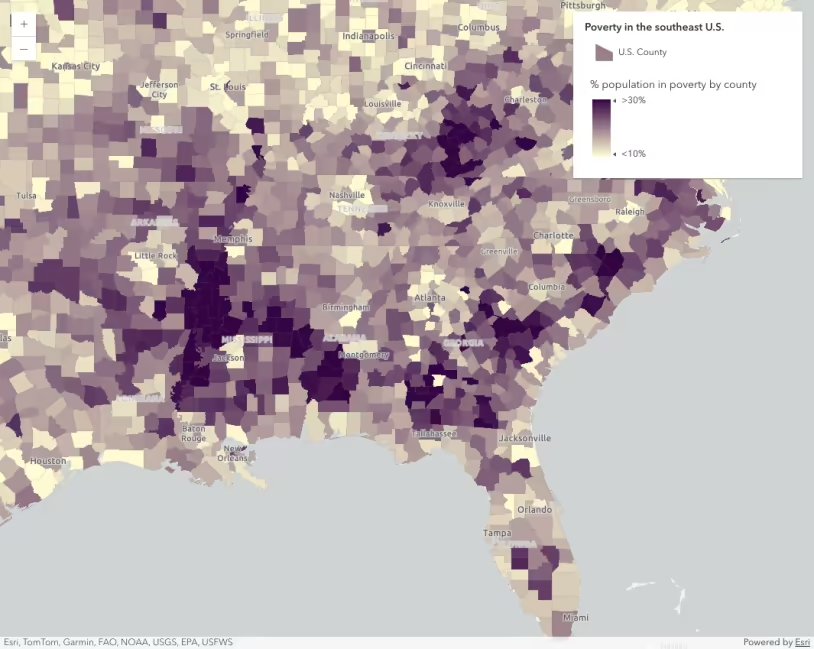
Generate continuous color visualization
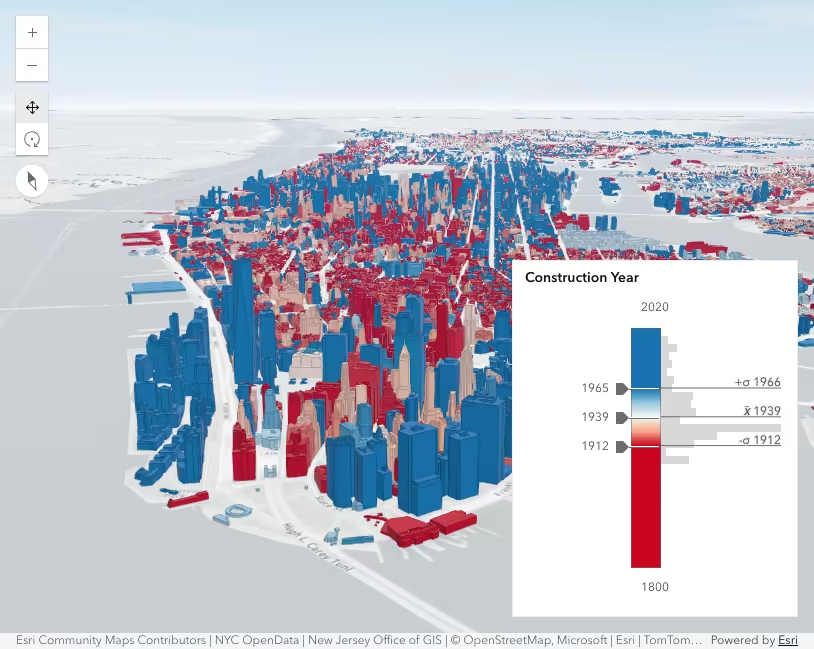
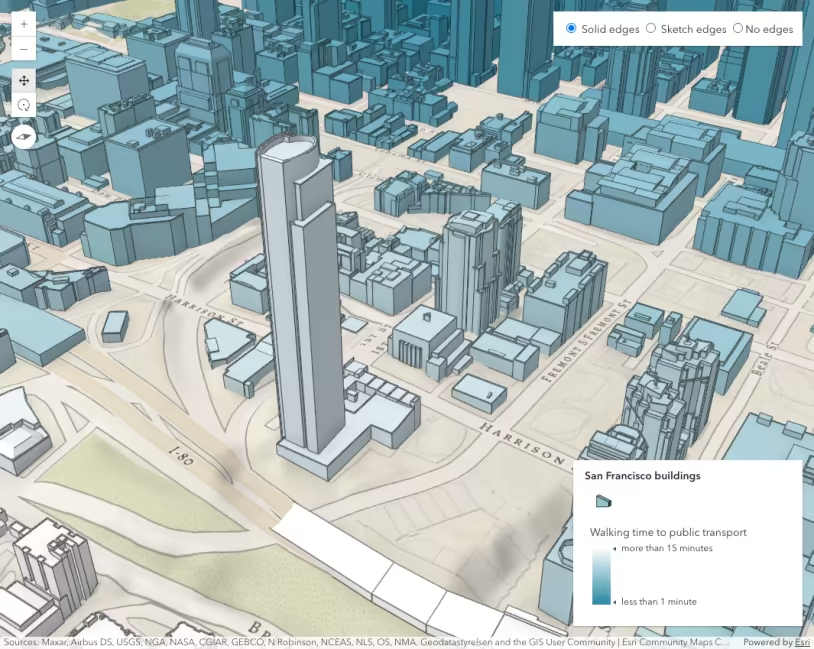
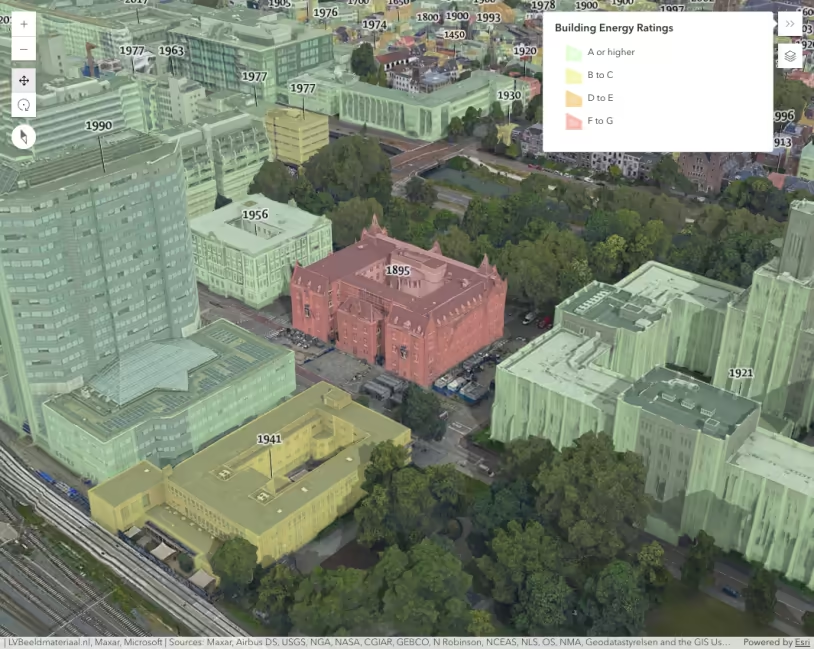
Generate continuous color visualization for 3D buildings
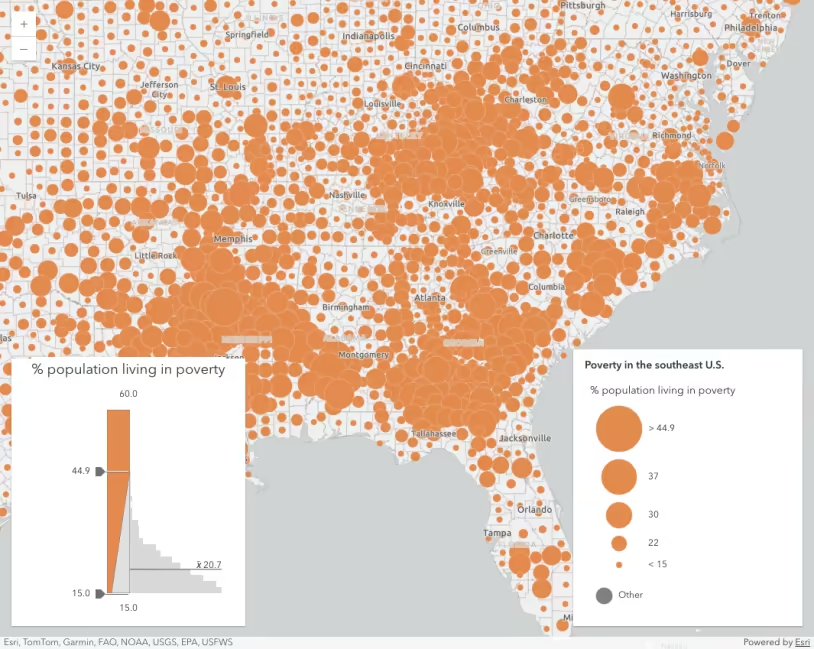
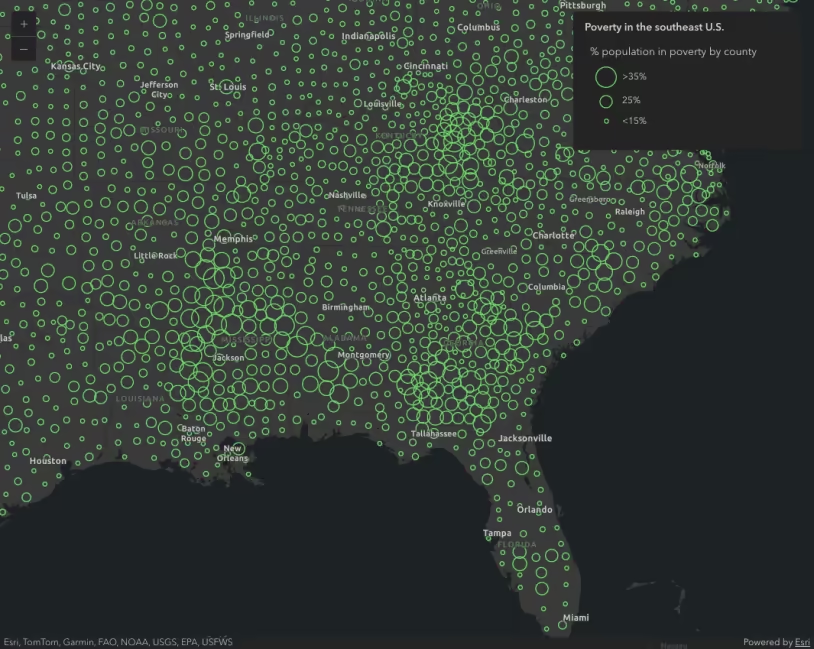
Generate data-driven continuous size visualization
Generate data-driven visualization of unique values
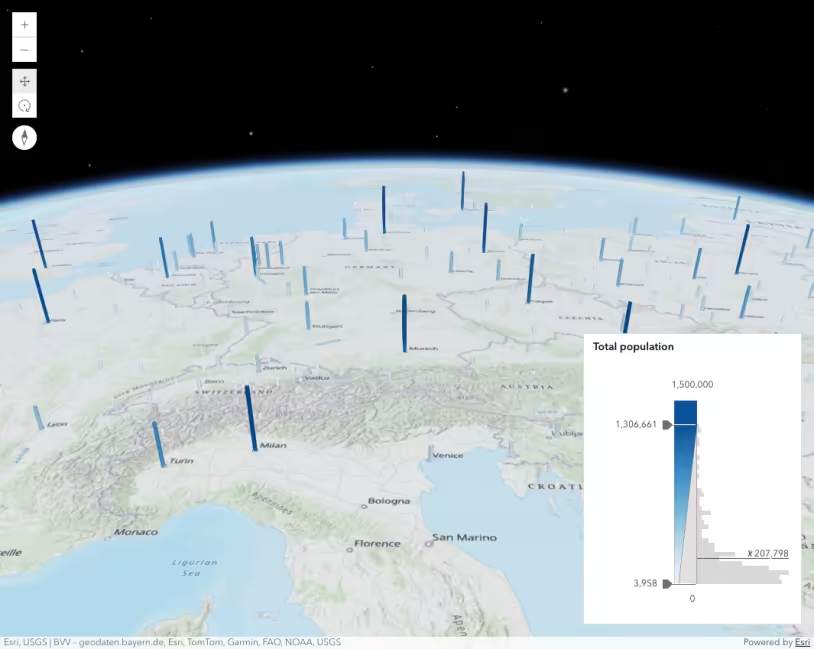
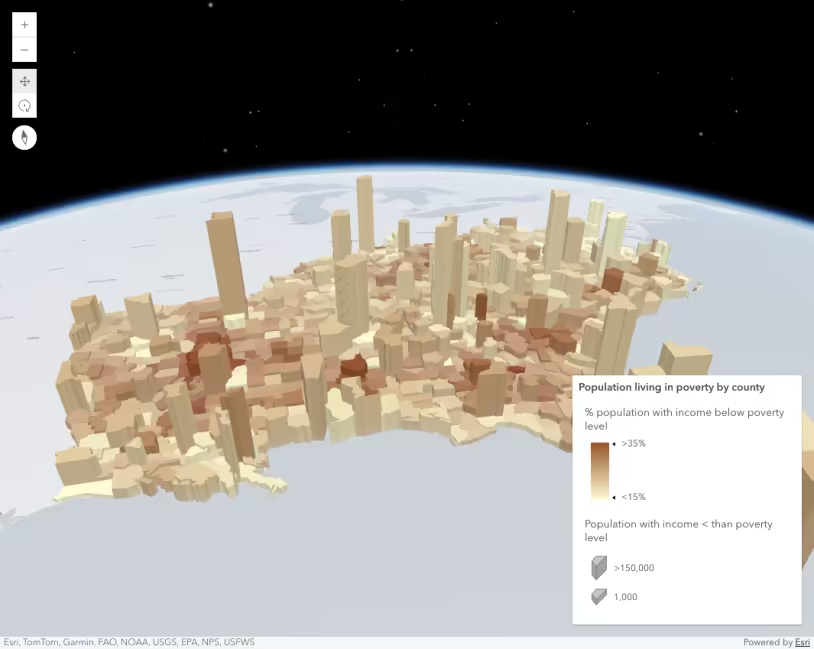
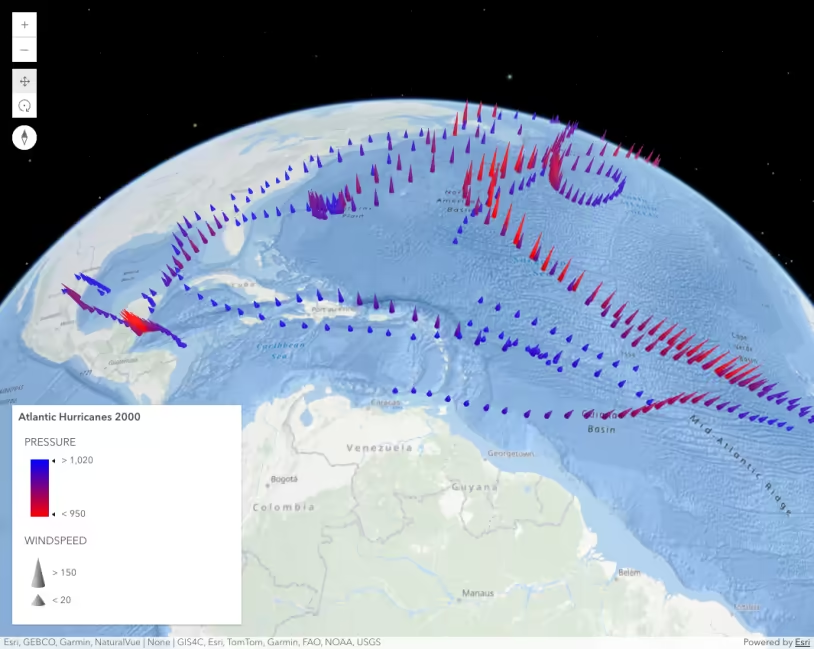
Generate univariate continuous size and color visualization in 3D
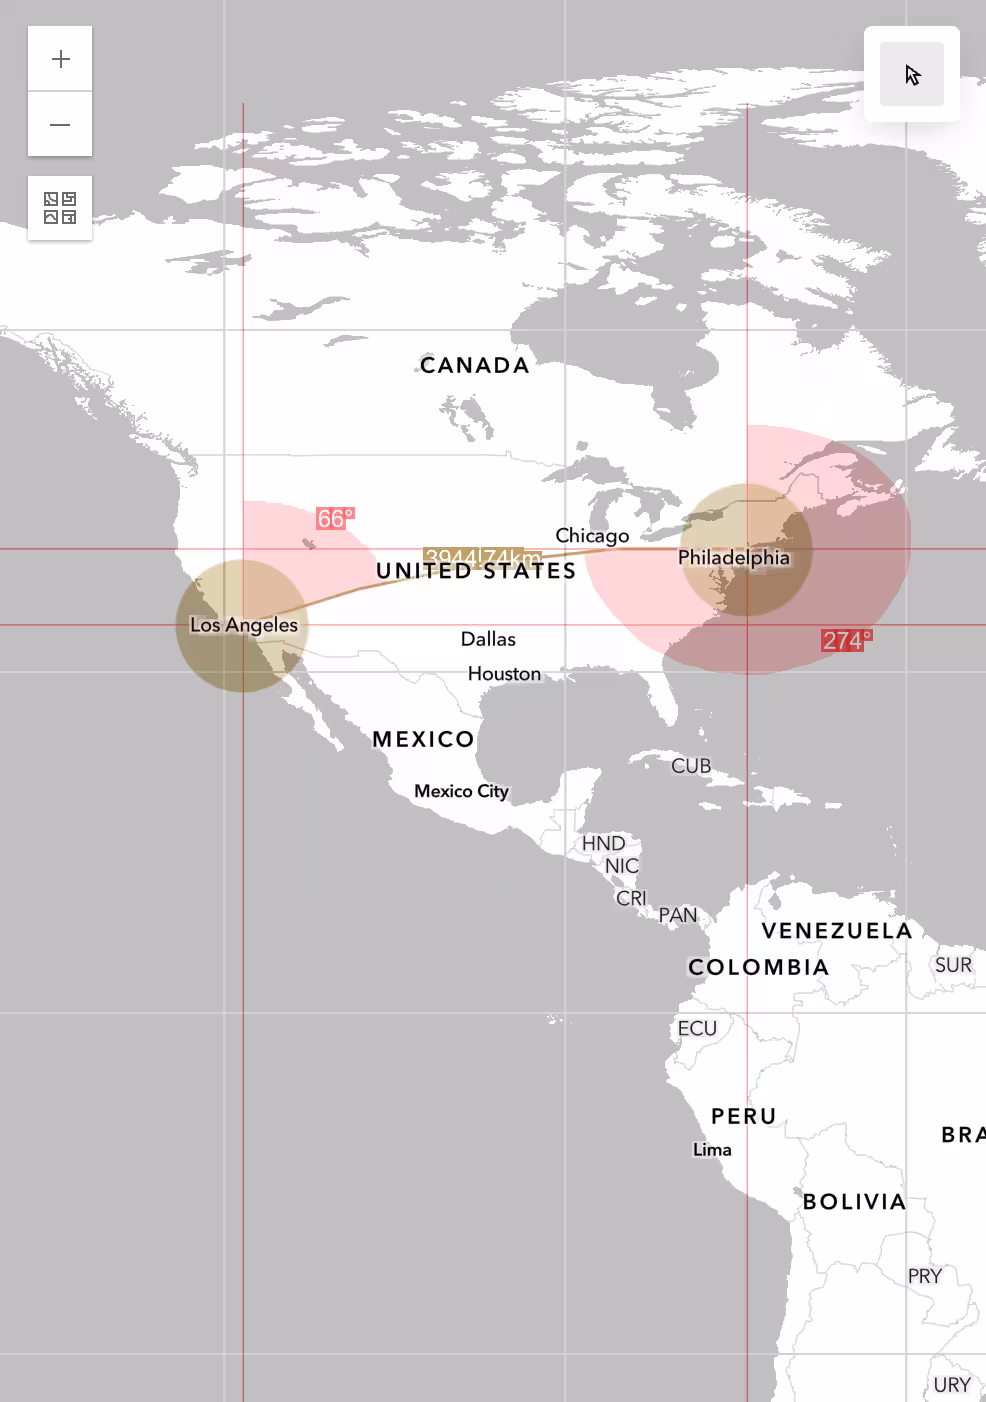
Geodetic distance and azimuth visualizer
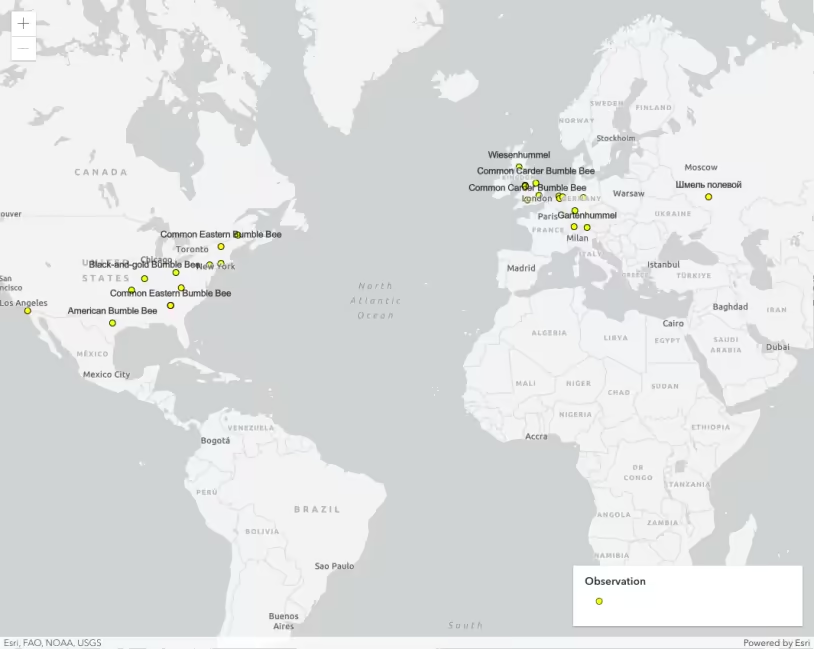
GeoJSONLayer
GeoJSONLayer with dynamic URL
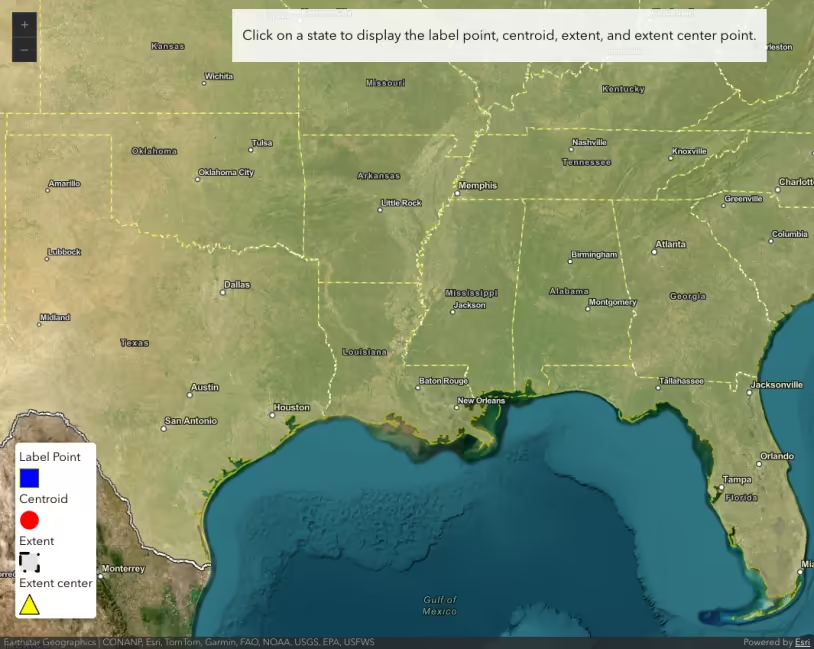
Geometry operator - centroid analysis
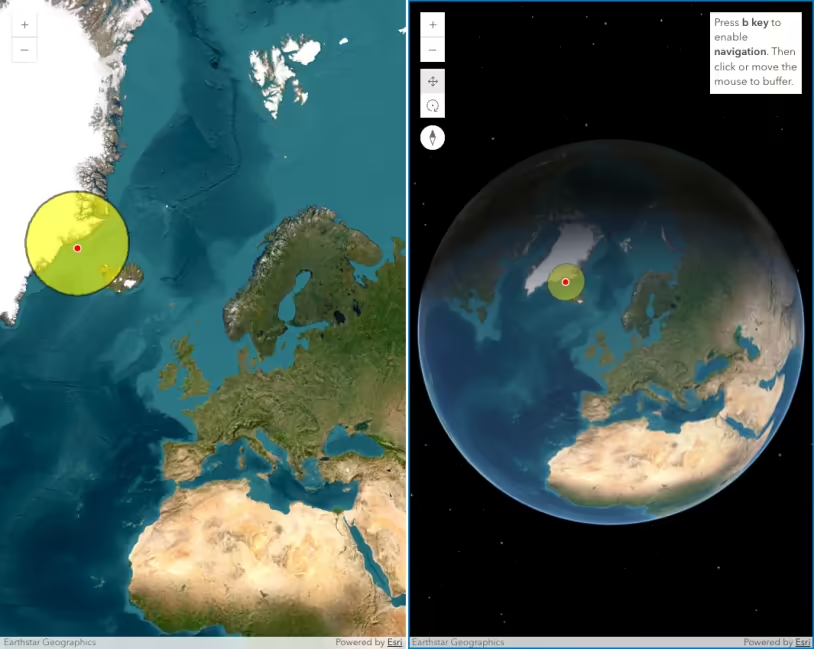
Geometry operator - geodesic buffers
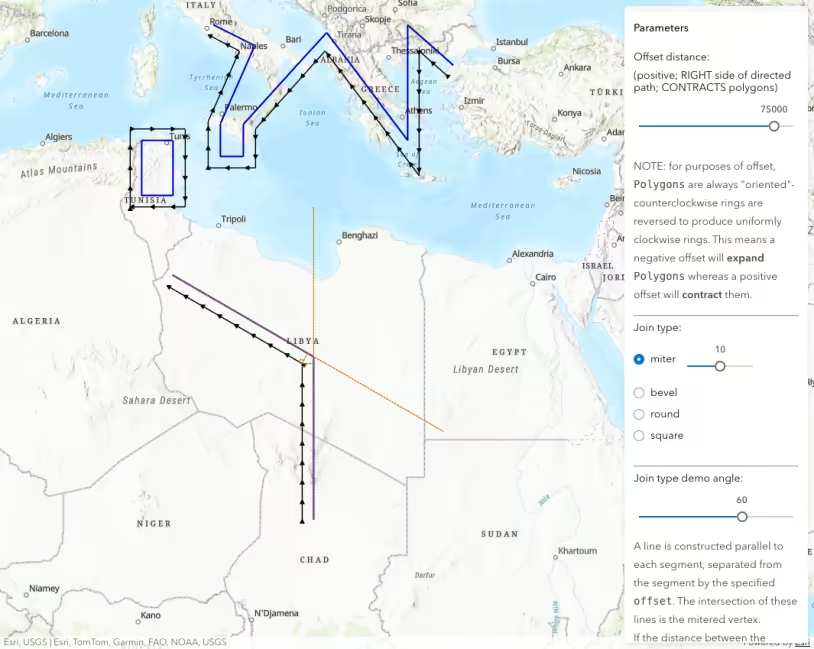
Geometry operator - offset analysis
Geometry operator - proximity analysis
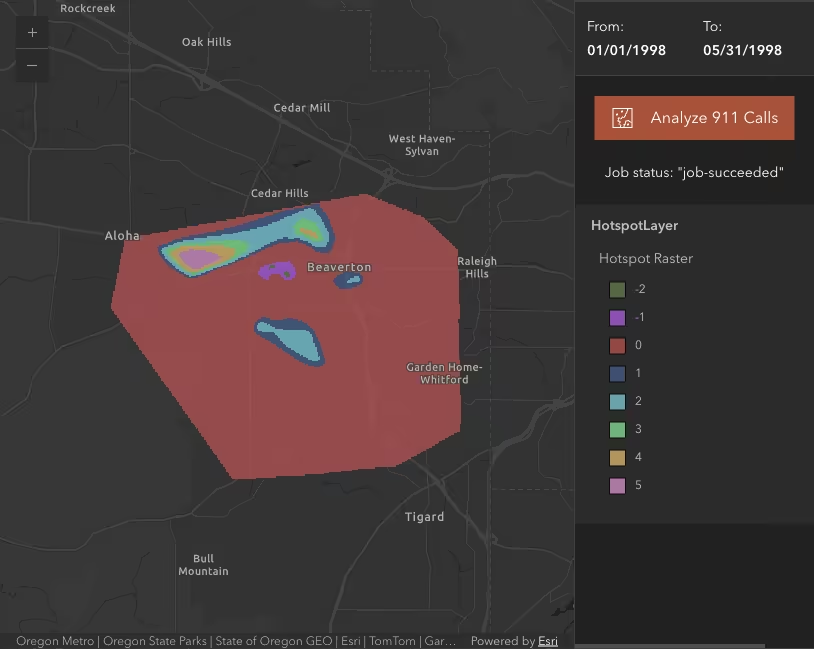
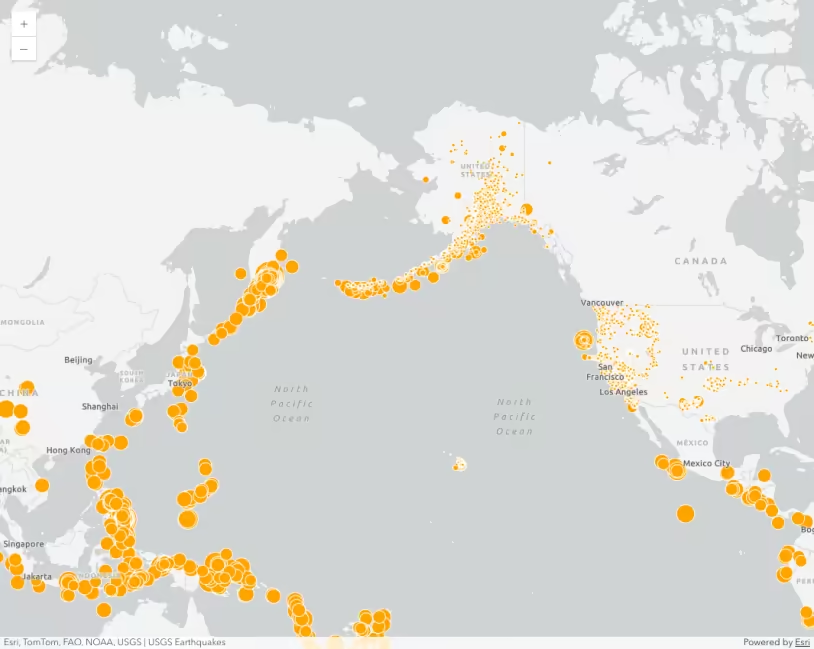
Geoprocessing - hotspot analysis
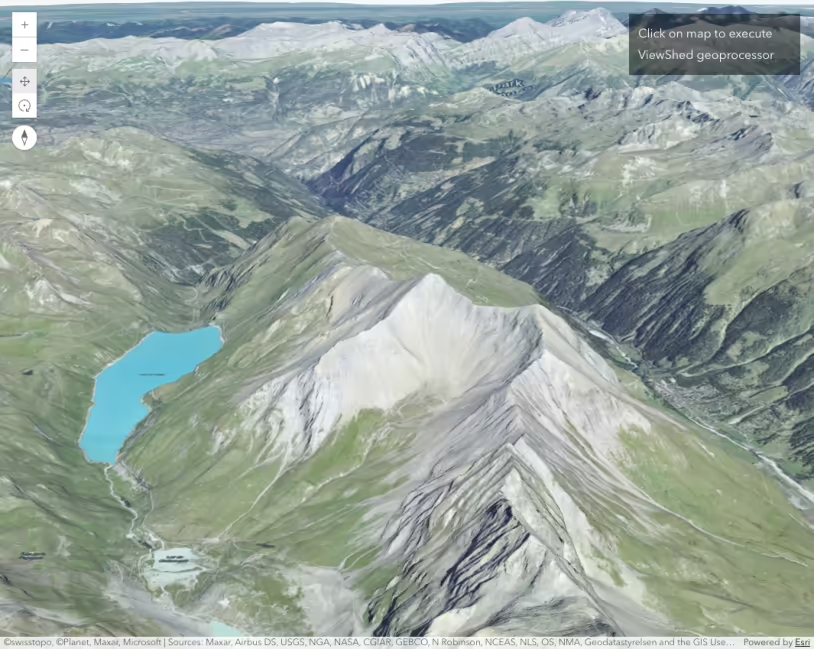
Geoprocessing - viewshed analysis
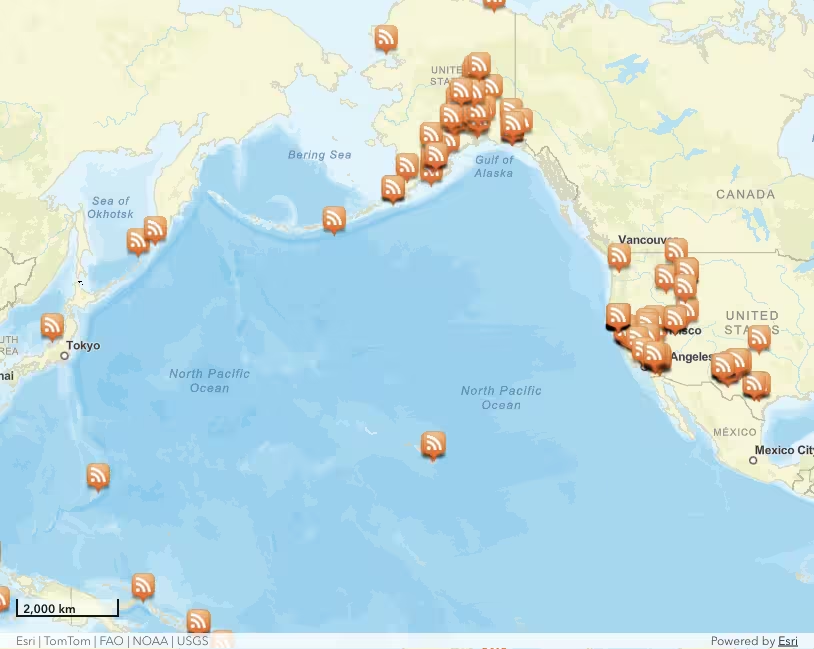
GeoRSSLayer
GraphicsLayer with visibilityTimeExtent
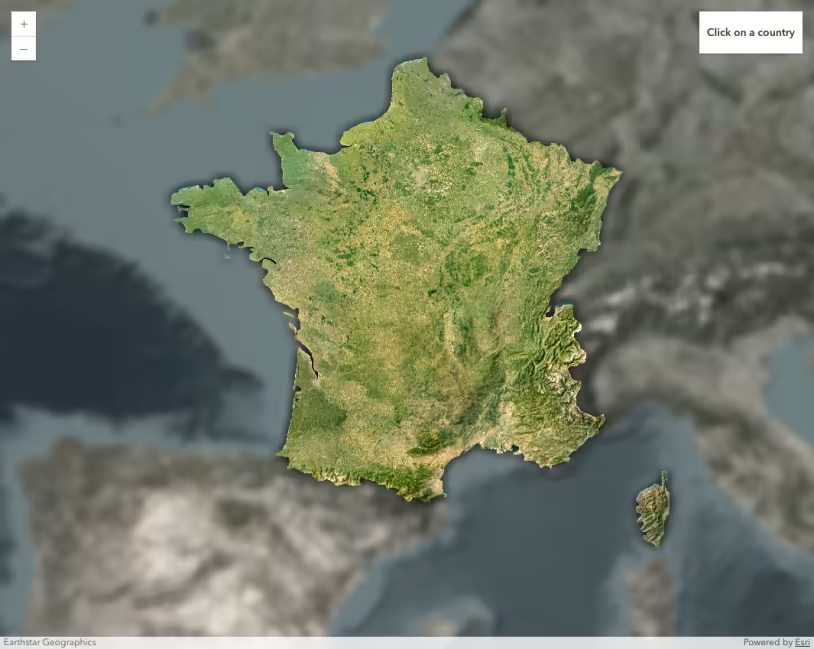
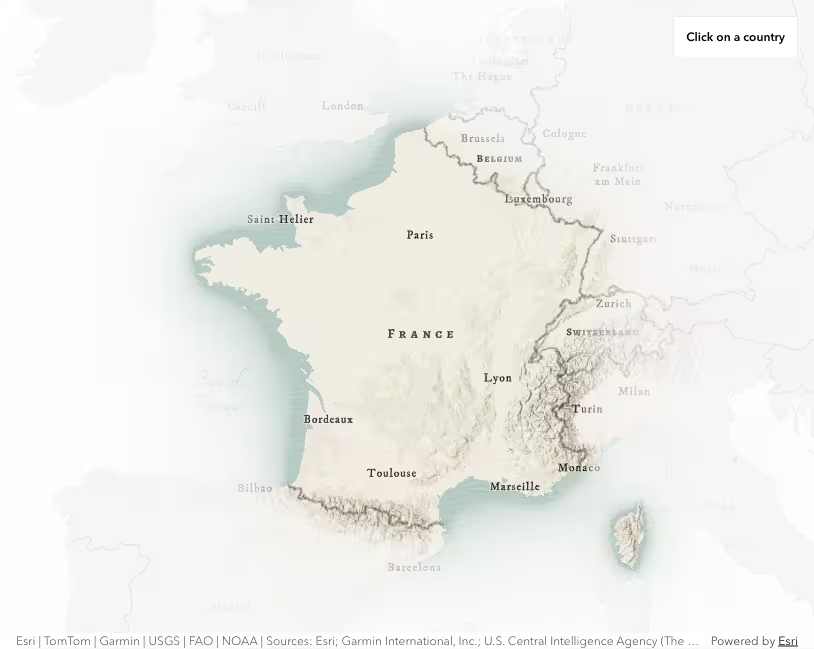
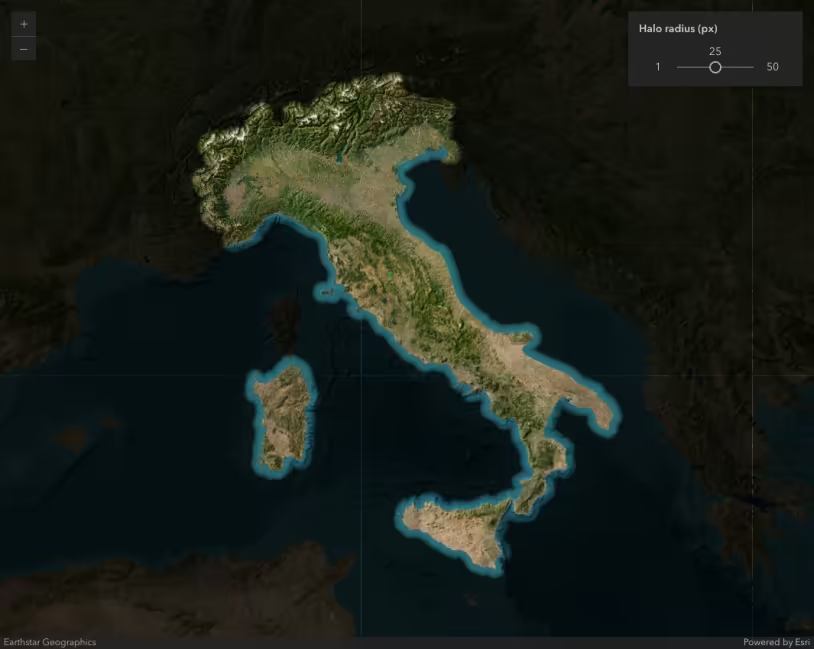
Highlight a country with an effect
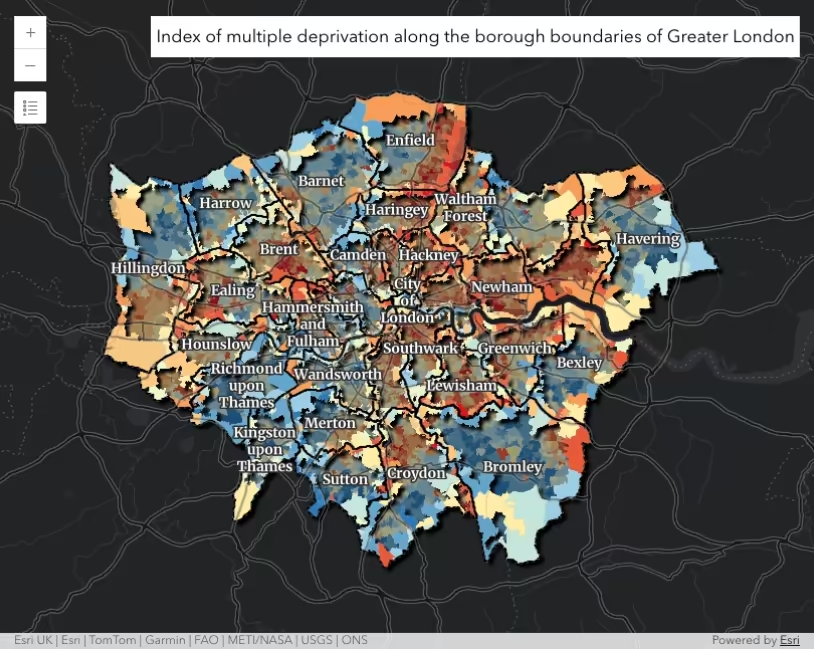
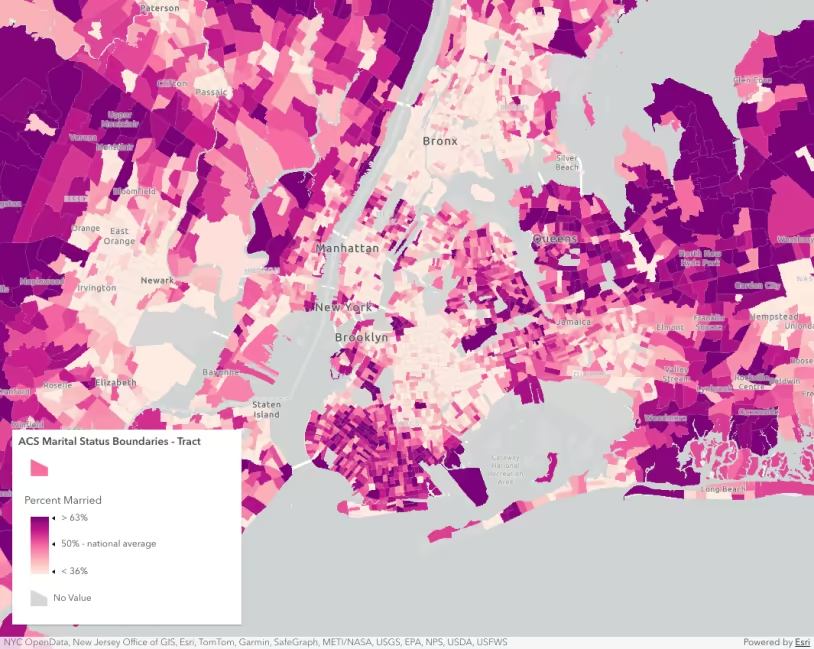
Highlight areas intersecting borough boundaries
Highlight feature with effects and blending
Highlight SceneLayer
Histogram component
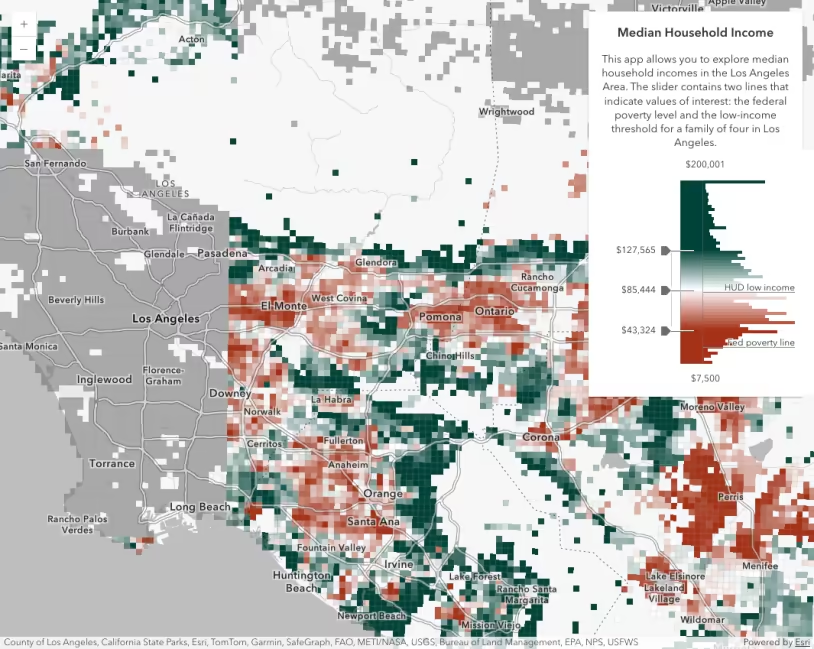
Histogram Range Slider
Hit test features by screen rectangle
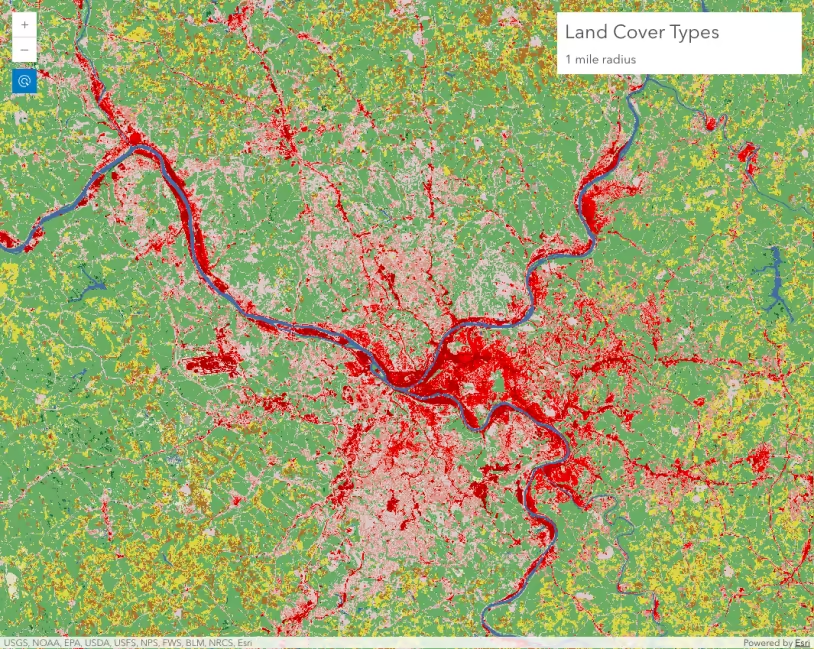
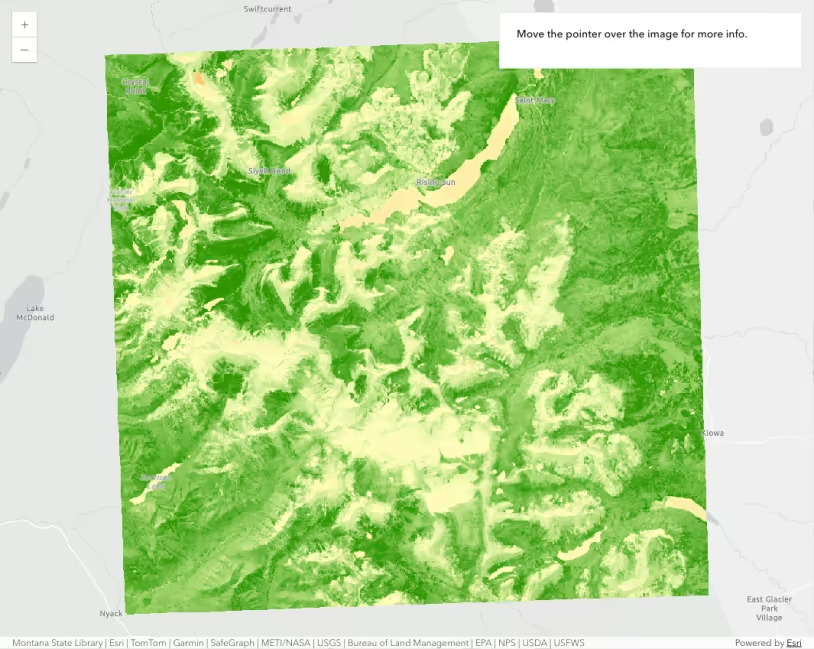
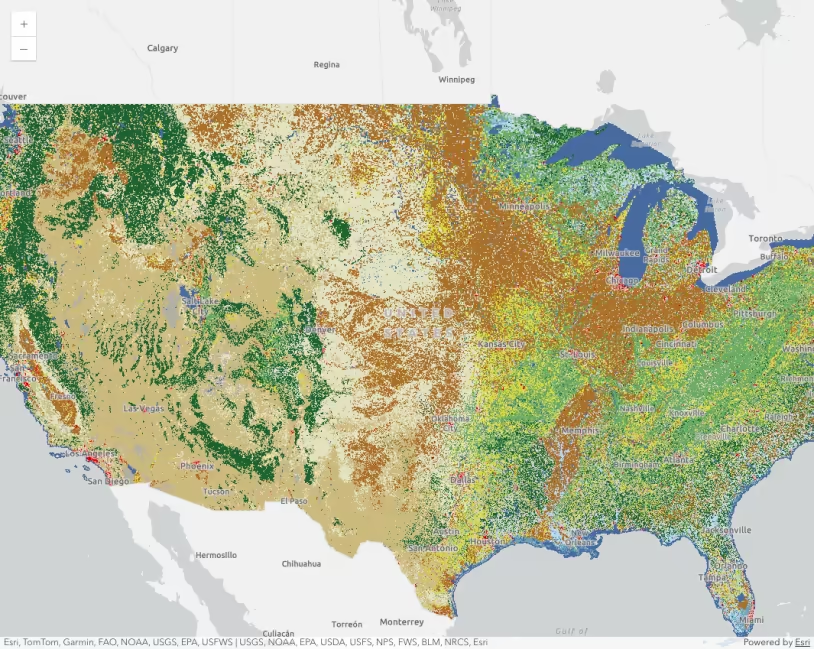
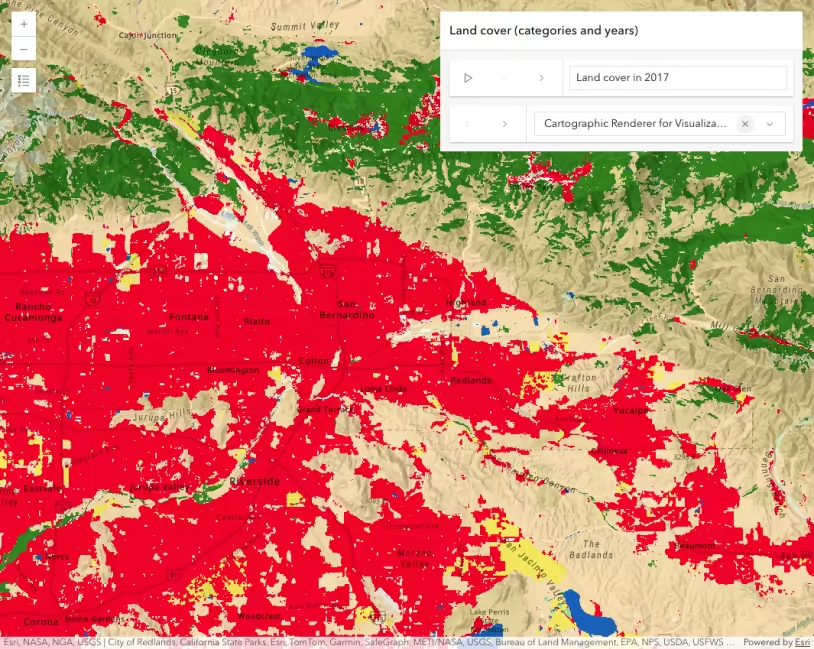
Hosted Land Cover ImageryTileLayer
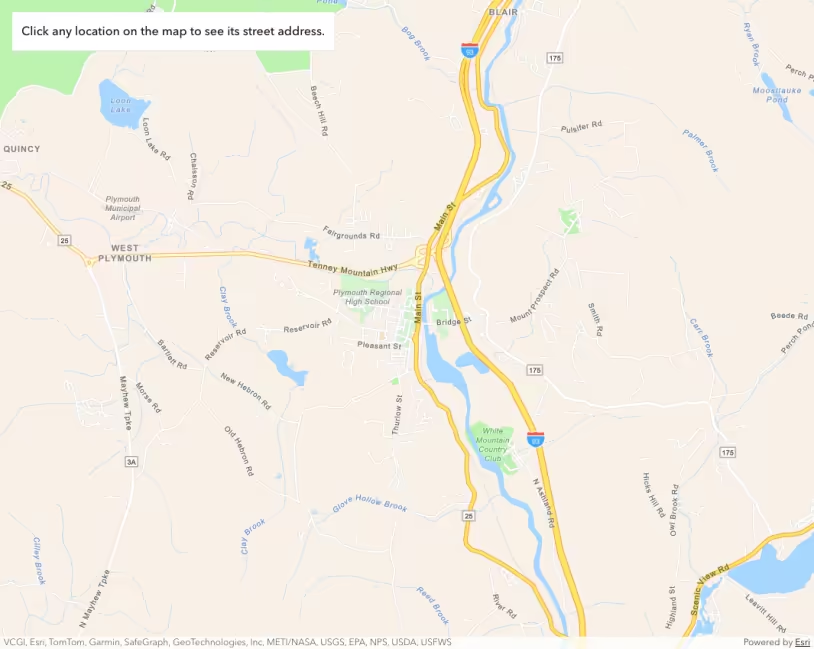
Identify
ImageryLayer - client side chart
ImageryLayer - client side pixel filter
ImageryLayer - image coordinate system
ImageryLayer - raster attribute table
ImageryLayer - raster function
ImageryLayer - server side raster function
ImageryTileLayer - raster function
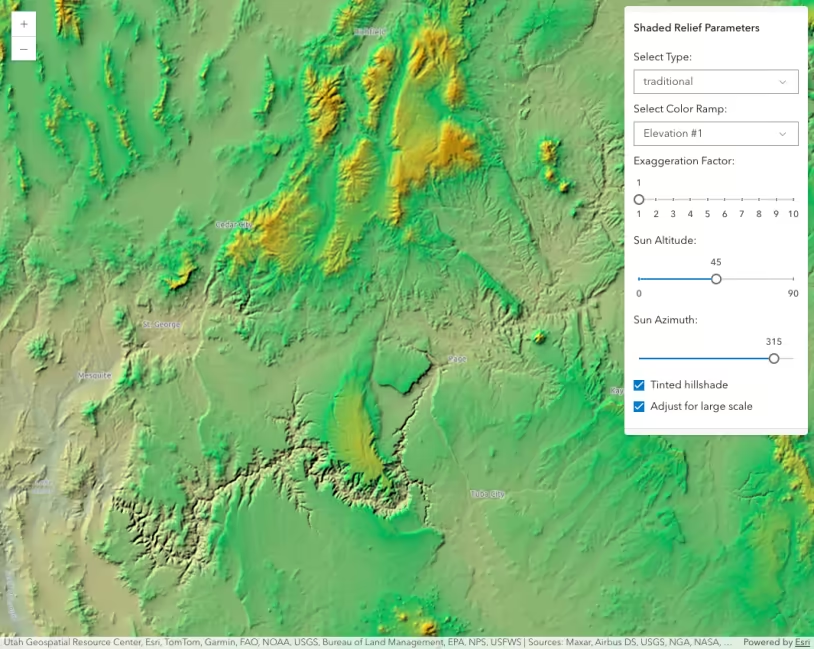
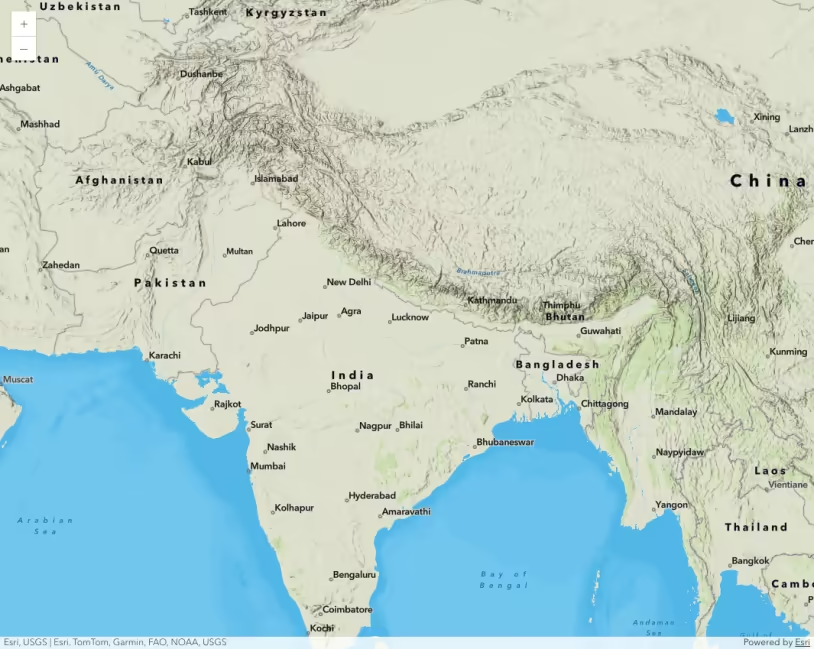
ImageryTileLayer - shaded relief renderer
ImageryTileLayer with COG
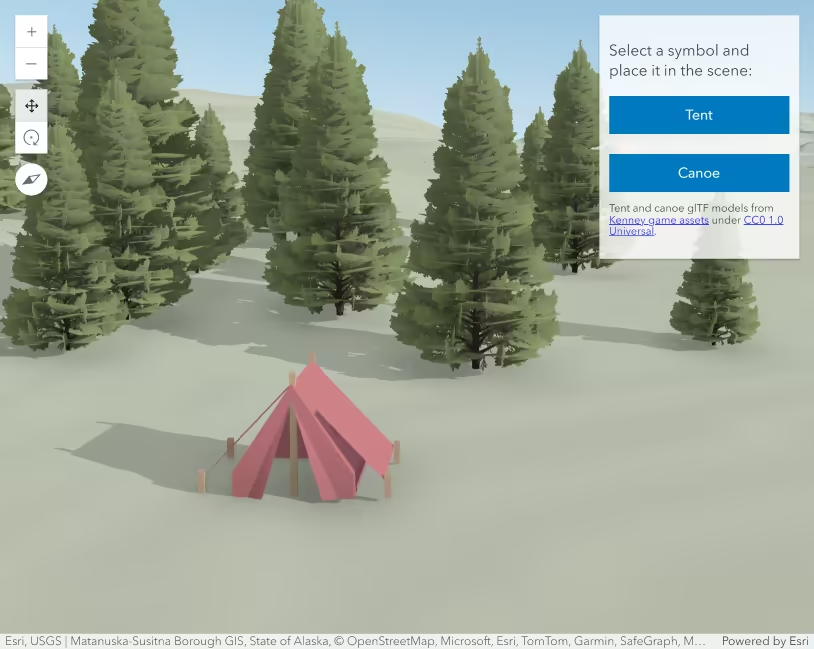
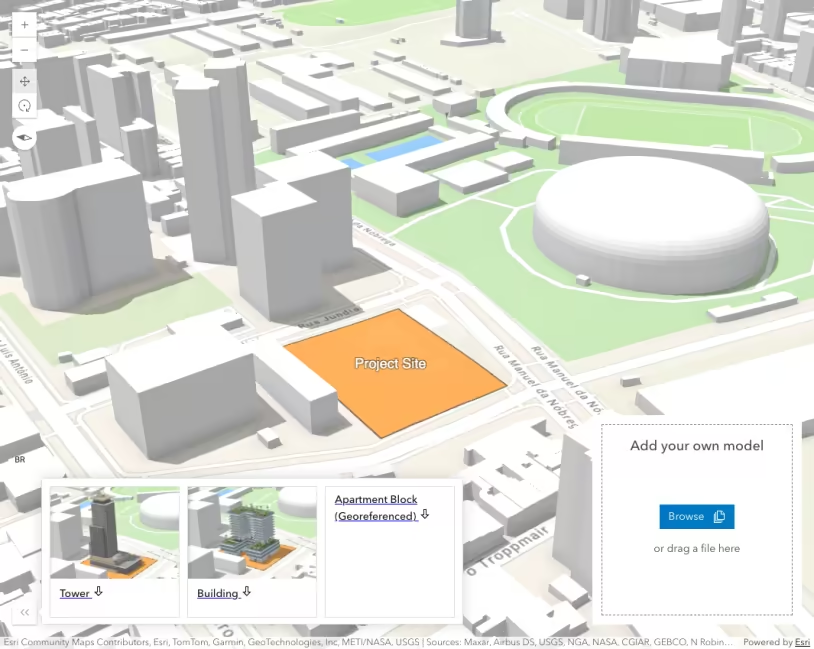
Import glTF 3D Models
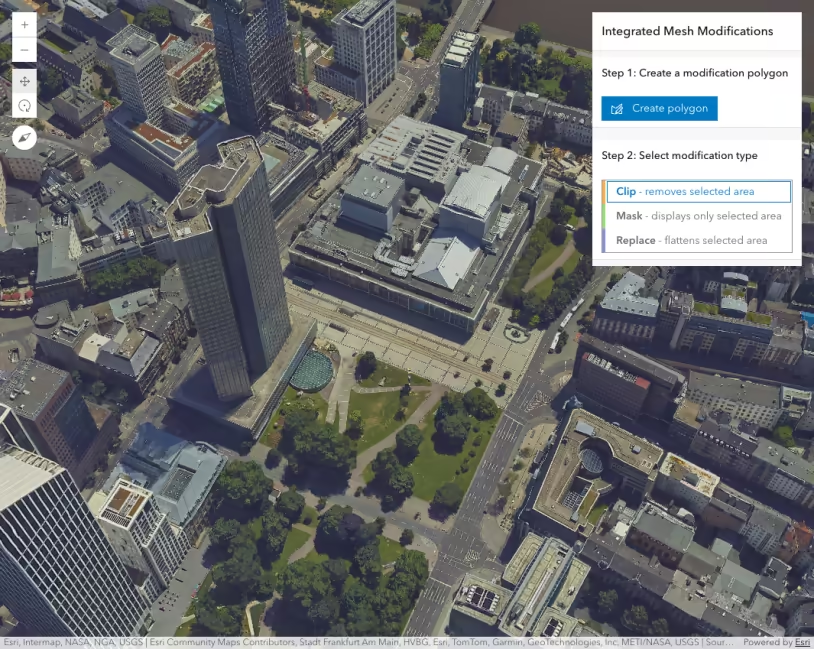
Integrated mesh modification
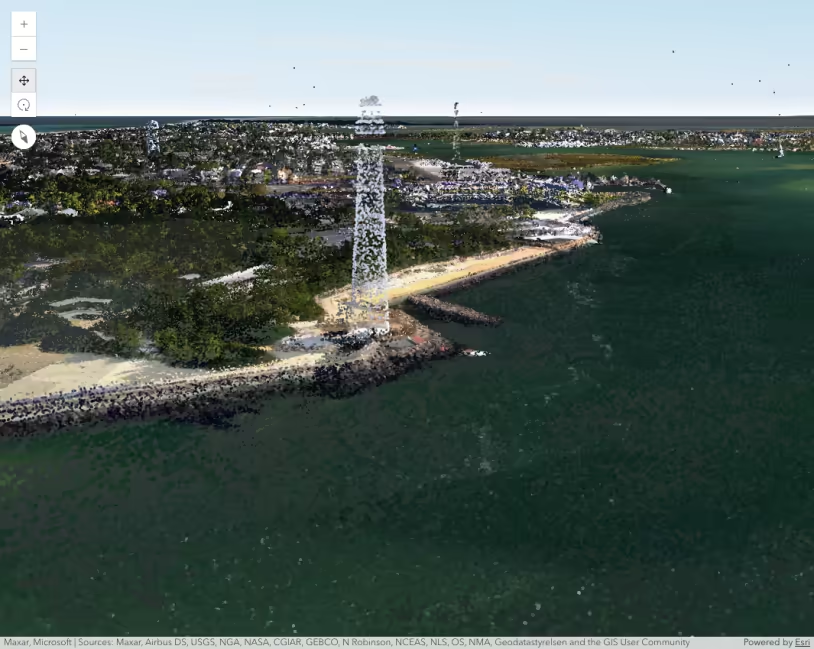
IntegratedMesh3DTilesLayer
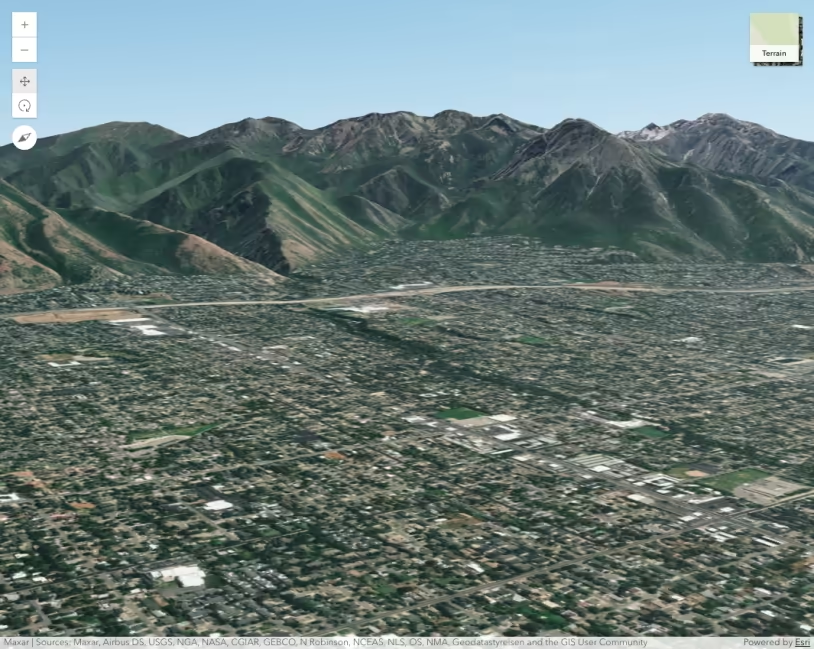
IntegratedMeshLayer
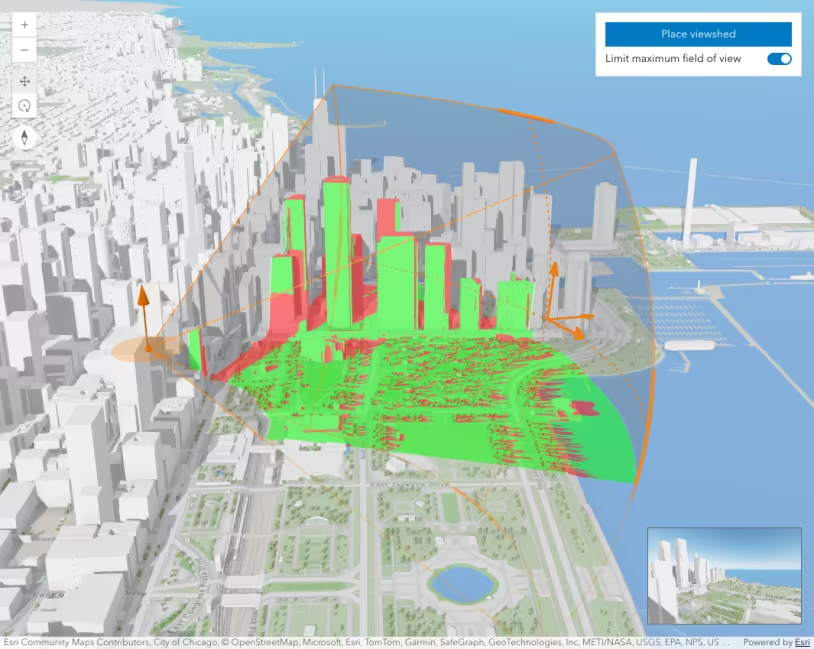
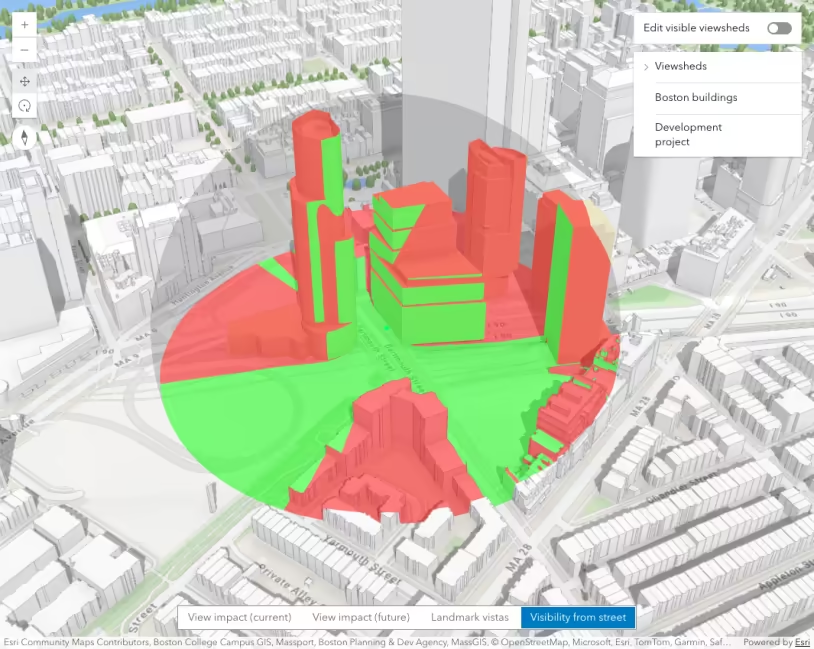
Interactive viewshed analysis
Intro to binning
Intro to CatalogLayer
Intro to CIMSymbol
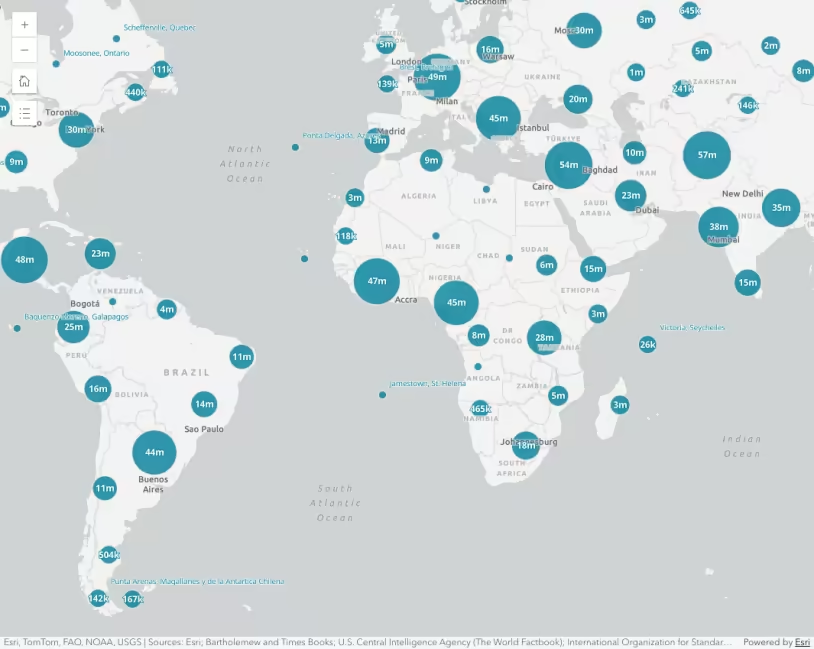
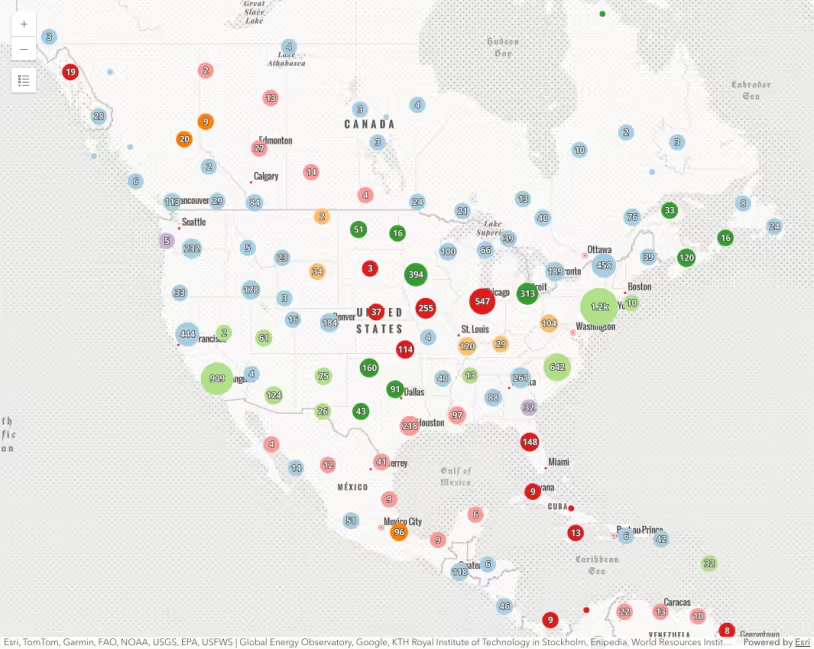
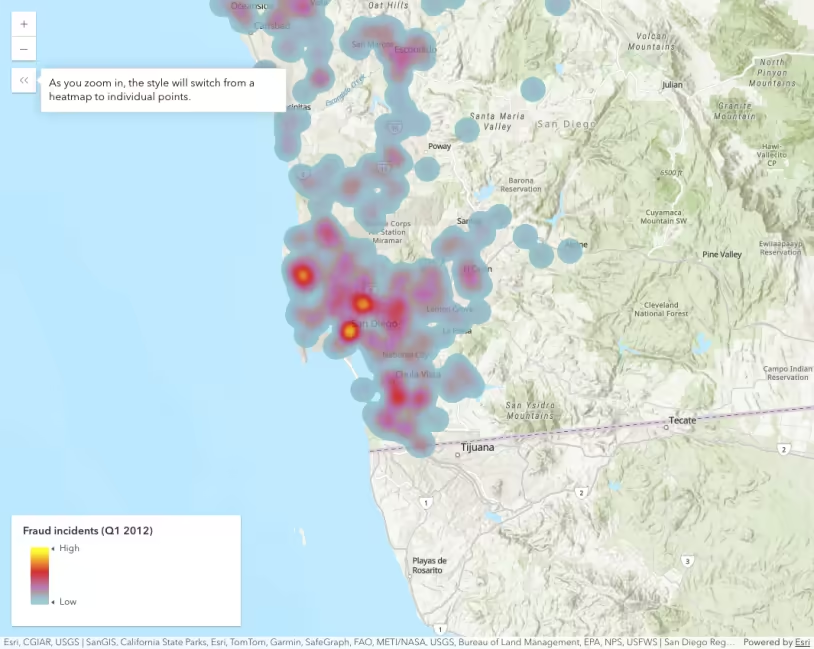
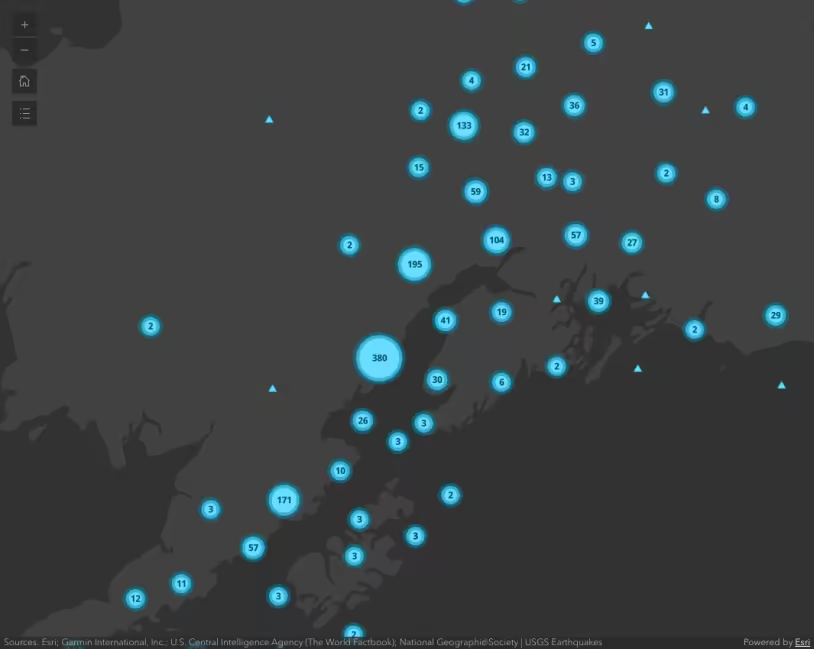
Intro to clustering
Intro to CSVLayer
Intro to FeatureLayer
Intro to graphics
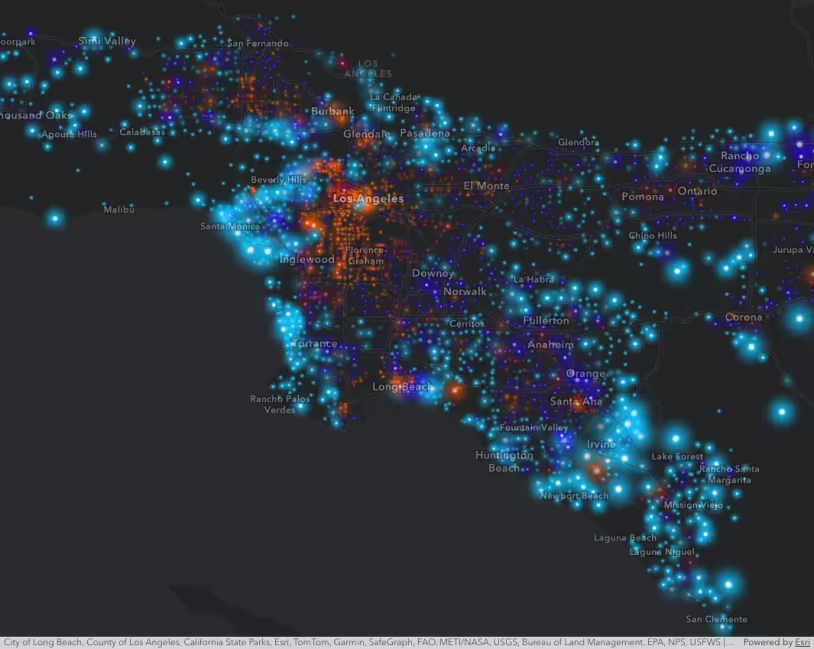
Intro to heatmap
Intro to ImageryLayer
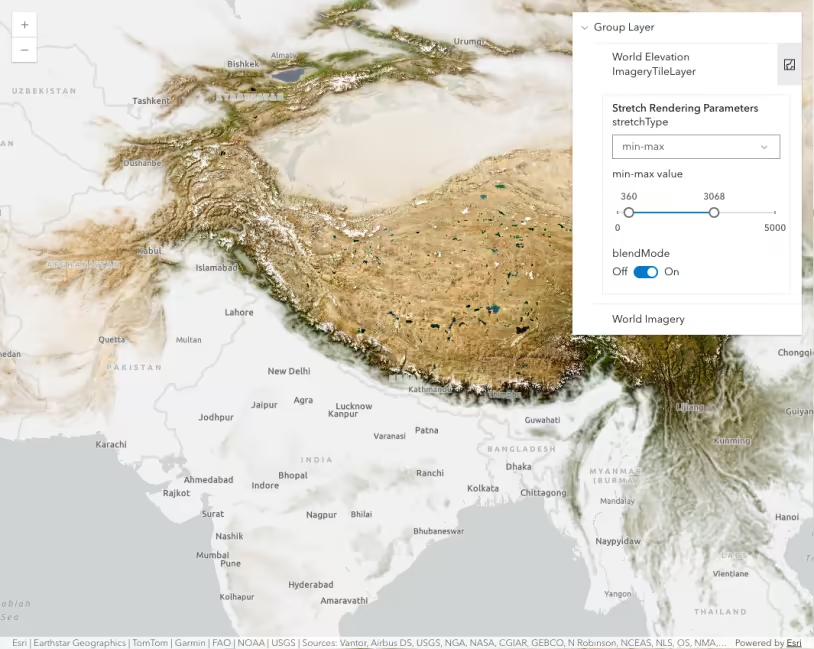
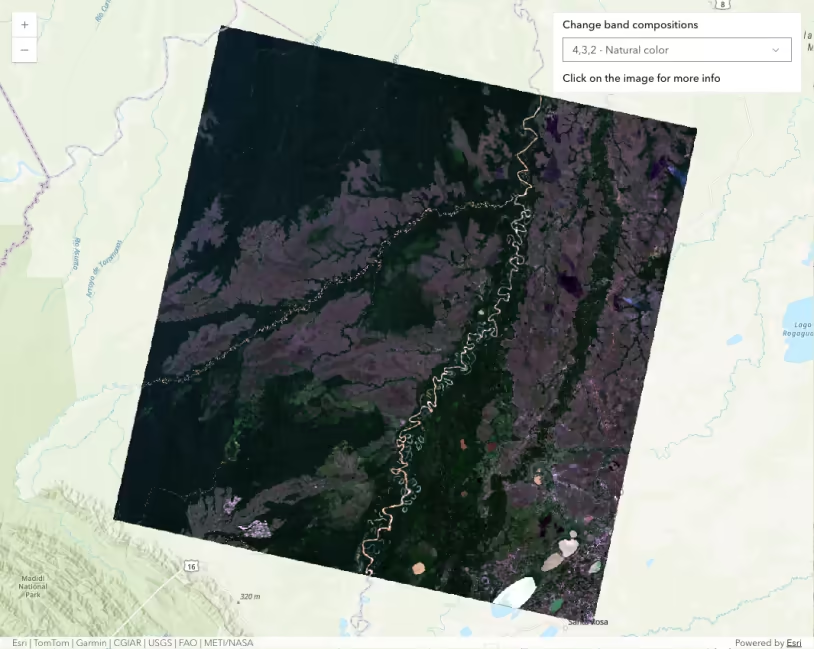
Intro to ImageryTileLayer
Intro to layer blending
Intro to layer effect
Intro to map components - Create a 2D map
Intro to MapImageLayer
Intro to MapView - Create a 2D map
Intro to OrientedImageryLayer
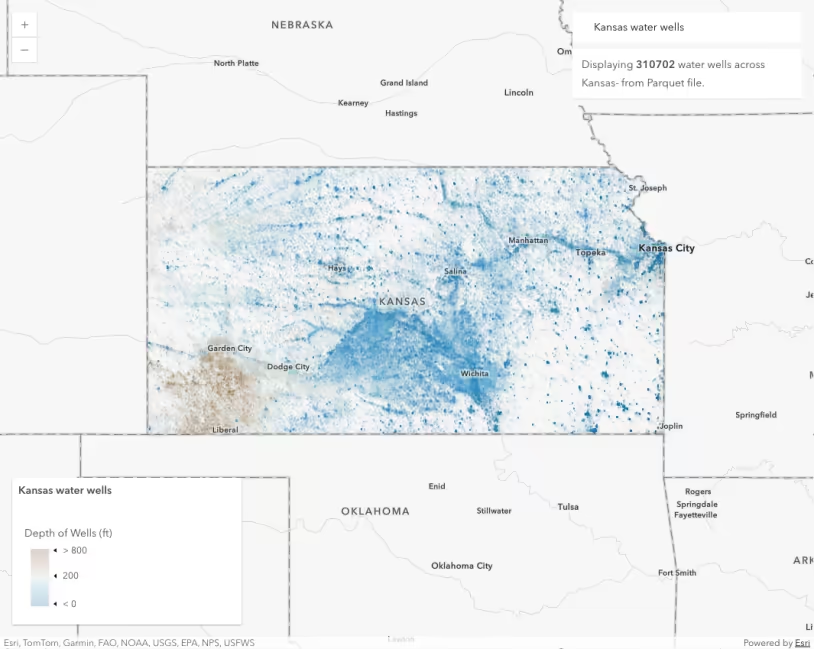
Intro to ParquetLayer
Intro to PointCloudLayer
Intro to popup component
Intro to PopupTemplate
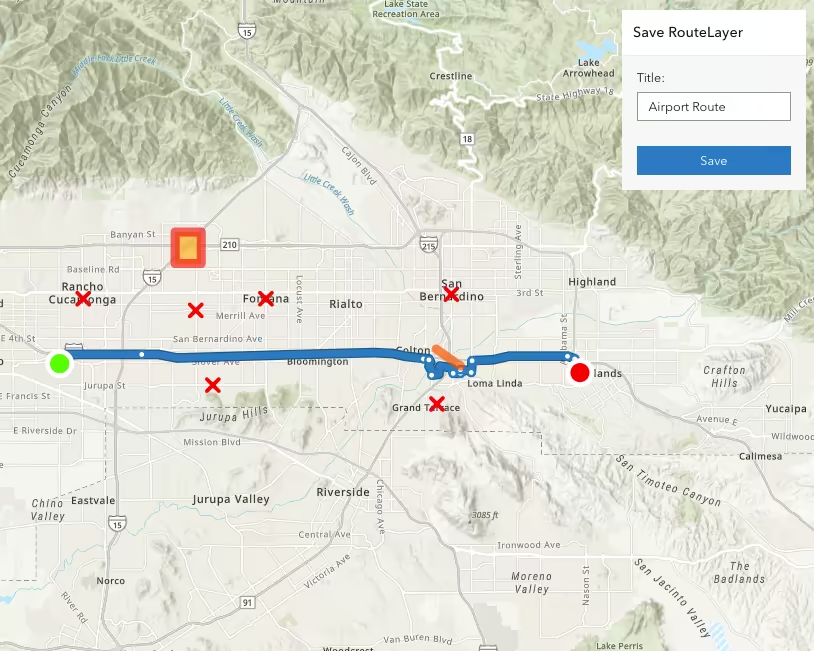
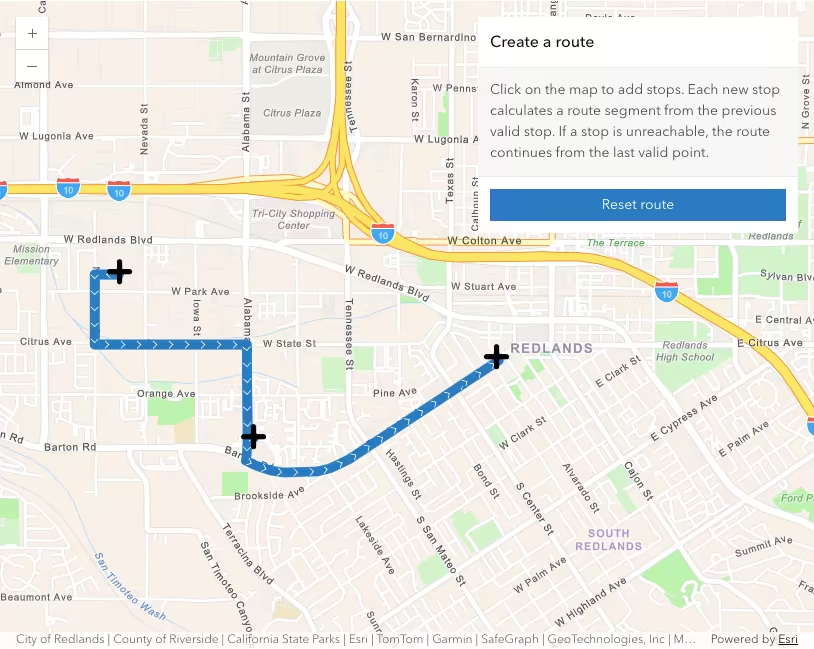
Intro to RouteLayer
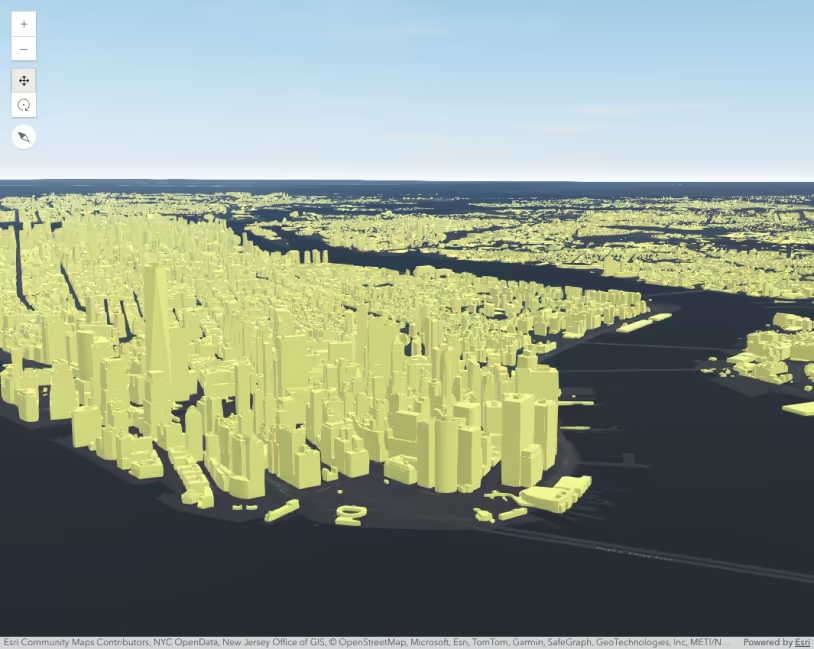
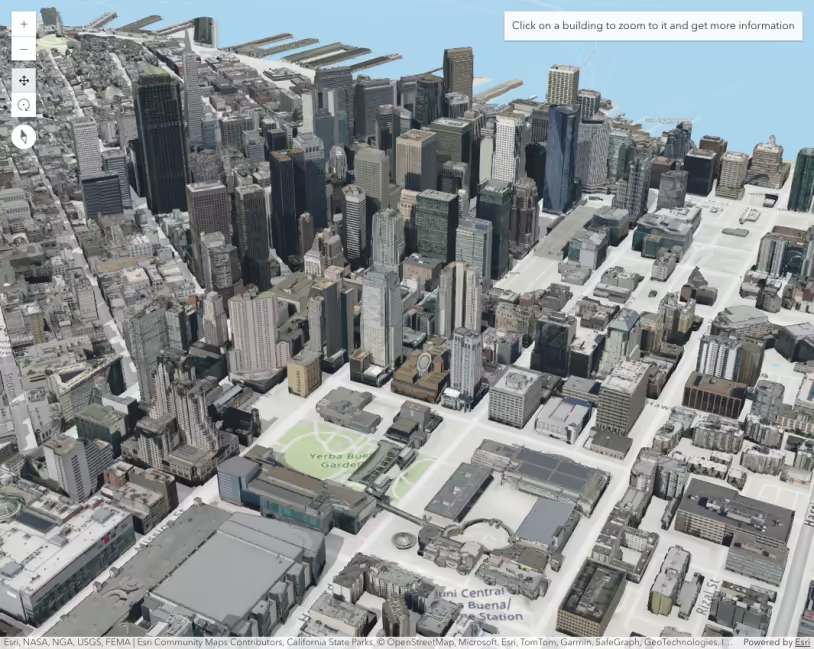
Intro to SceneLayer
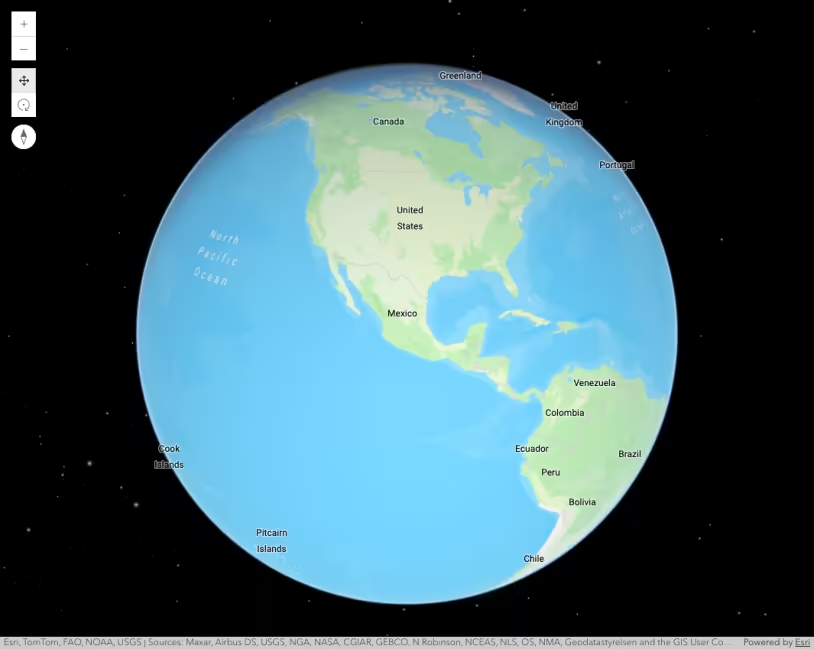
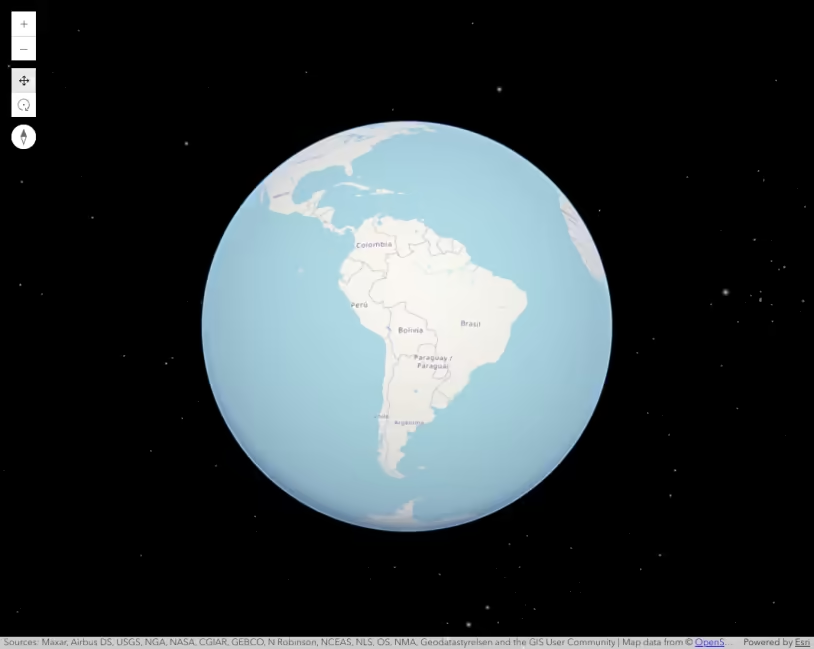
Intro to SceneView - Create a 3D map
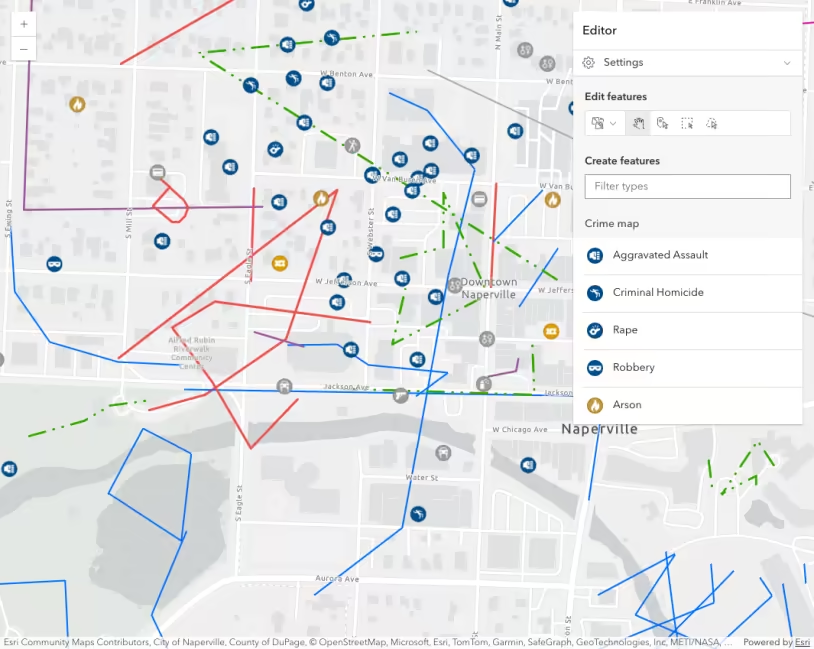
Intro to SubtypeGroupLayer
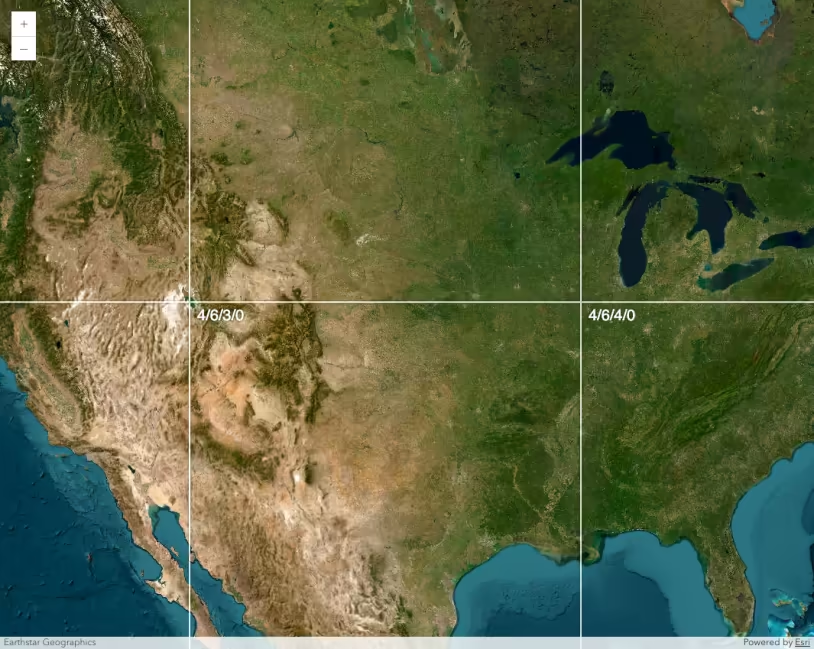
Intro to TileLayer
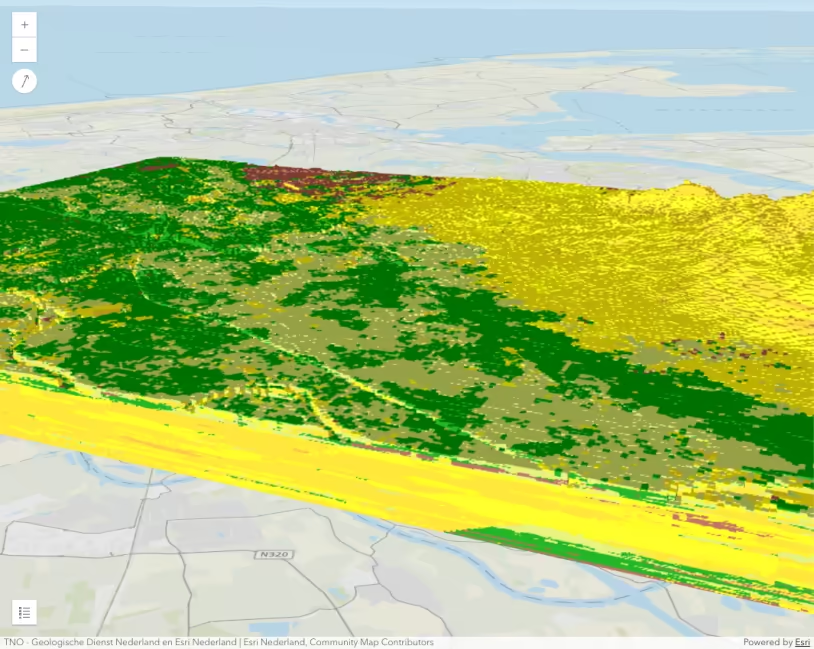
Intro to VoxelLayer
Intro to WCSLayer
KMLLayer
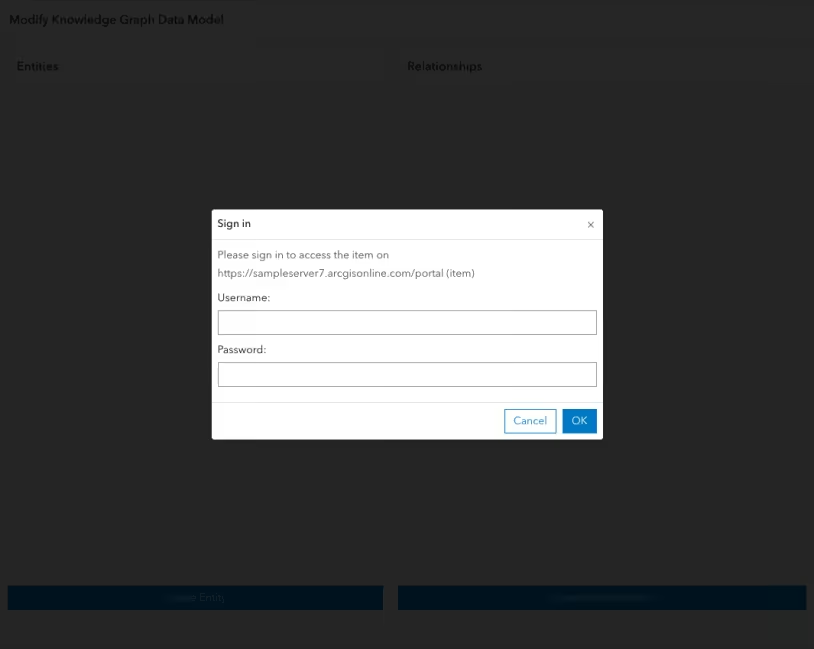
Knowledge Graph Data Model Editing
Label features using Arcade expressions
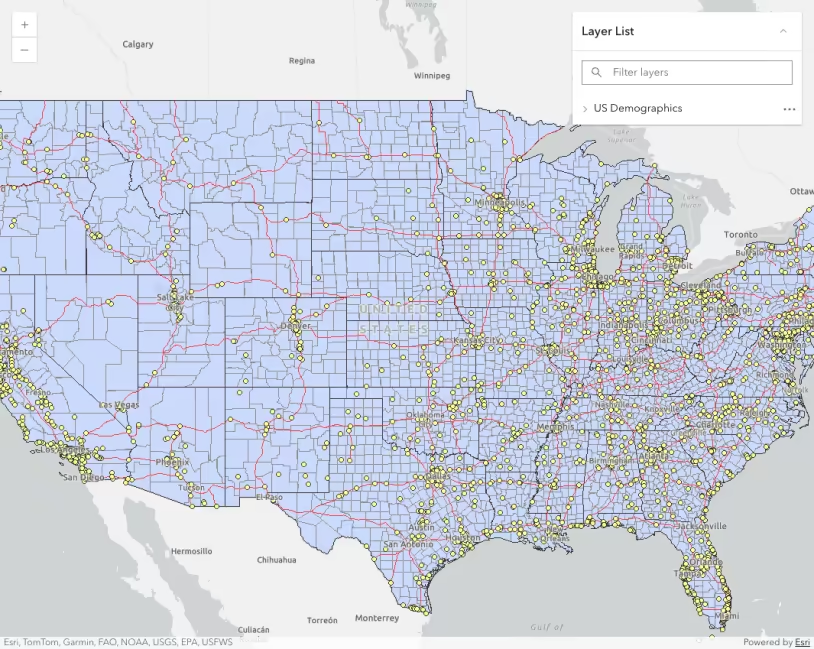
LayerList component
LayerList component with actions

LayerList widget
LayerList widget with actions
LayerList widget with Legend
Legend component
Legend component card style
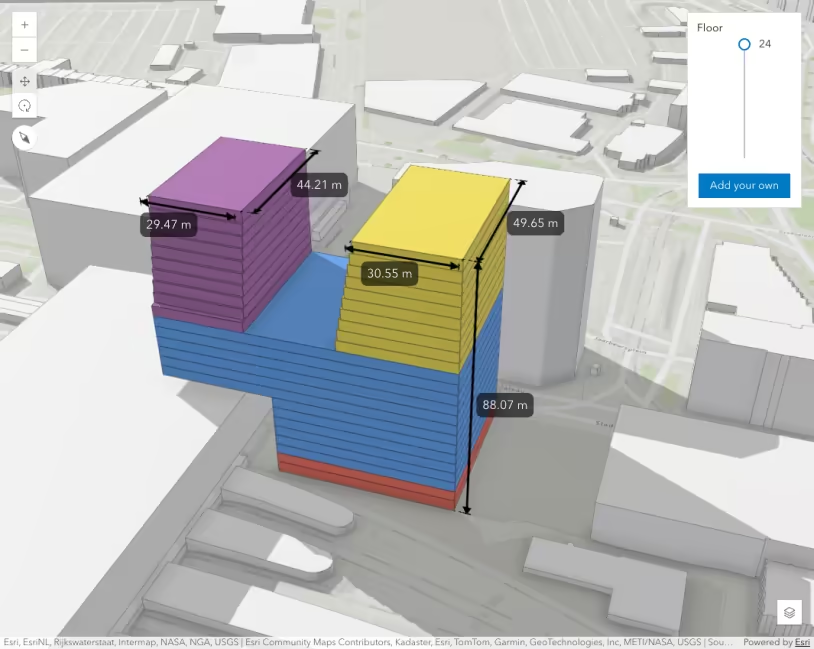
Length dimensioning
Line markers and label placement
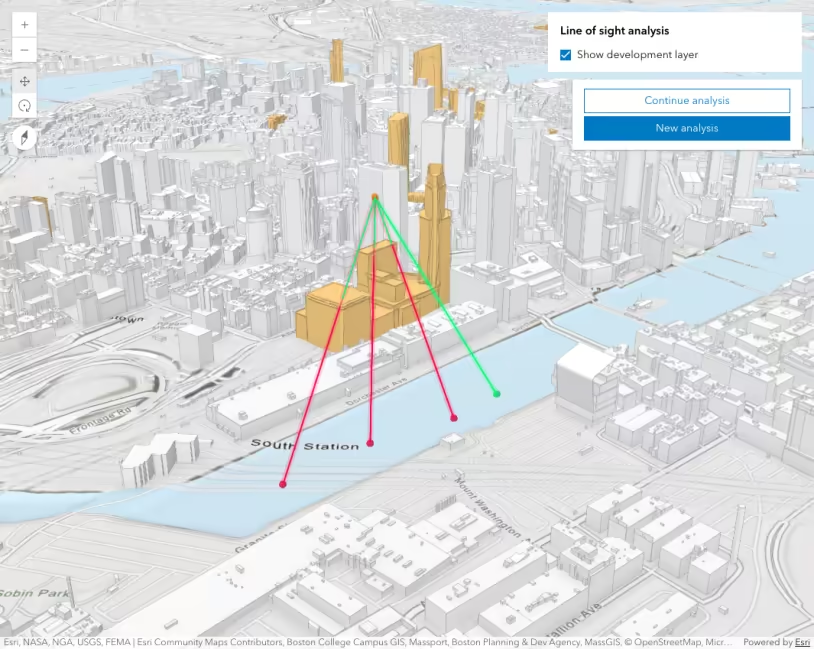
Line of sight component
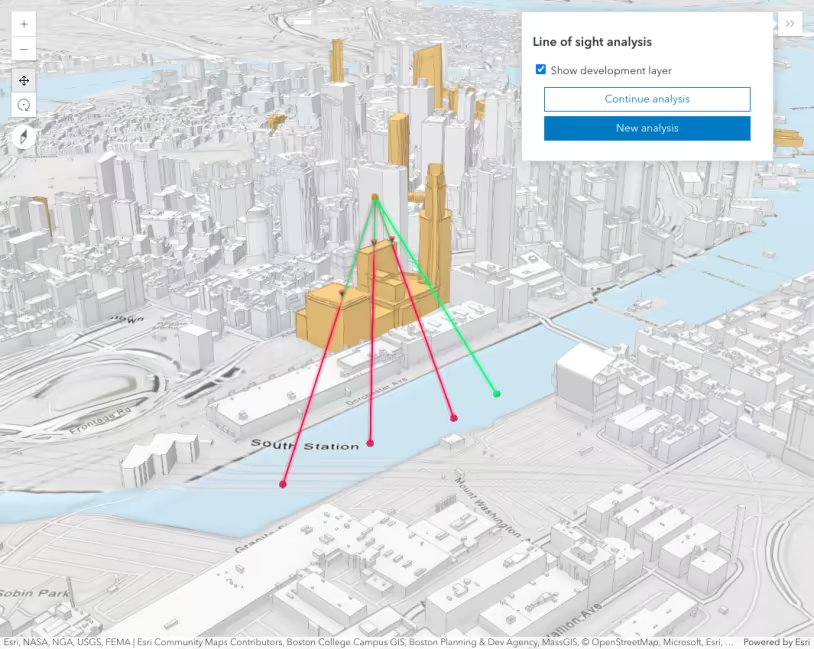
Line of sight widget
Line patterns in 3D
Load a basic web scene
Load a basic WebMap
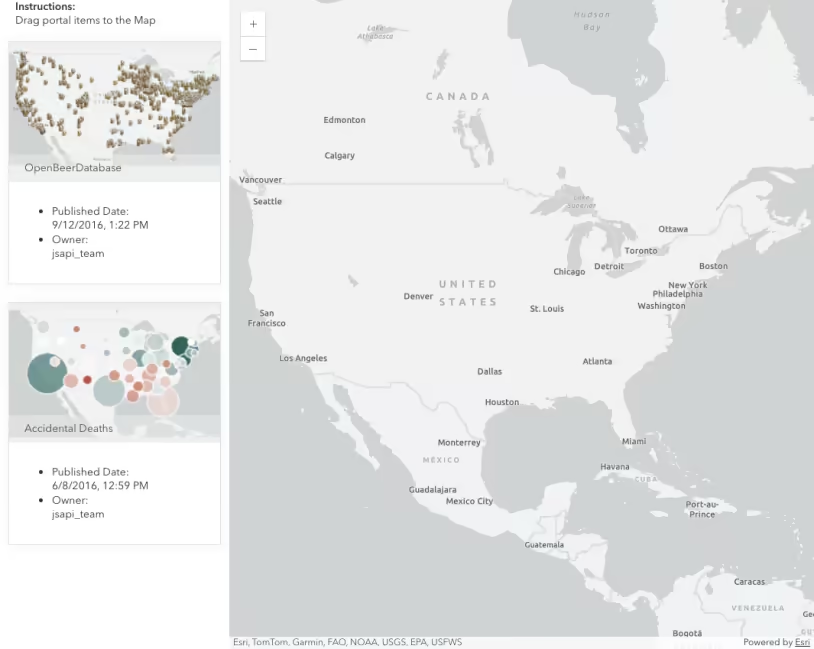
Load portal items via drag & drop
Locate component
Low poly terrain using mesh geometry
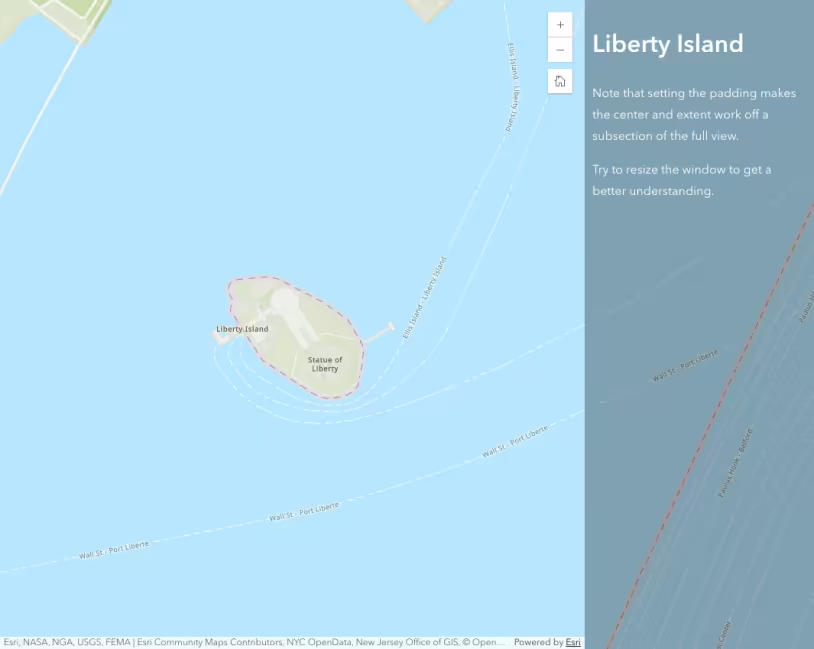
Map padding
MapImageLayer - create dynamic map layers
MapImageLayer - dynamic data layer with query table
MapImageLayer - dynamic data layer with table join
MapImageLayer - Explore data from a dynamic workspace
MapImageLayer - label sublayer features
MapImageLayer - raster data source
MapImageLayer - Set definition expressions on sublayers
MapImageLayer - set renderers on sublayers
MapImageLayer - Toggle sublayer visibility
MapNotesLayer
Masking effect using a custom layer view
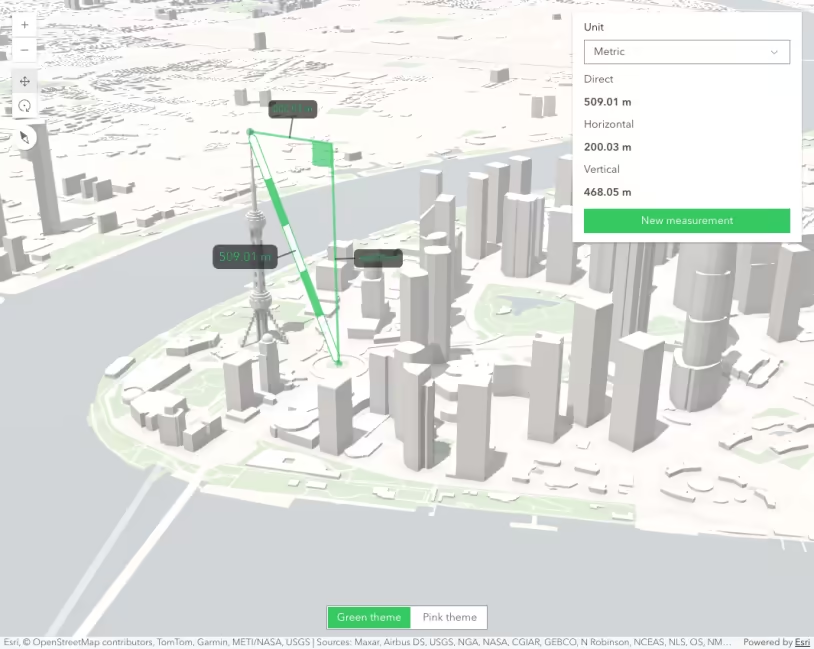
Measurement components (2D + 3D)
Measurement components in 3D
Measurement in 2D
Measurement in 3D
MediaLayer with animated gif
MediaLayer with control points
MediaLayer with images
MediaLayer with interactive georeferencing
MediaLayer with video
Modify the color scheme of a continuous variable
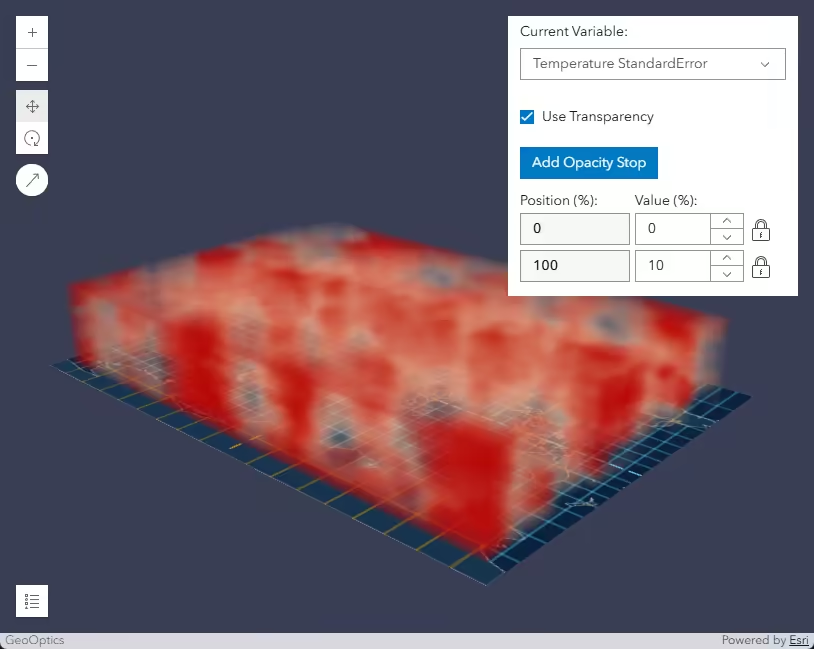
Modify the opacity of a continuous variable
Multi-line labels
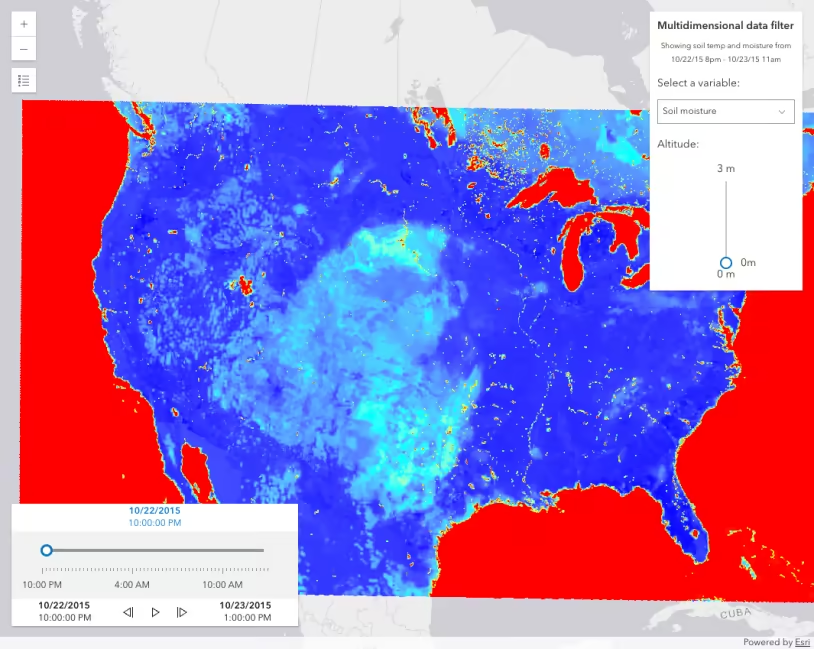
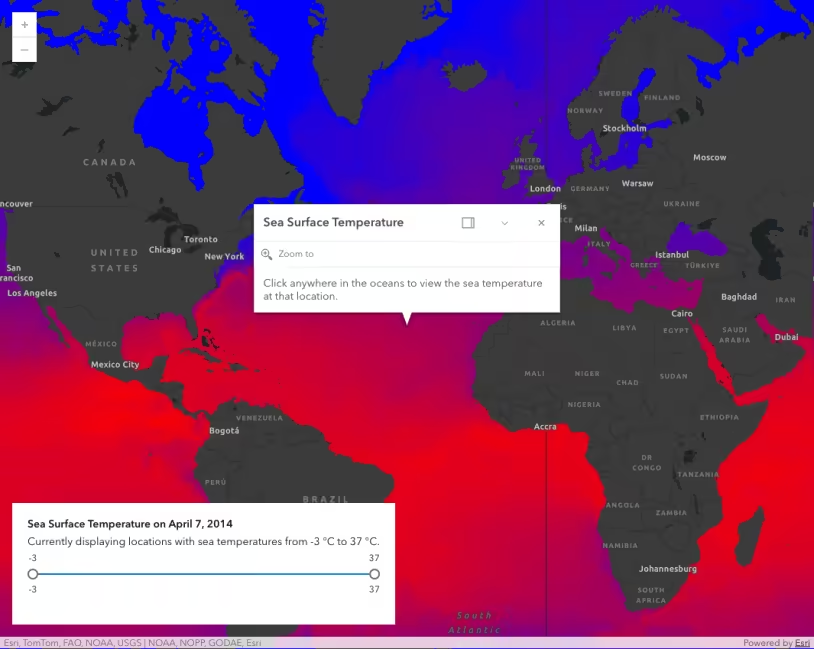
Multidimensional ImageryTileLayer
Multiple popup elements
Multiply blendMode
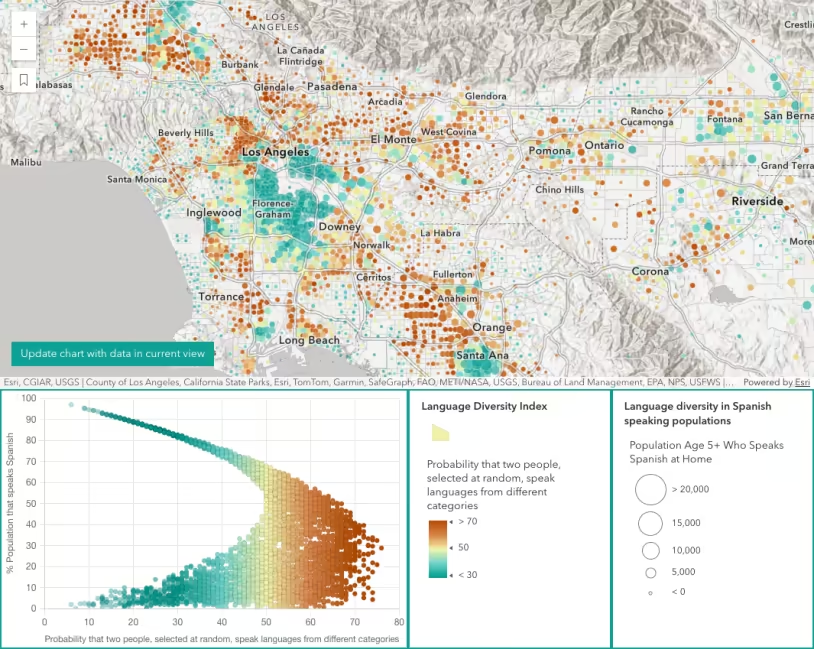
Multivariate data exploration
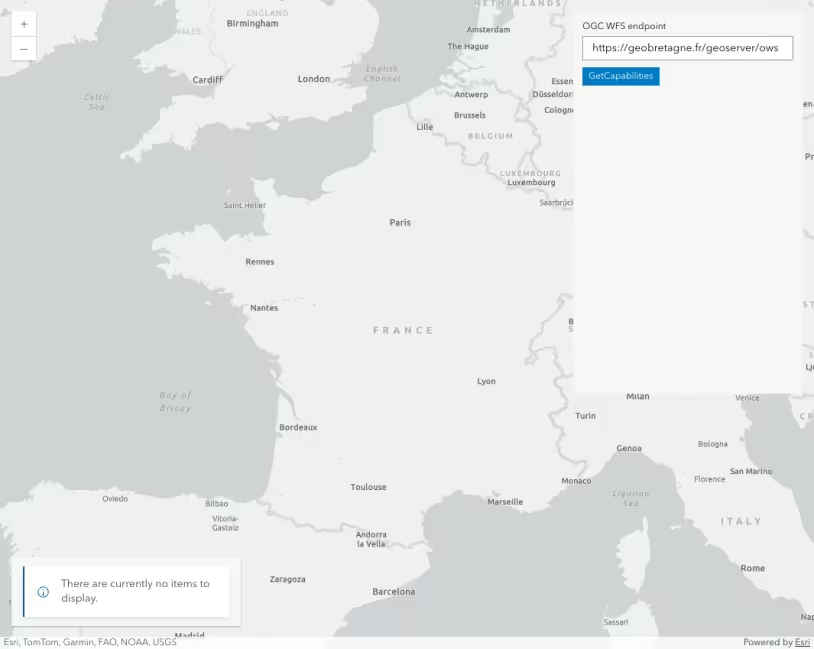
OGCFeatureLayer
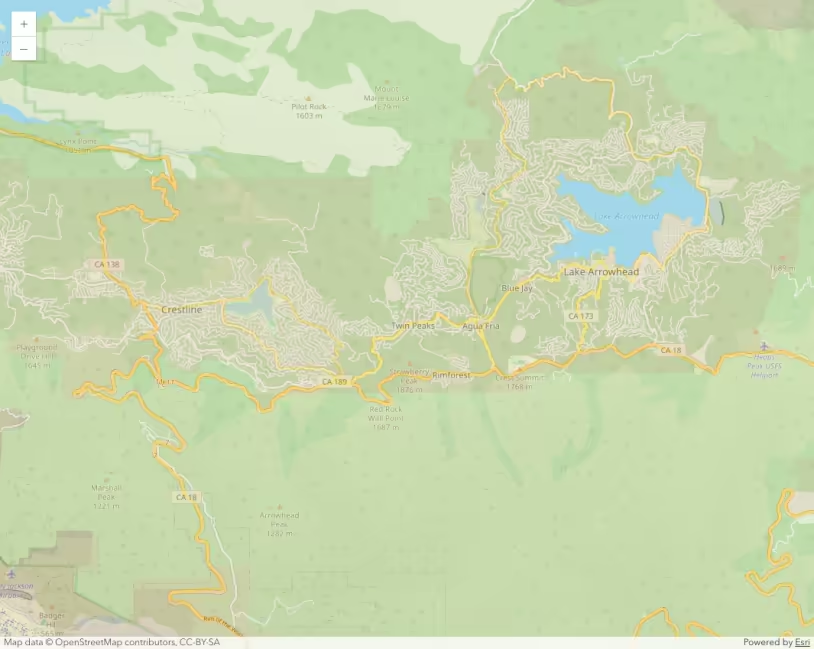
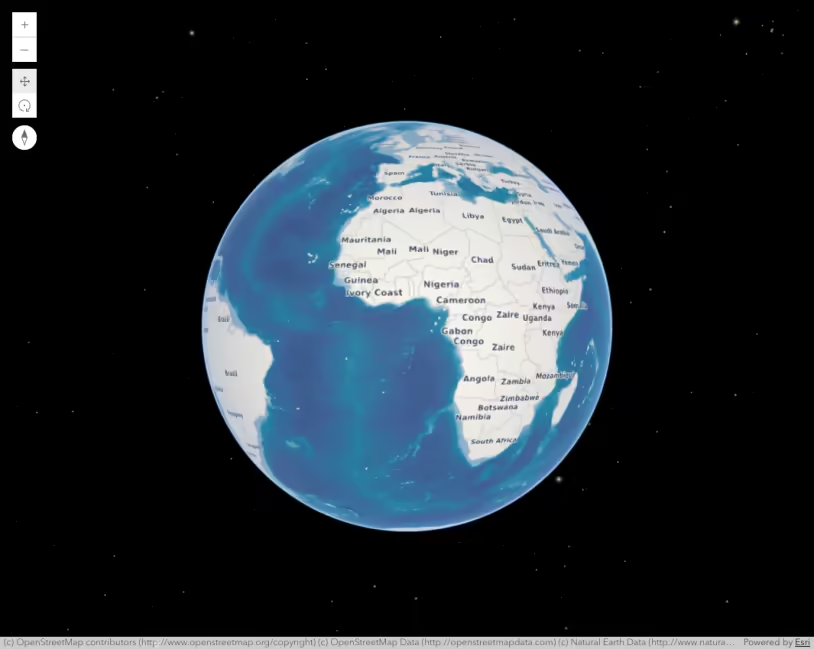
OpenStreetMapLayer
OrientedImageryLayer in SceneView
Override cluster symbol
Overview map
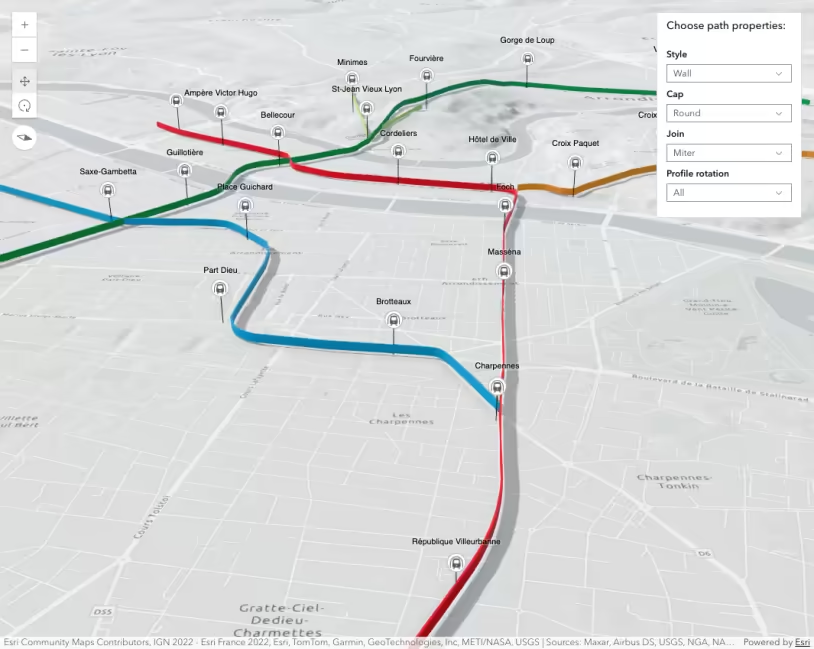
Path visualization in 3D
Pie charts
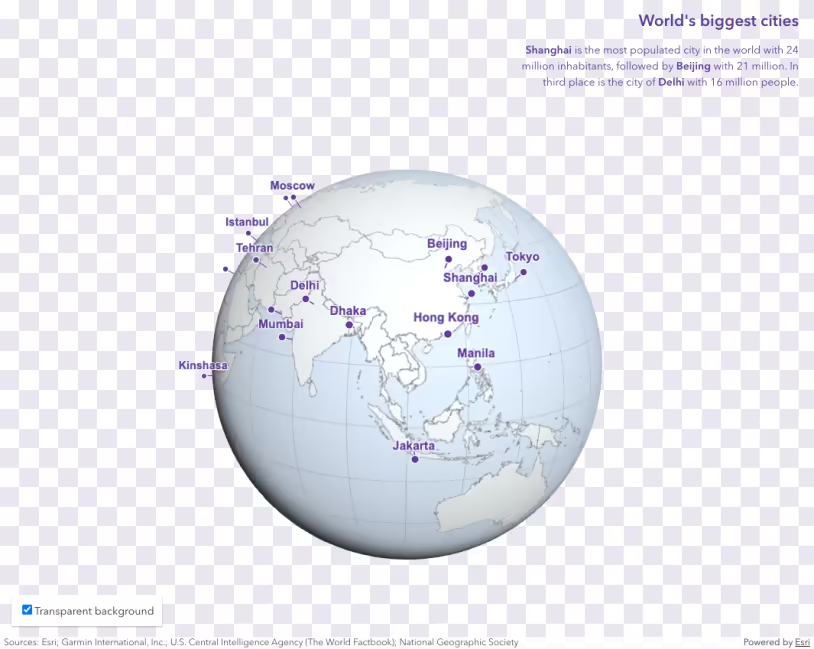
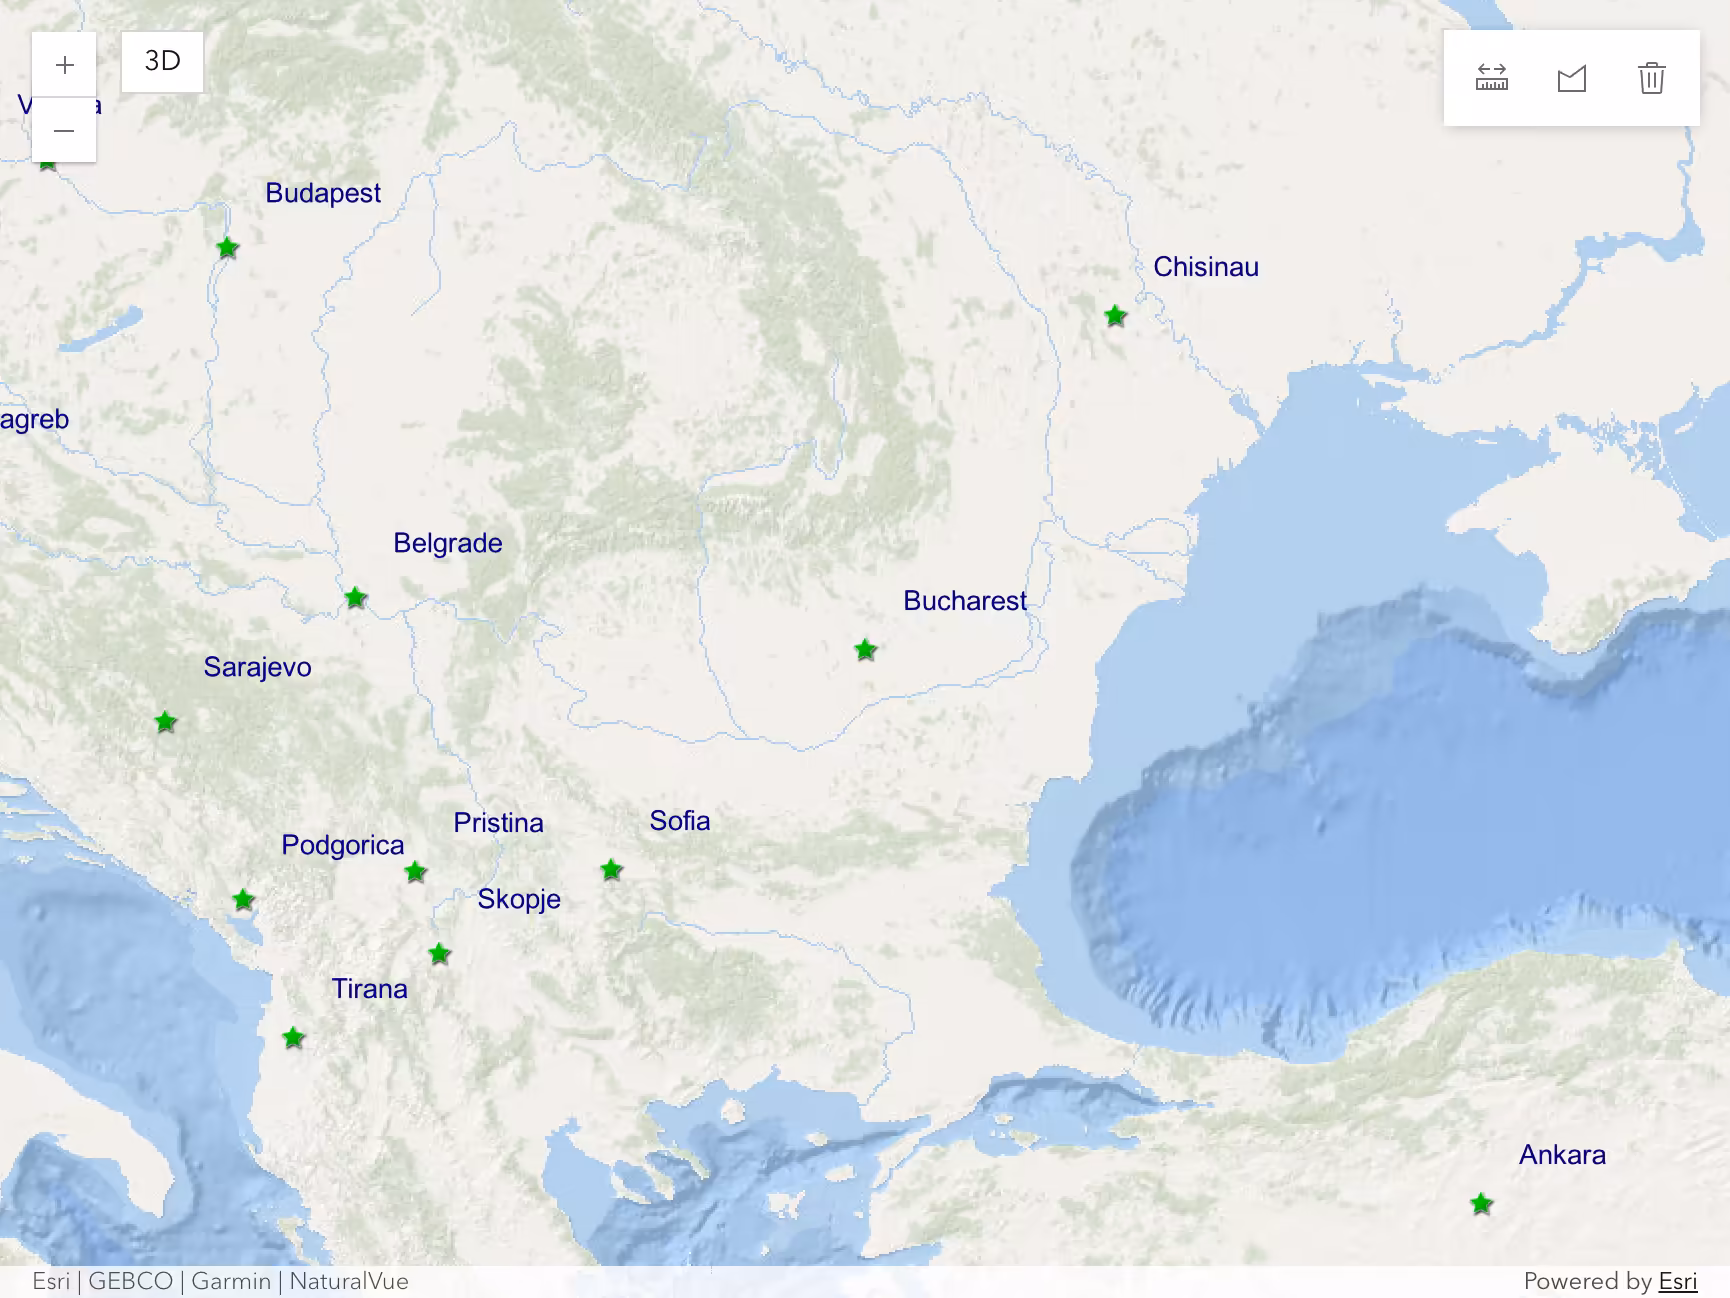
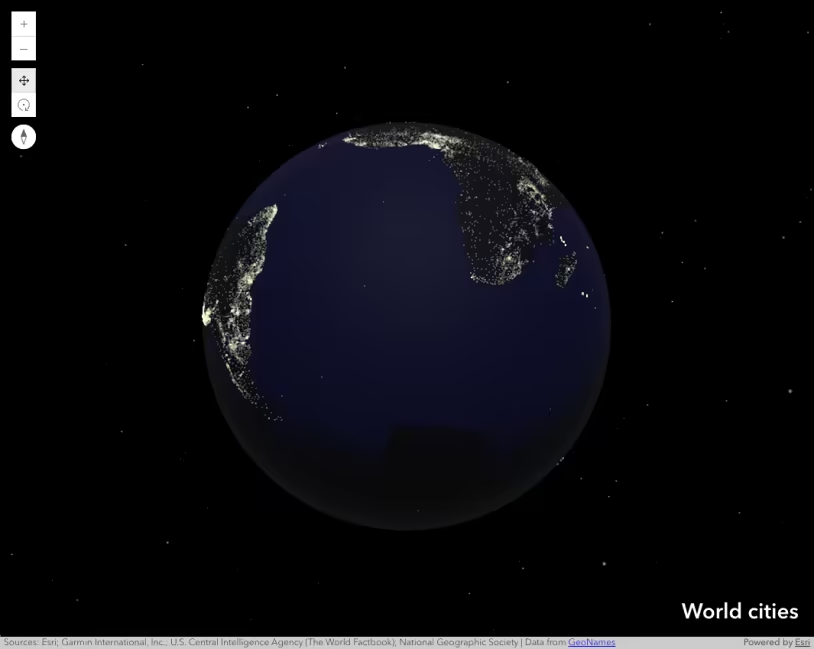
Point styles for cities
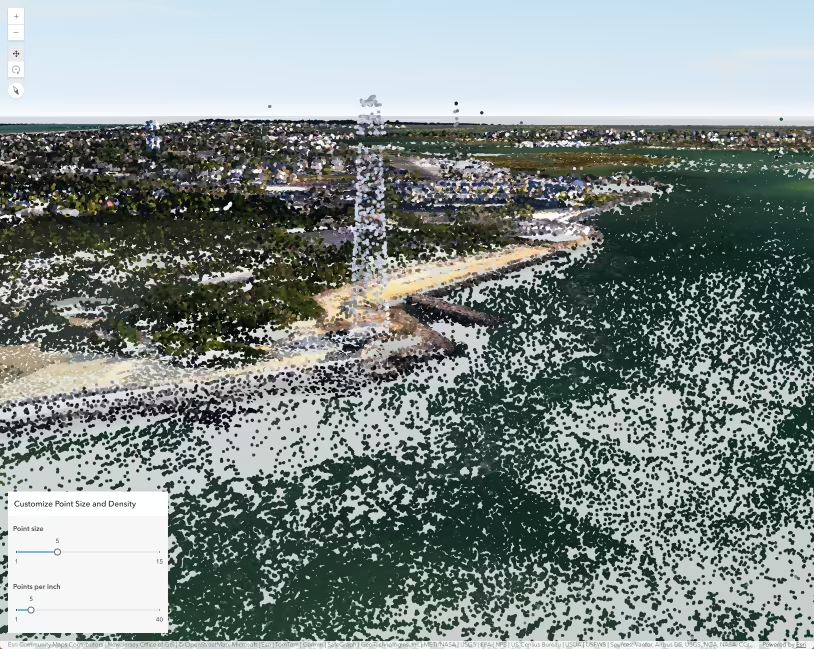
PointCloudLayer - change point size and density
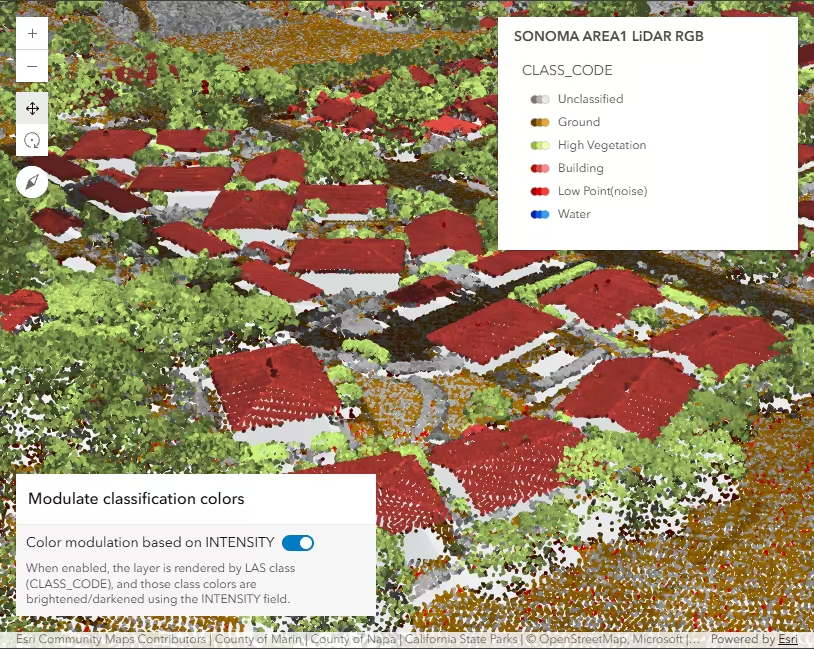
PointCloudLayer - intensity color modulation
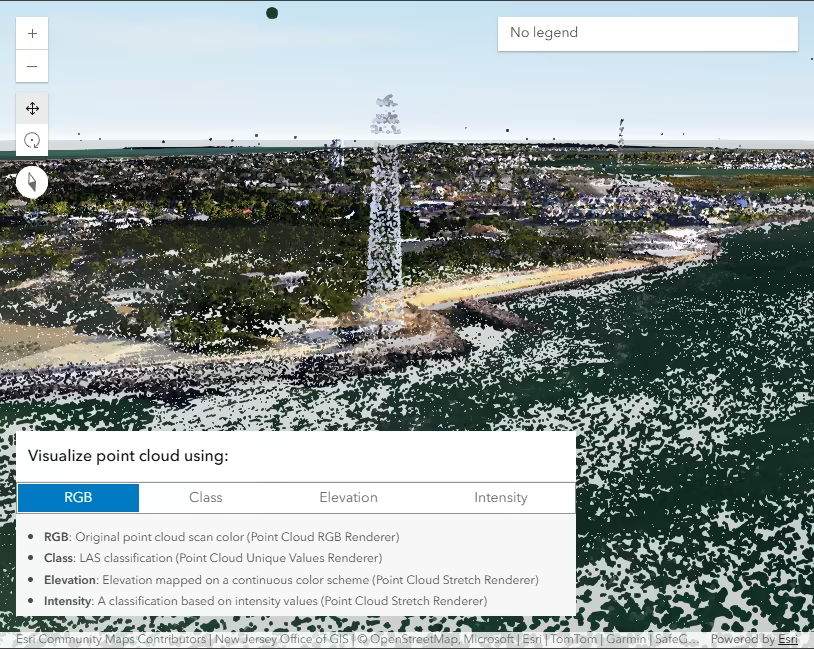
PointCloudLayer - toggle renderers
Popup actions
Popup charts for clusters
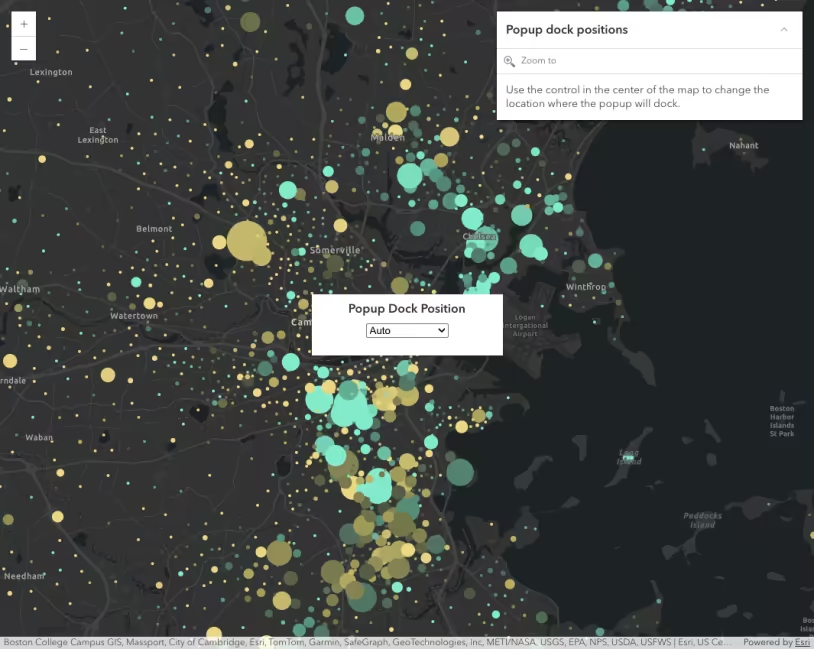
Popup dock positions
Popup with DOM node
Popup with edit action
PopupTemplate - use functions to set content
PopupTemplate with promise
Property changes with reactiveUtils
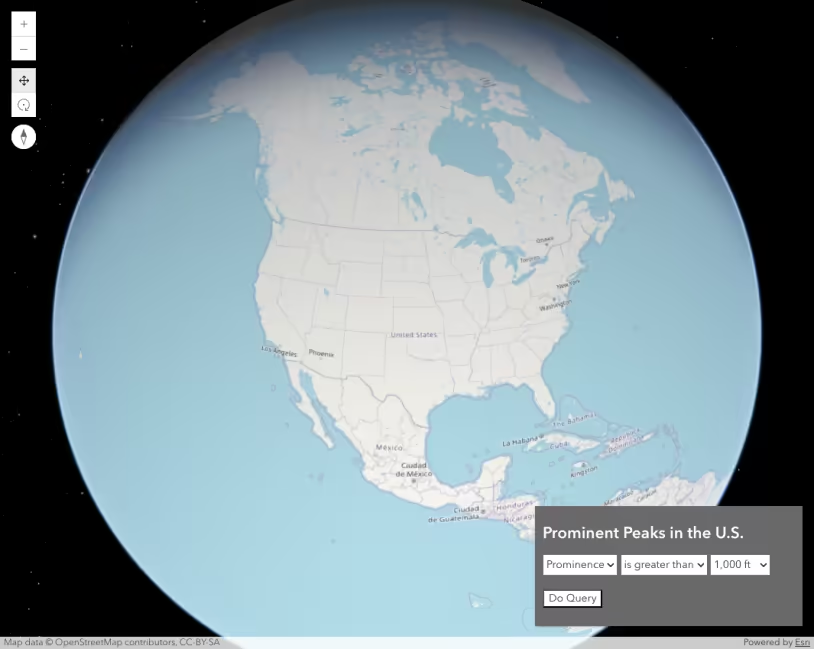
Query
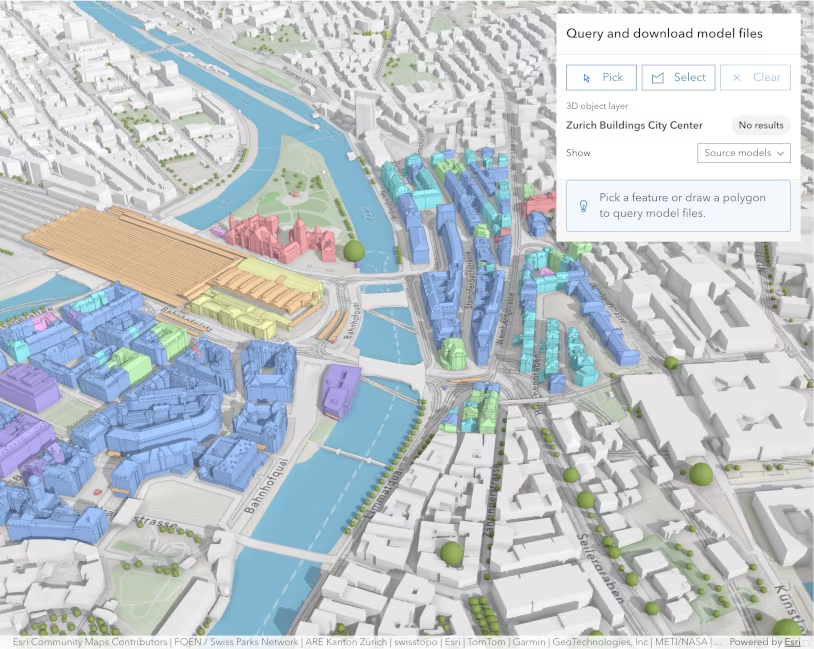
Query 3D models
Query Attachments
Query client-side 3D extents
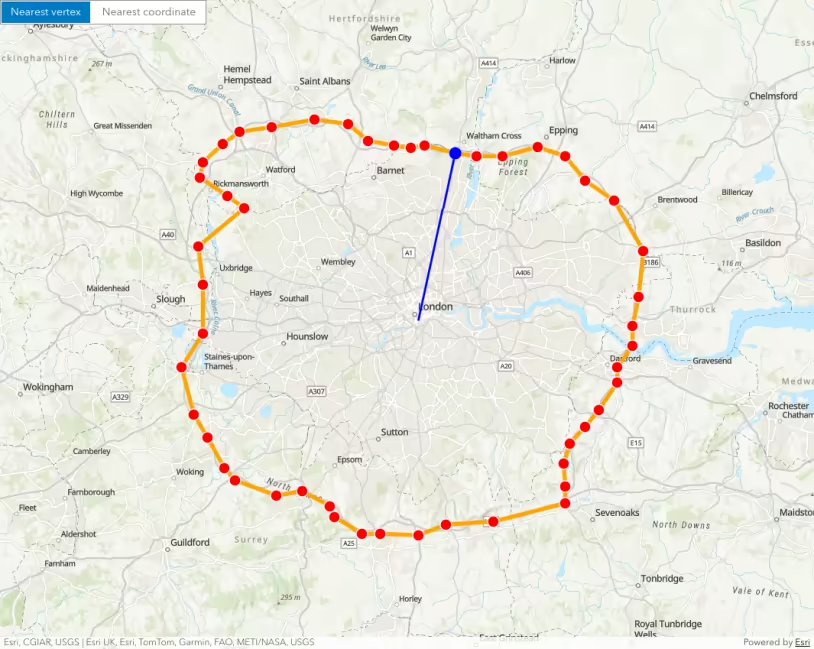
Query Elevation (lines)
Query Elevation (points)
Query FeatureLayer
Query features from a FeatureLayerView
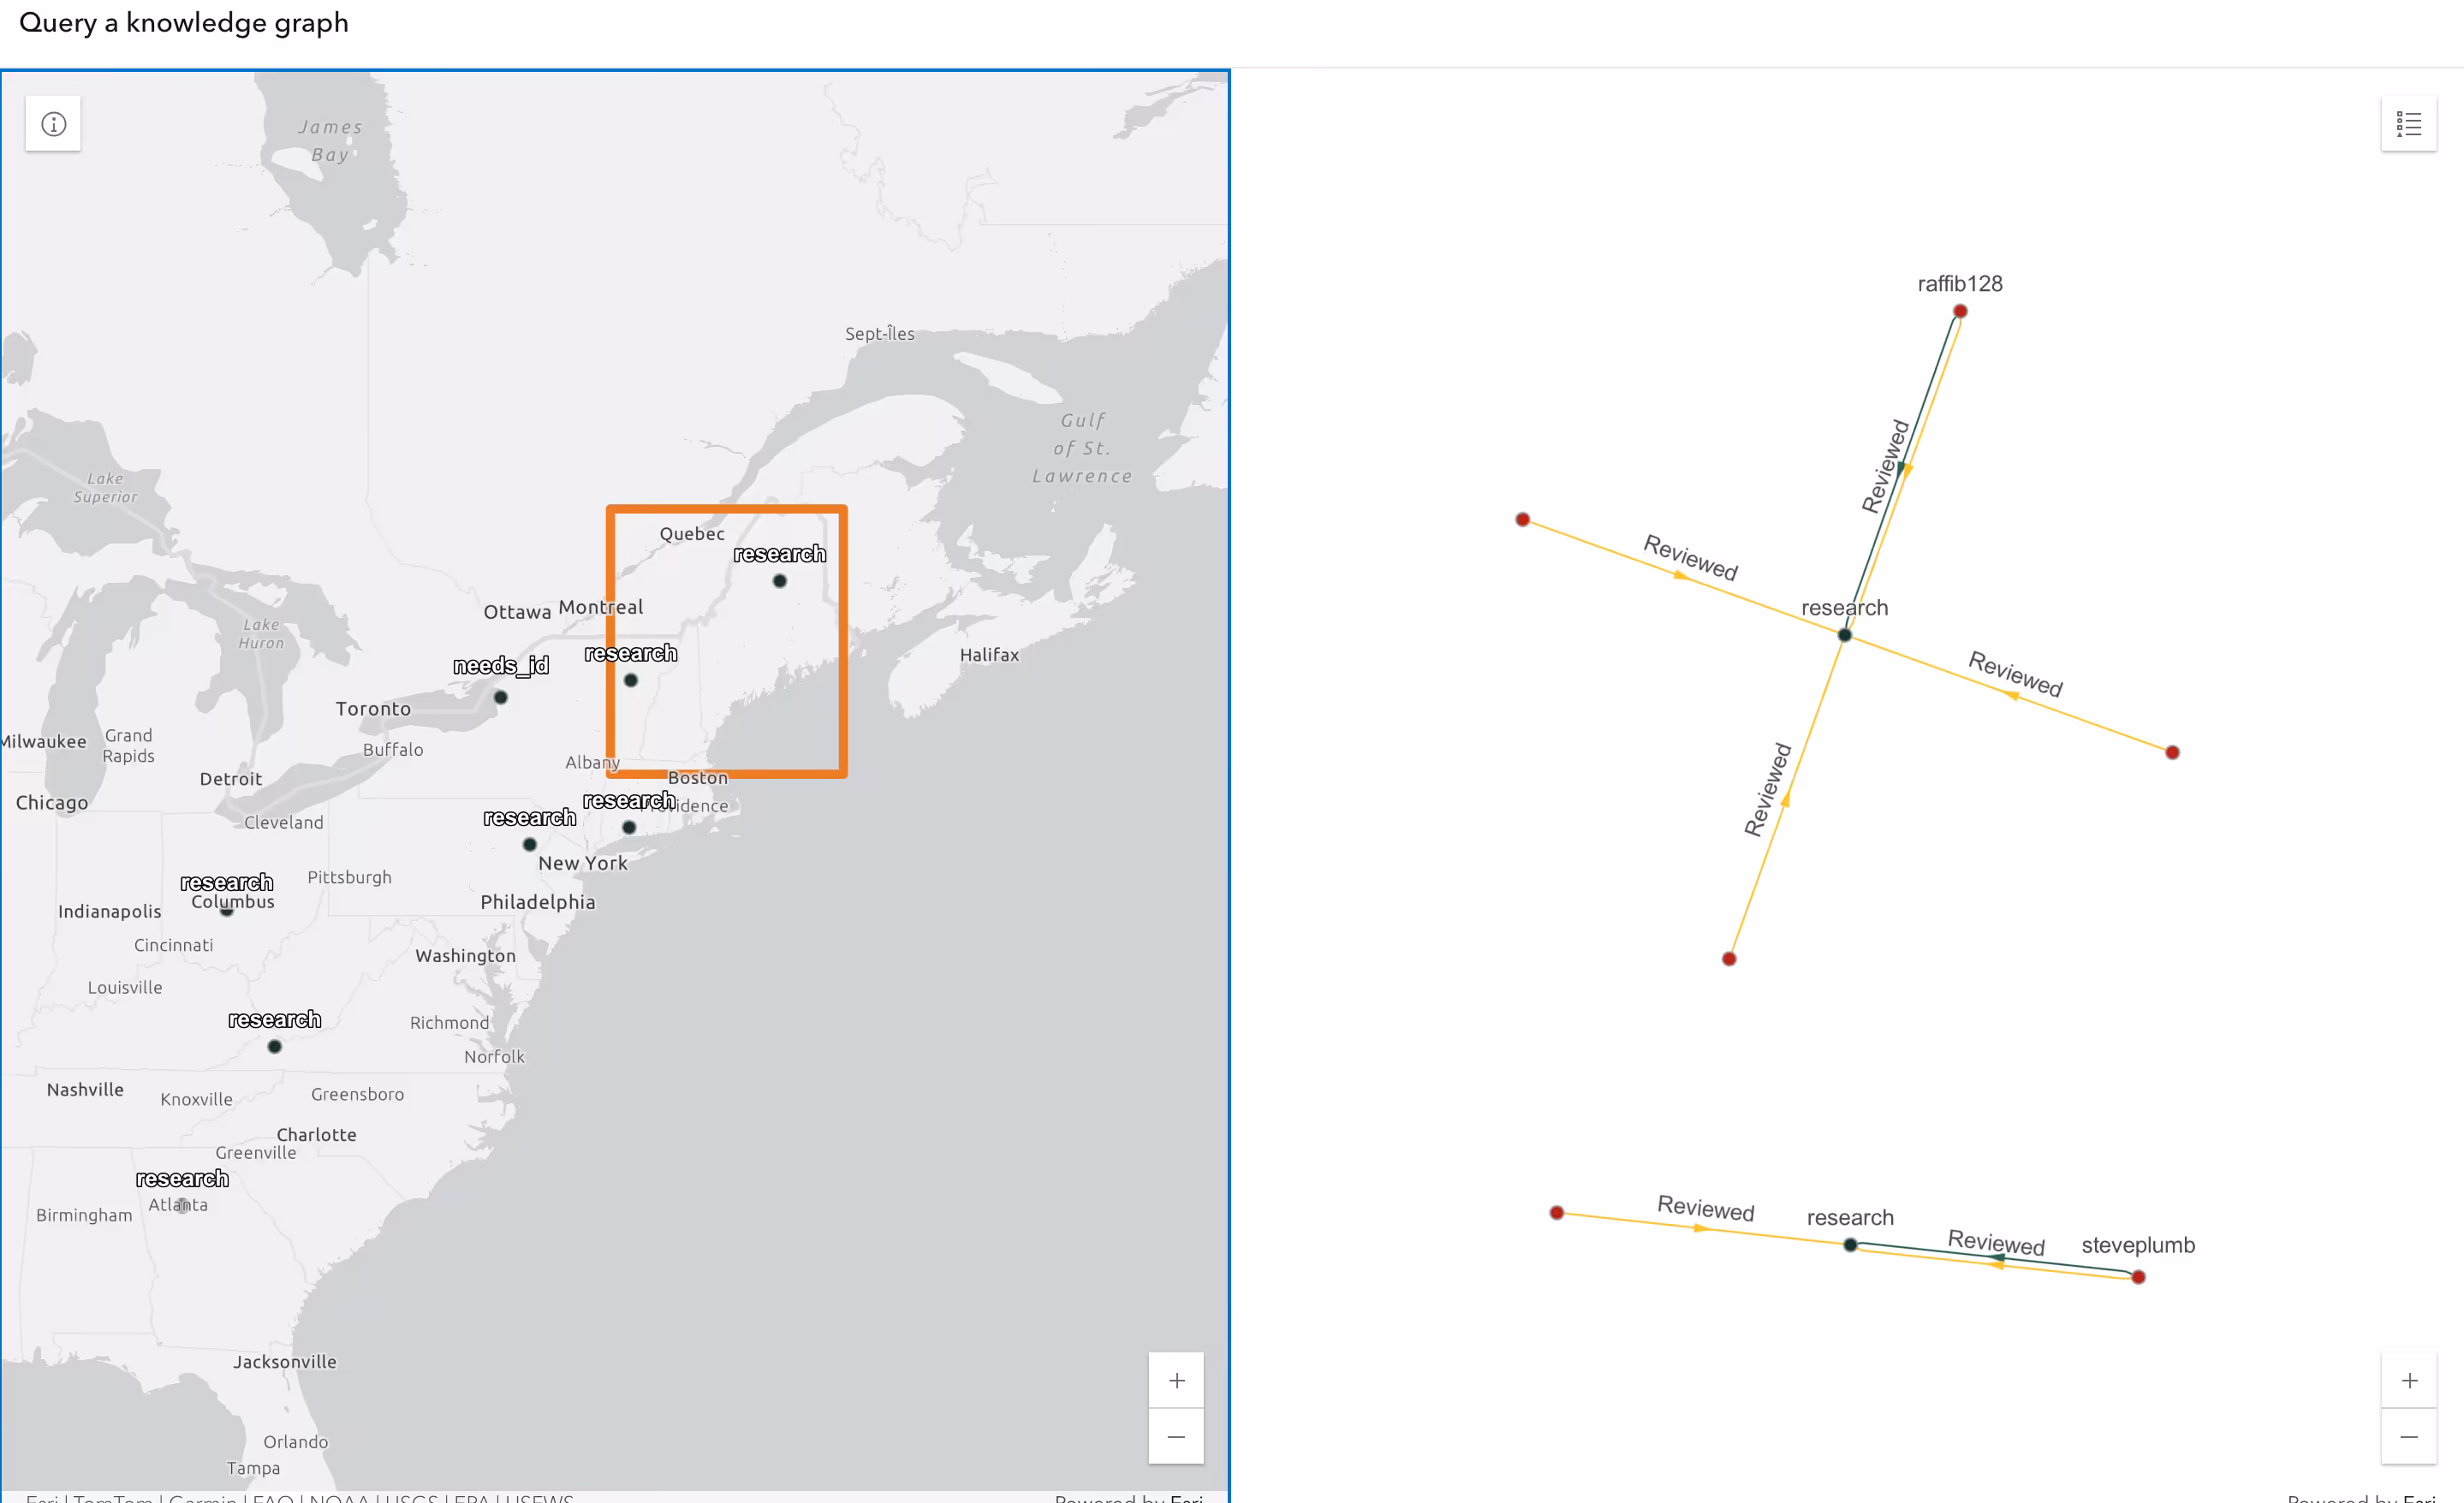
Query Knowledge Graphs
Query portal items using OAuth 2.0
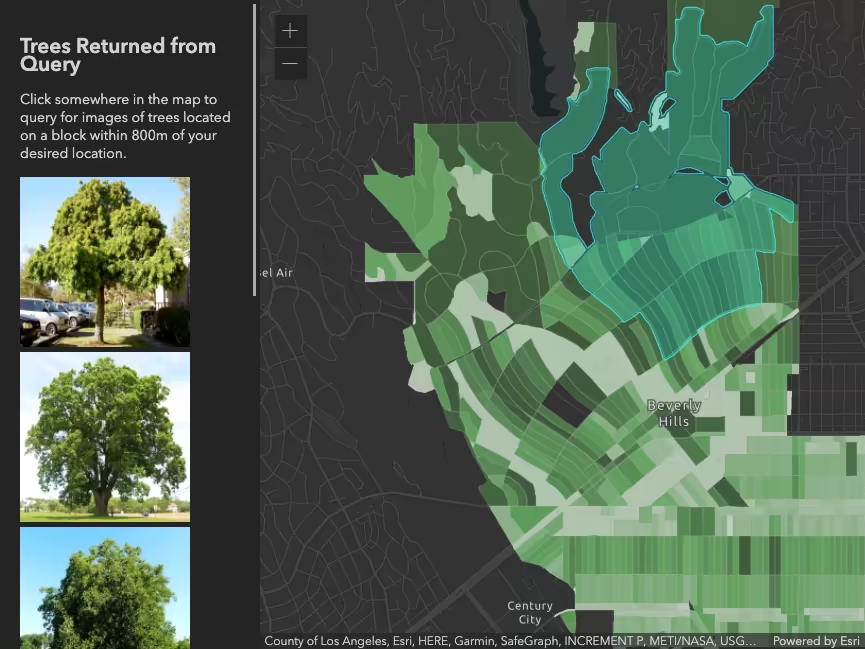
Query Related Features
Query statistics client-side by distance
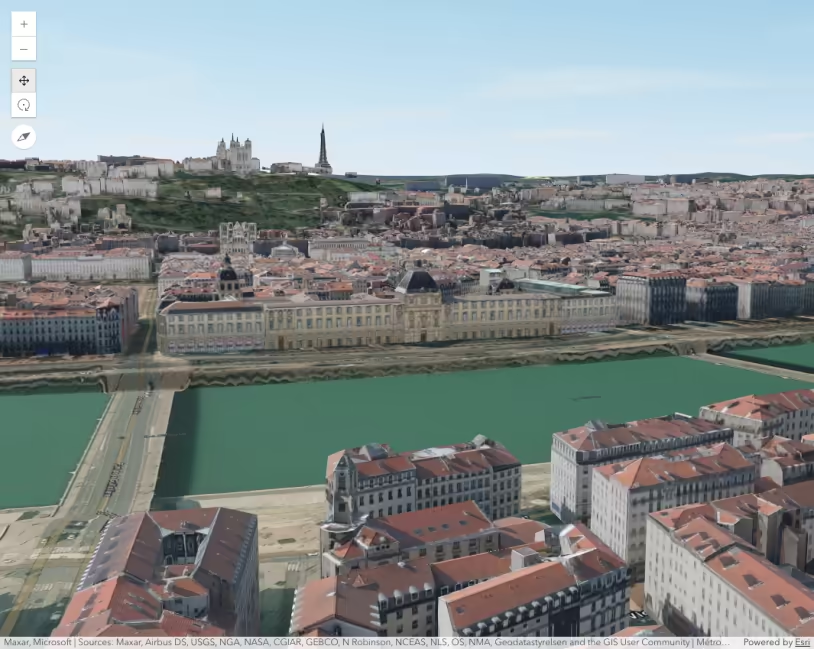
Realistic buildings with SceneLayer
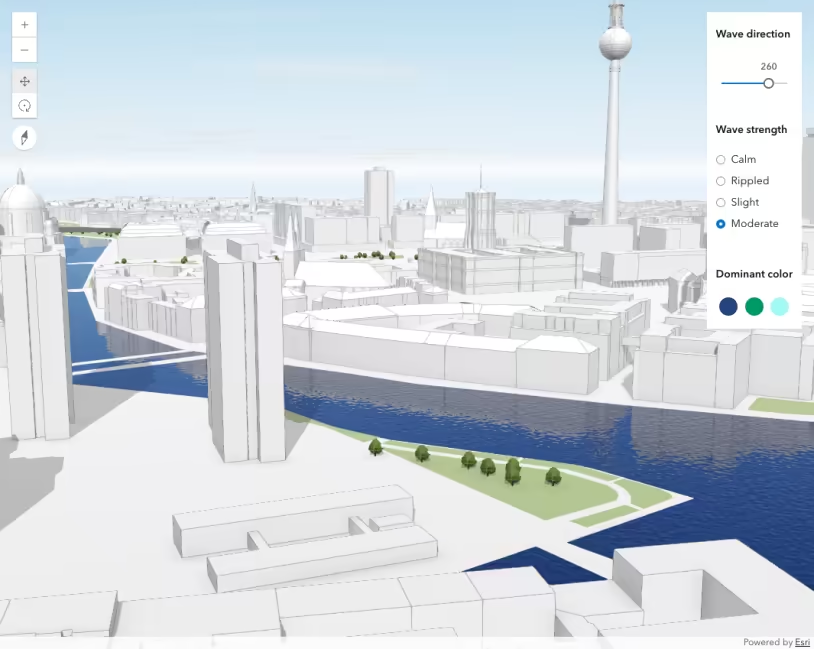
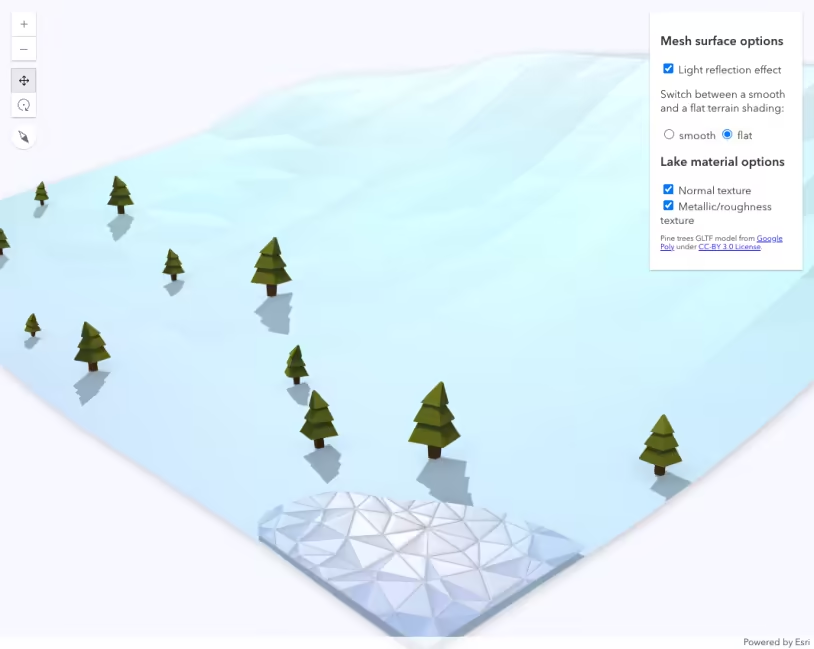
Realistic water visualization in 3D
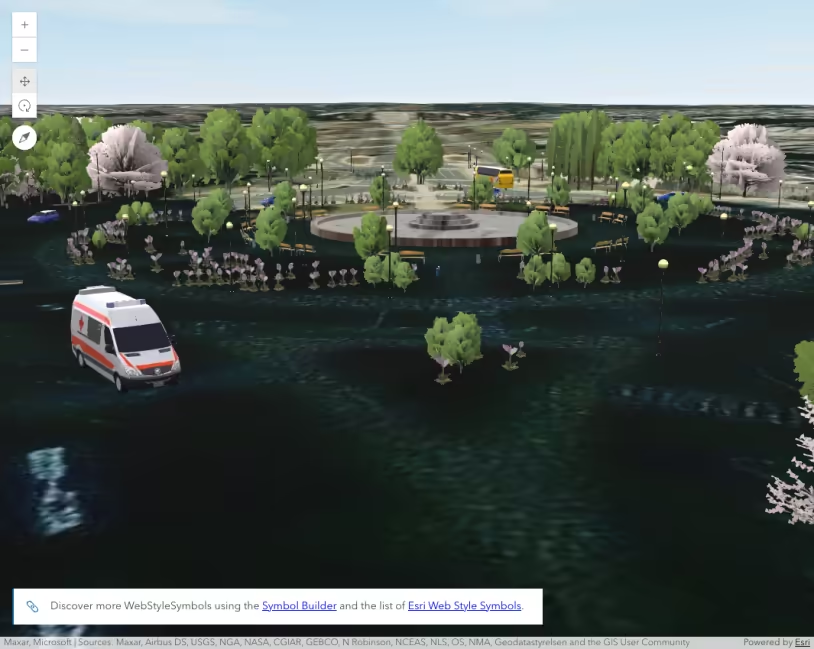
Realistic WebStyleSymbols
Reference Arcade expressions in PopupTemplate
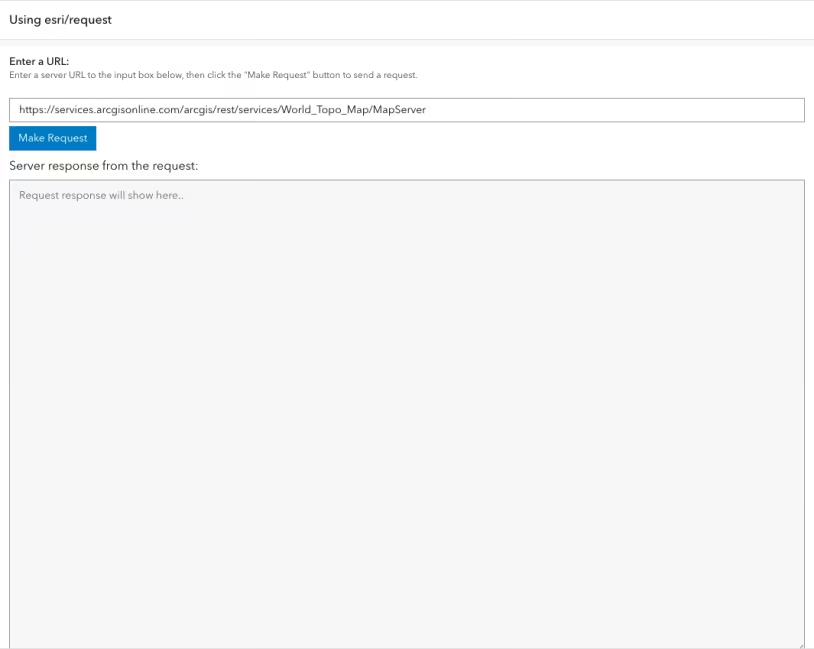
Request data from a remote server
Responsive apps using CSS
Route with animated lines
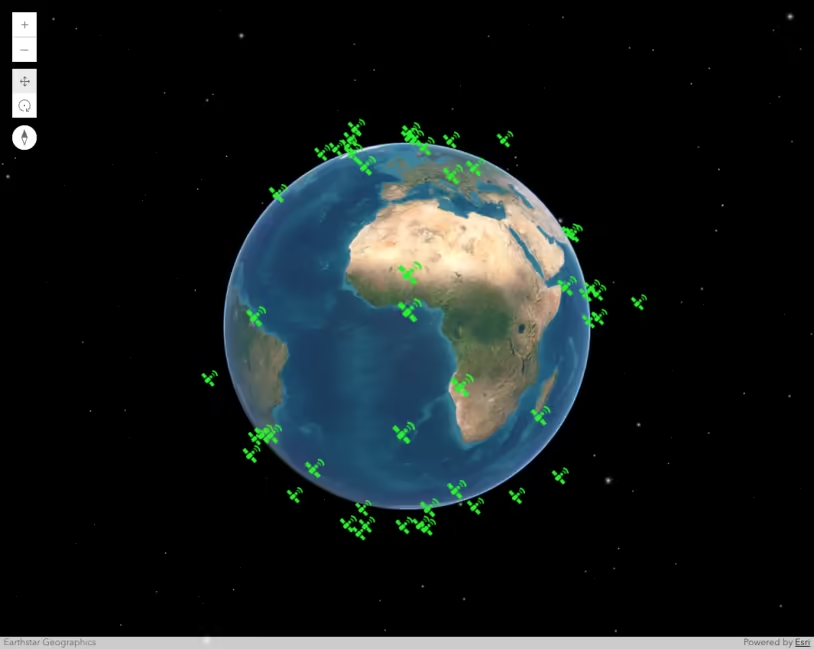
Satellites in 3D view
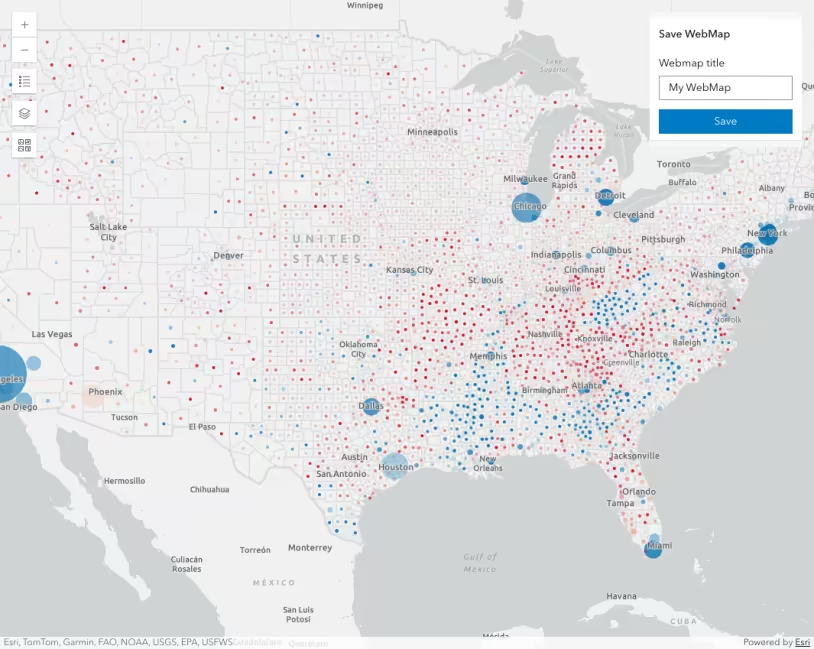
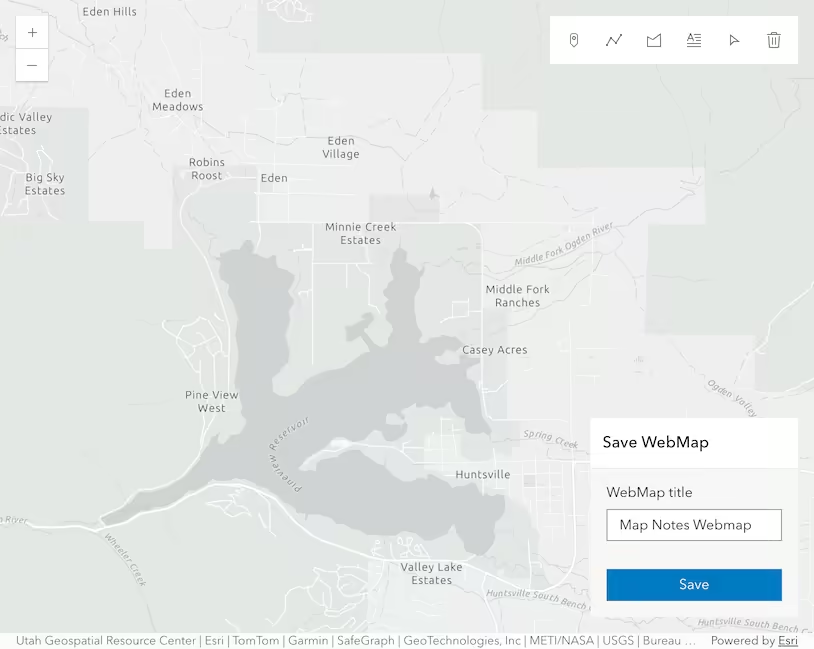
Save a web map
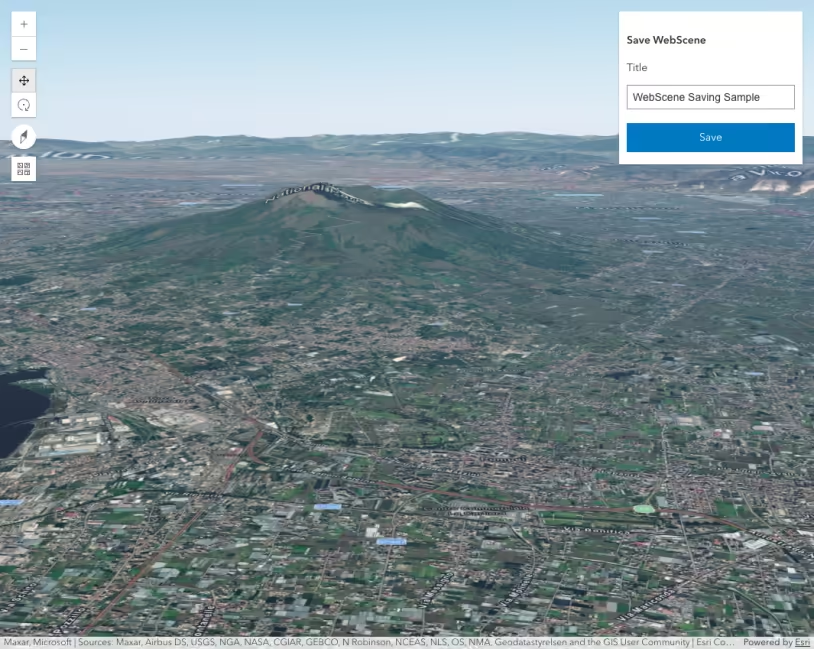
Save a web scene
Scale feature sizes based on real world sizes (2D)
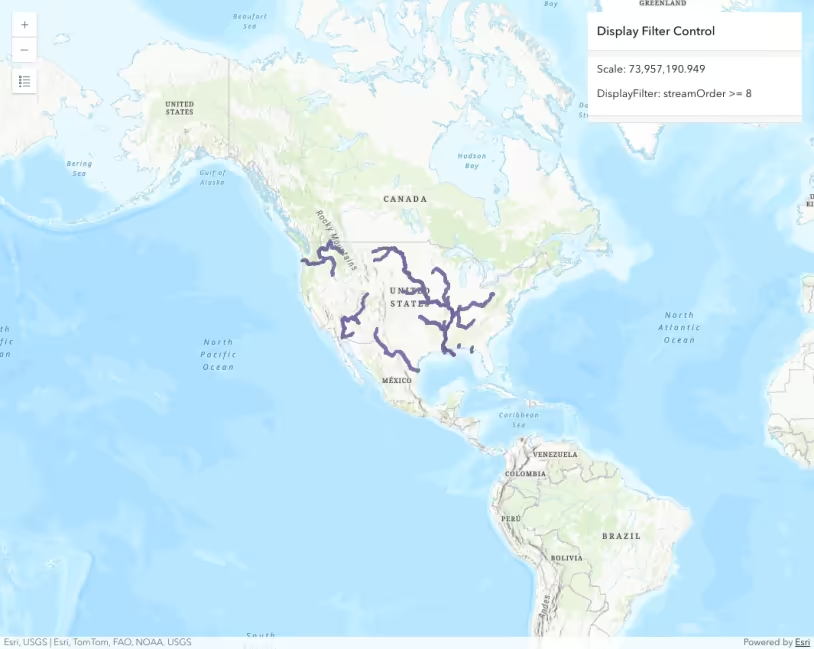
Scale-dependent DisplayFilter
Scene - follow mode
Scene - goTo()
Scene - hitTest
Scene - shadow and lighting settings
Scene Layer with point geometries
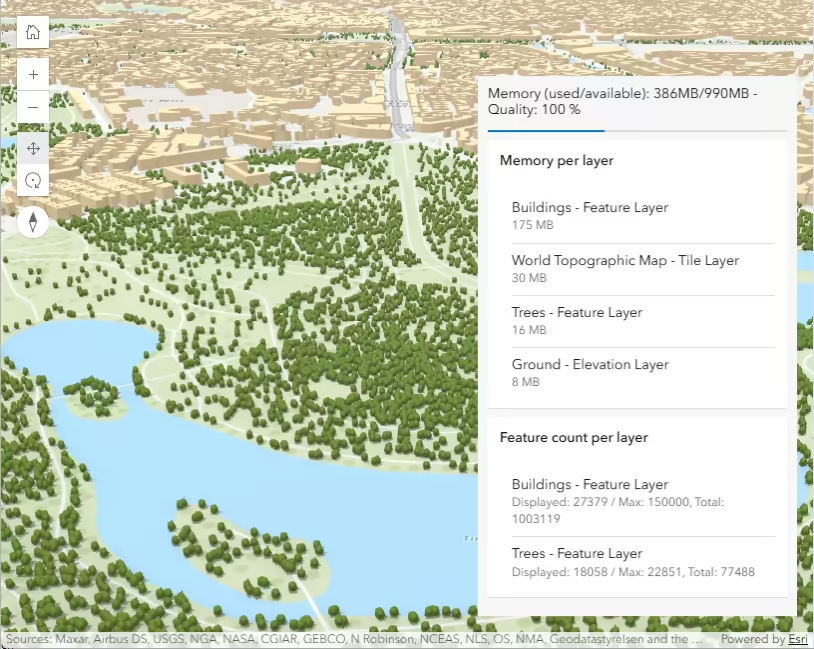
Scene memory resources
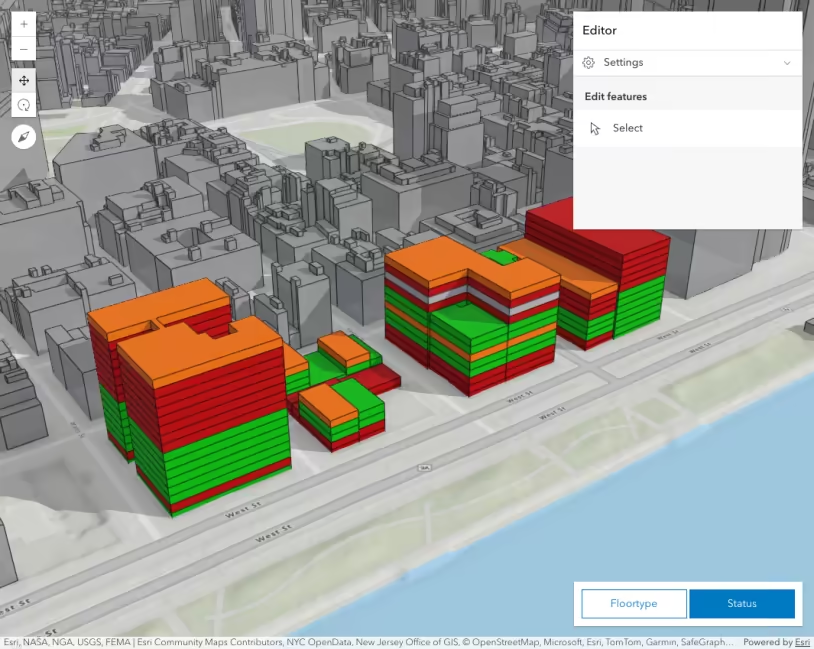
SceneLayer attribute editing
SceneLayer attribute editing (Editor widget)
SceneLayer filter and query
SceneLayer upload 3D models and applyEdits
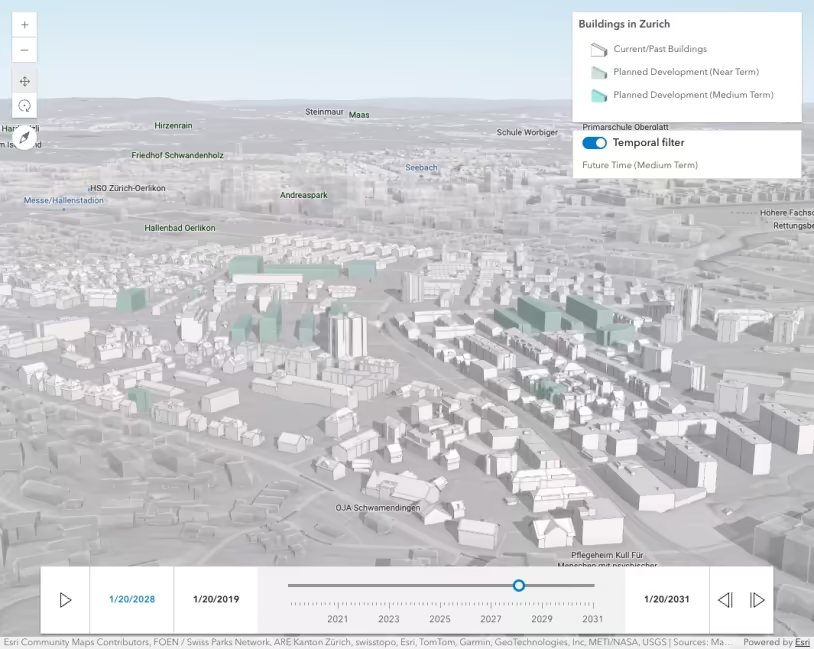
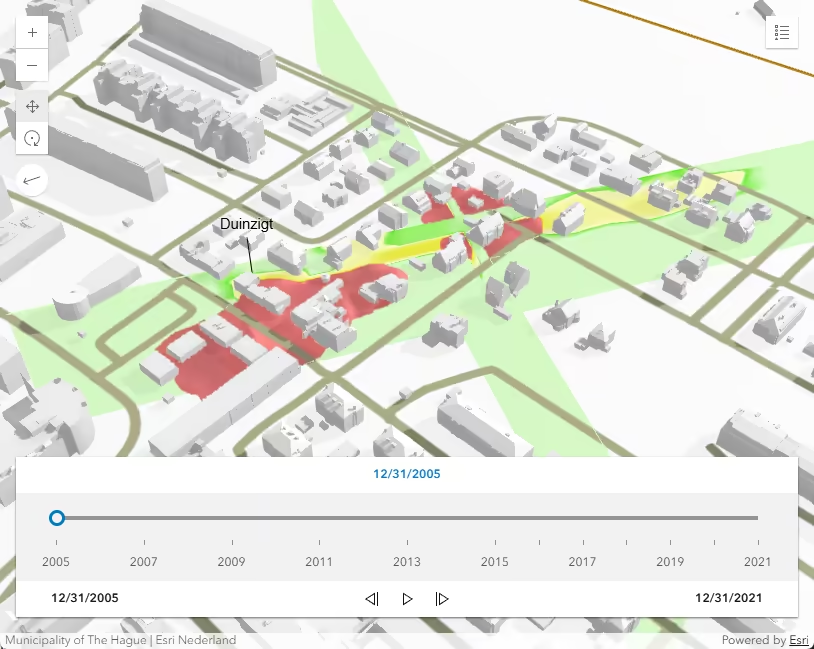
SceneLayer with time filter
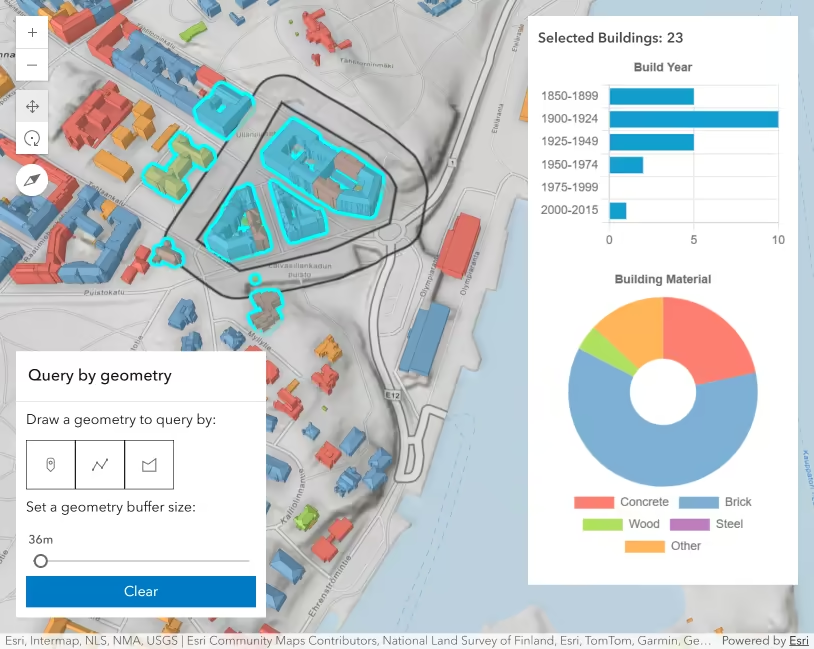
SceneLayerView - query statistics by geometry
Search component with custom source
Search component with multiple sources
Search Knowledge Graphs
Secure webmap with OAuth 2.0
Select features by rectangle
Select WMTSLayer sublayer

Shadow cast
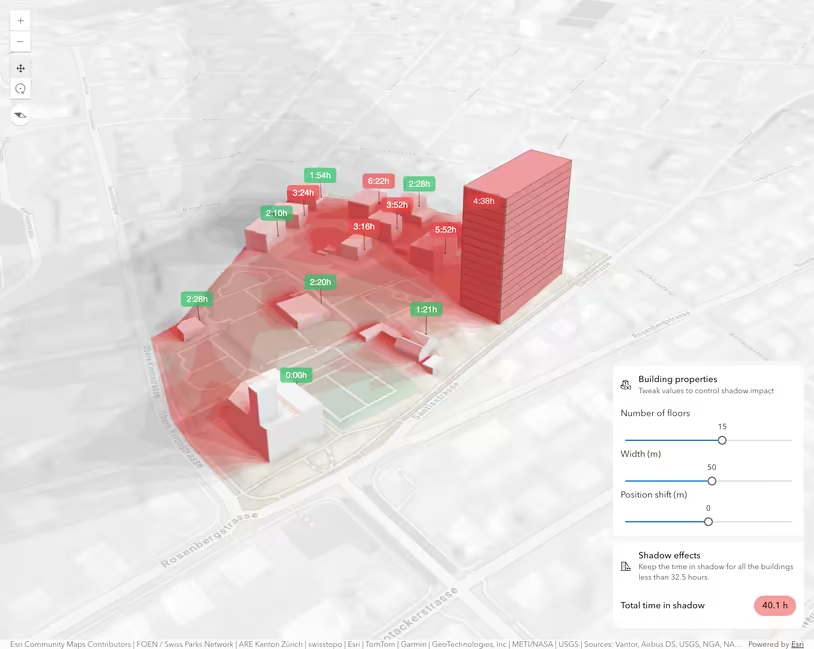
Shadow cast analysis object
Shadow Cast component
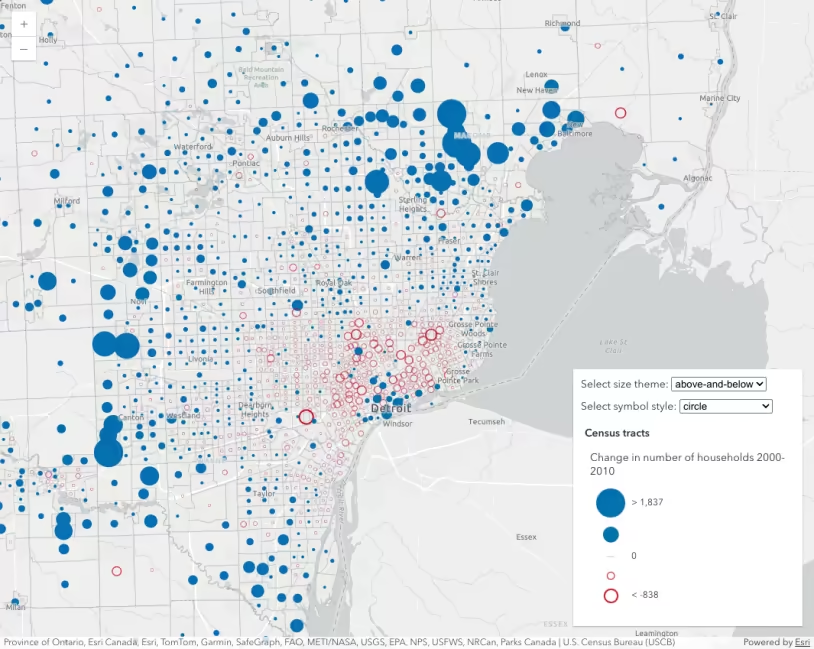
Size visual variable themes
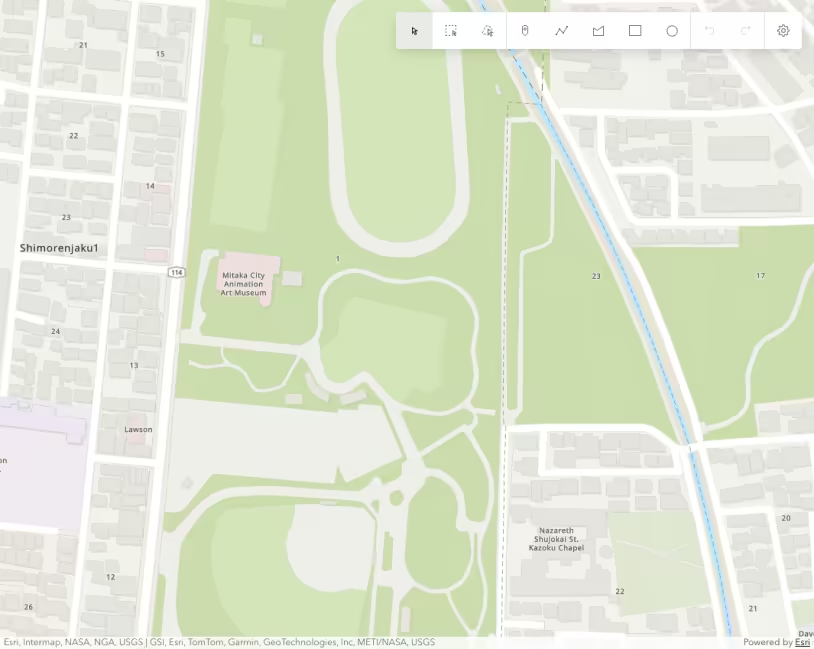
Sketch component
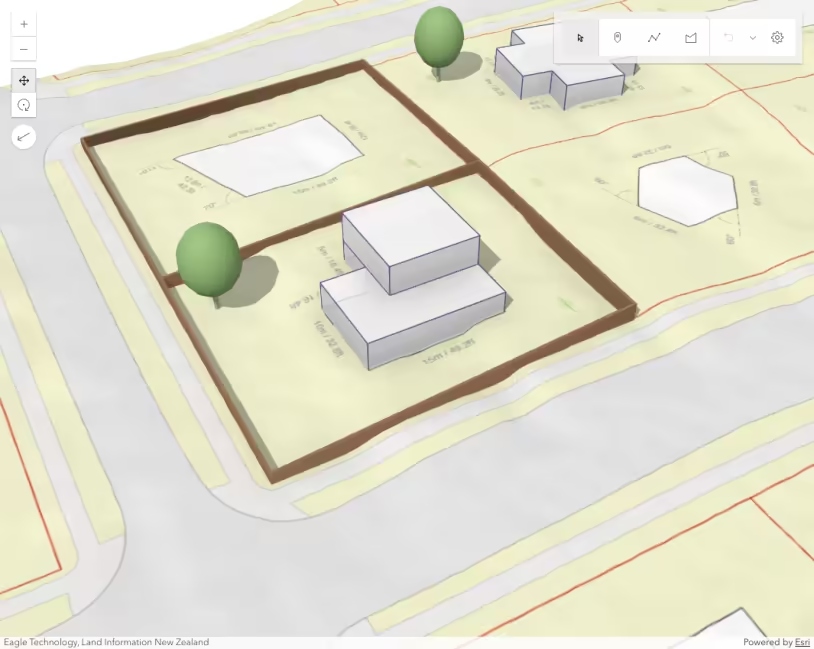
Sketch in 3D
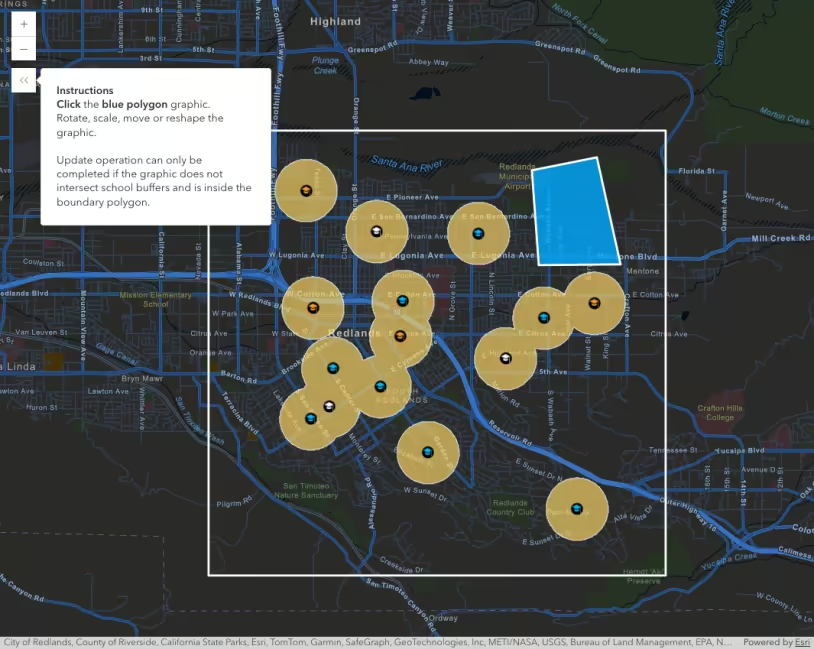
Sketch update validation
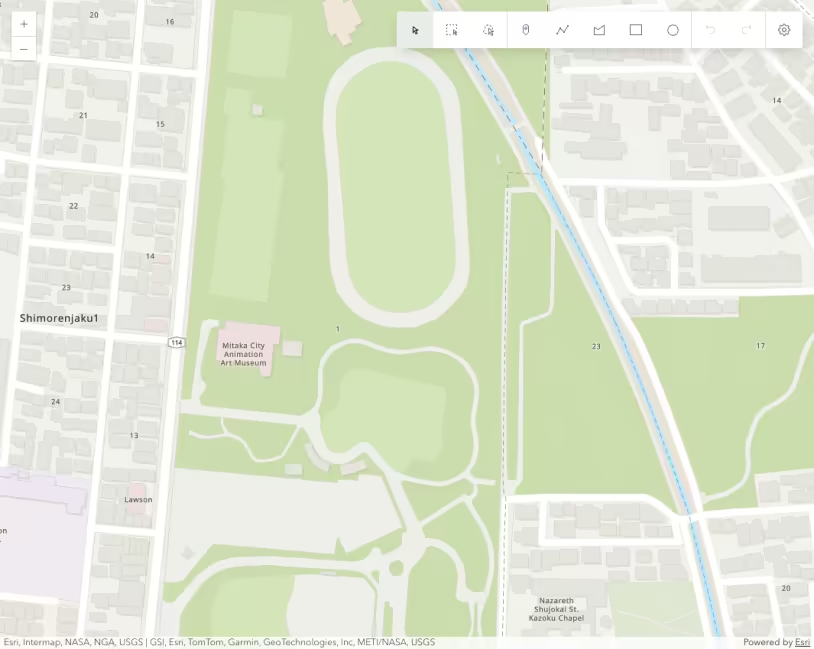
Sketch widget
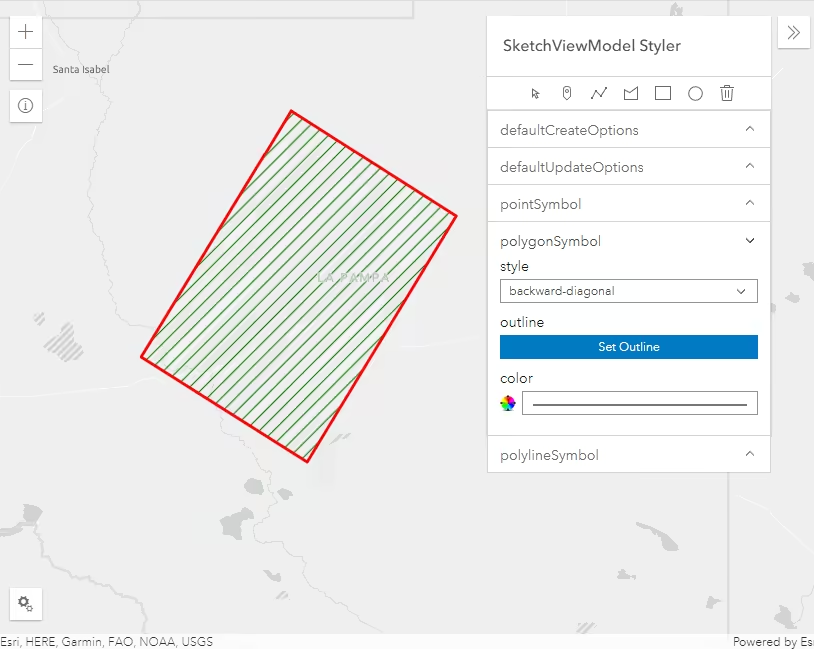
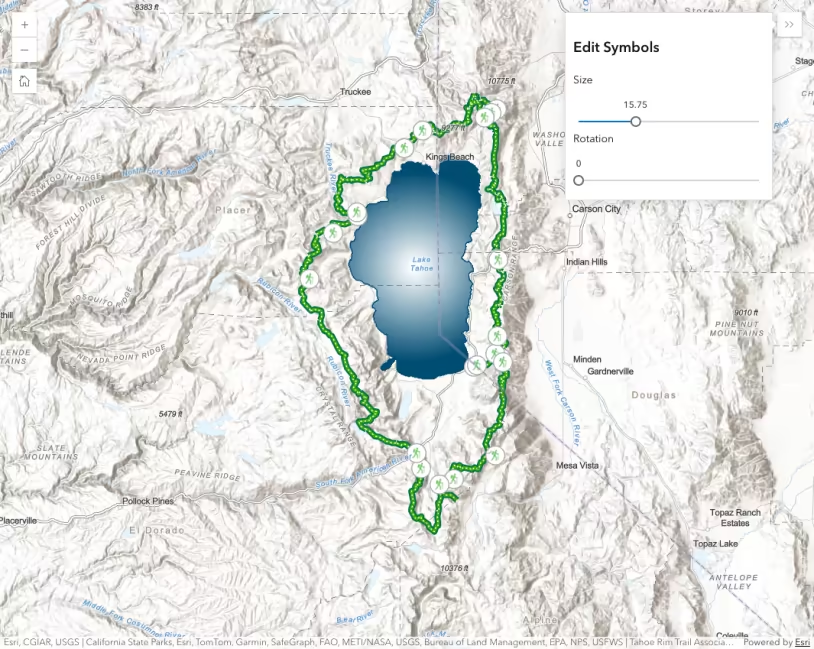
SketchViewModel Styler
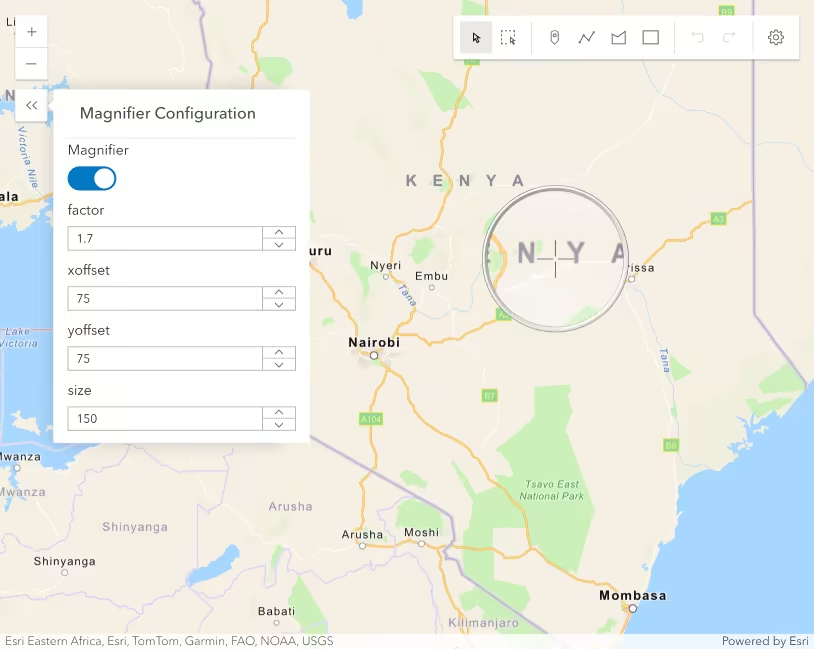
Snapping with Sketch widget and Magnifier
Sort features by legend order
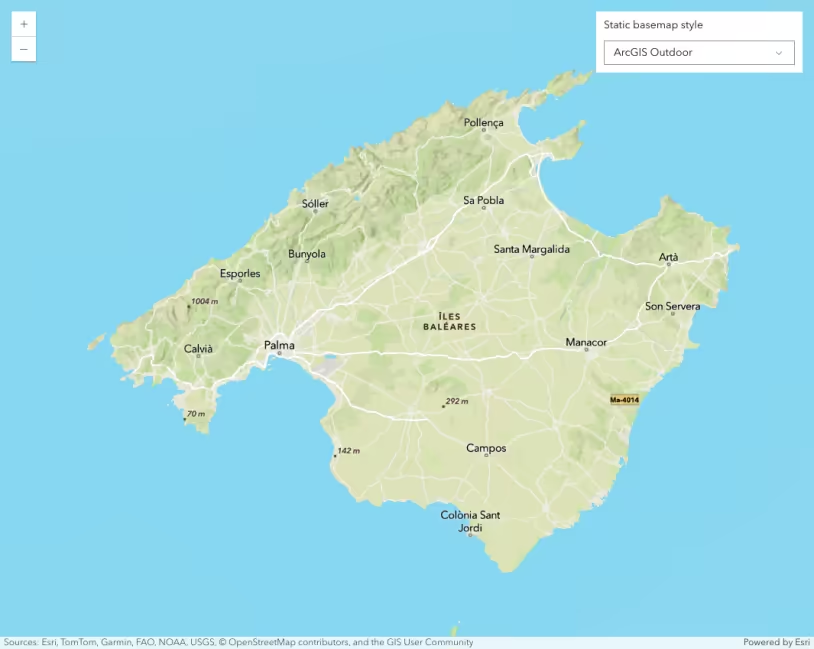
Static basemap tiles
StreamLayer
Summarize binned data using Arcade
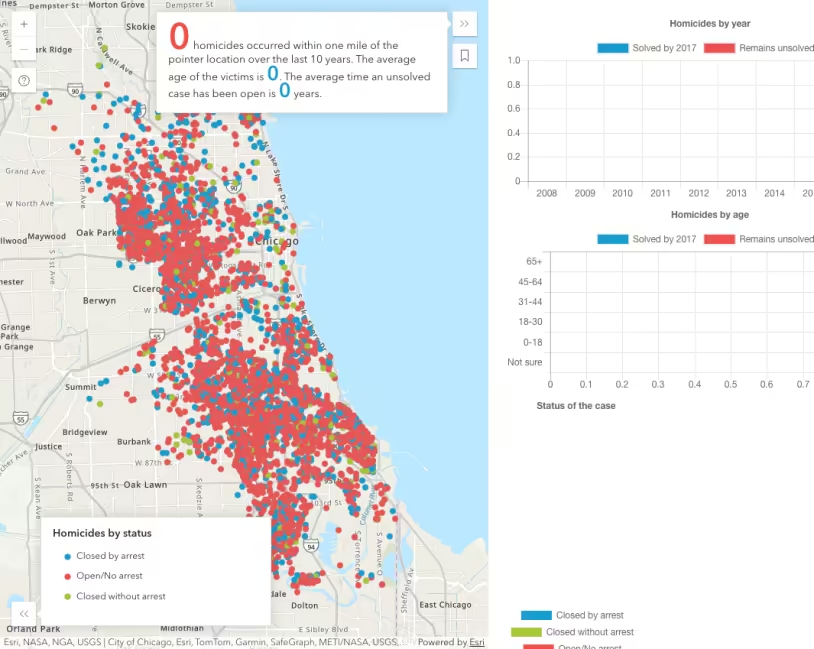
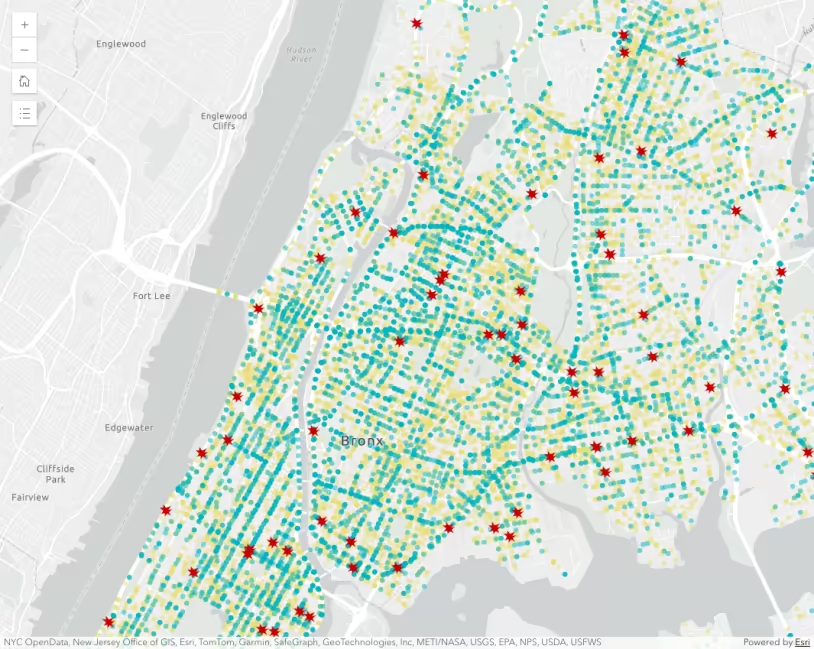
Summarize intersecting points in a popup
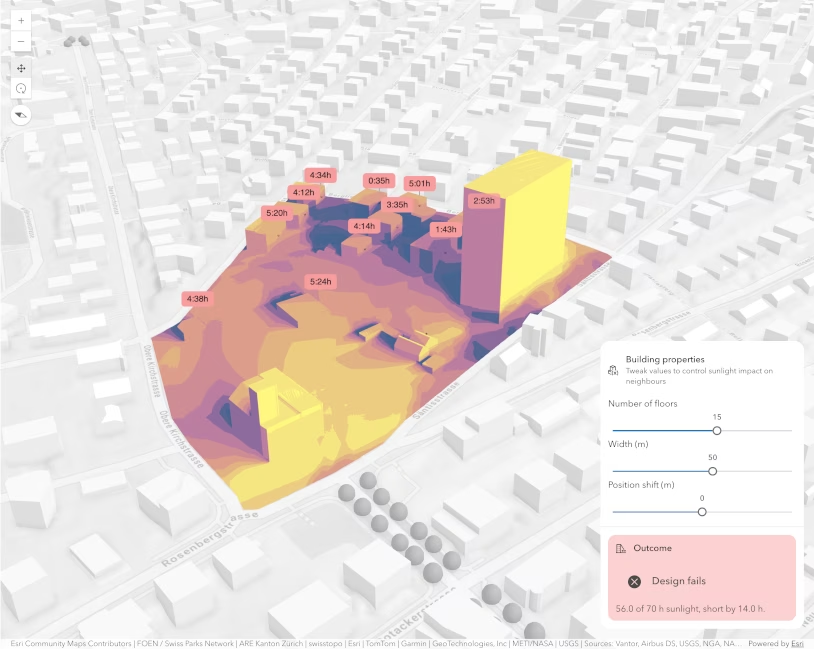
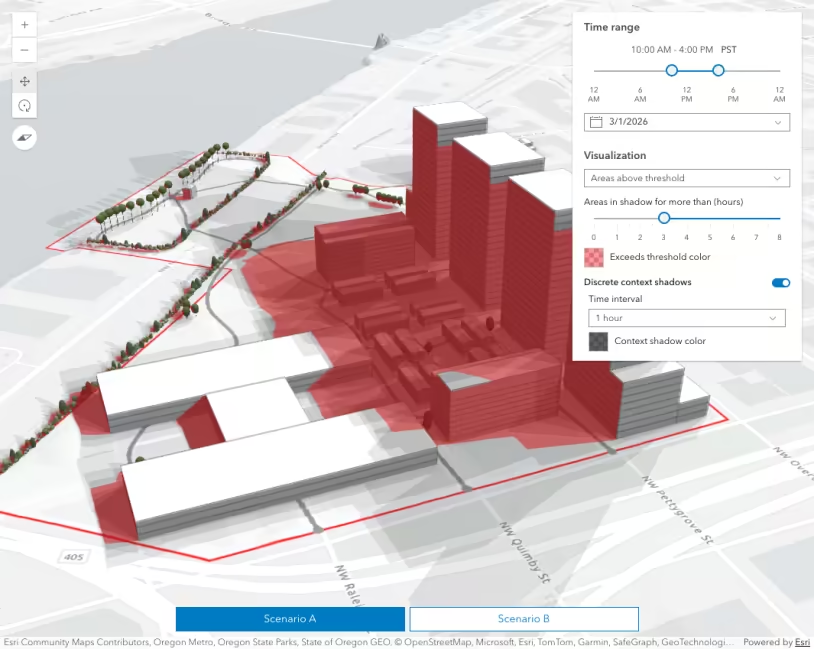
Sunlight analysis
Swap web maps in the same view
Swipe component
Swipe component with scroll
Switch view from 2D to 3D
Synchronize FeatureTable highlights and selection
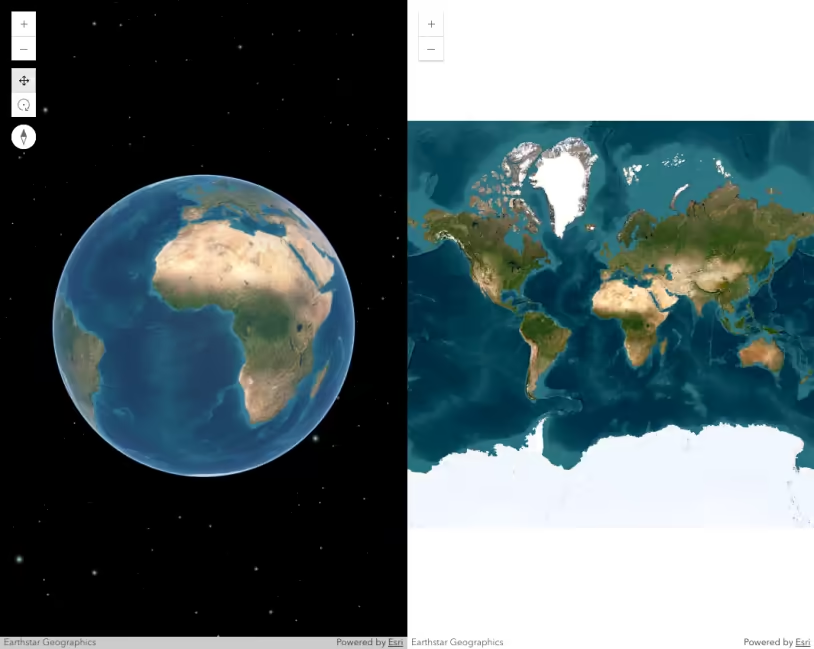
Synchronize Map and Scene component views
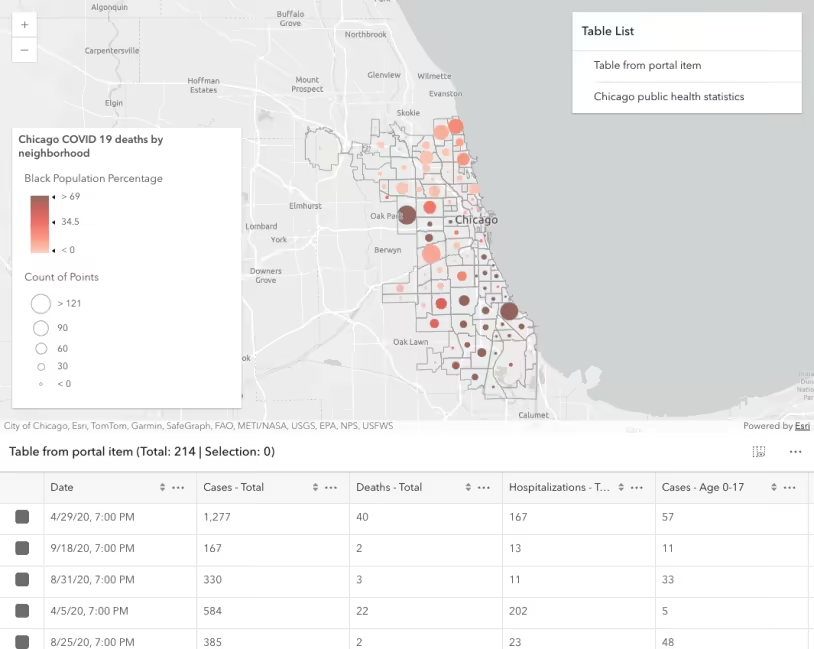
TableList component
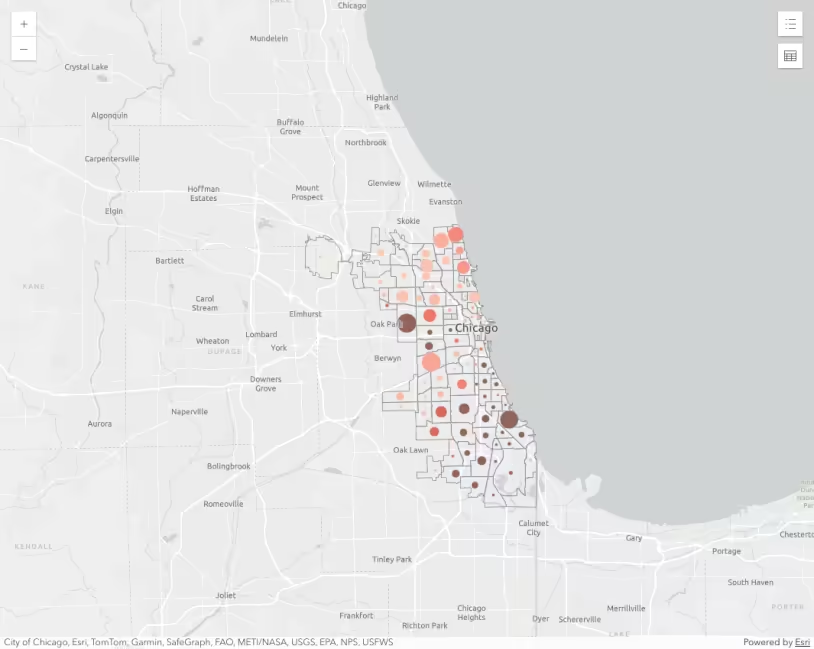
TableList widget
Take a screenshot of a Scene
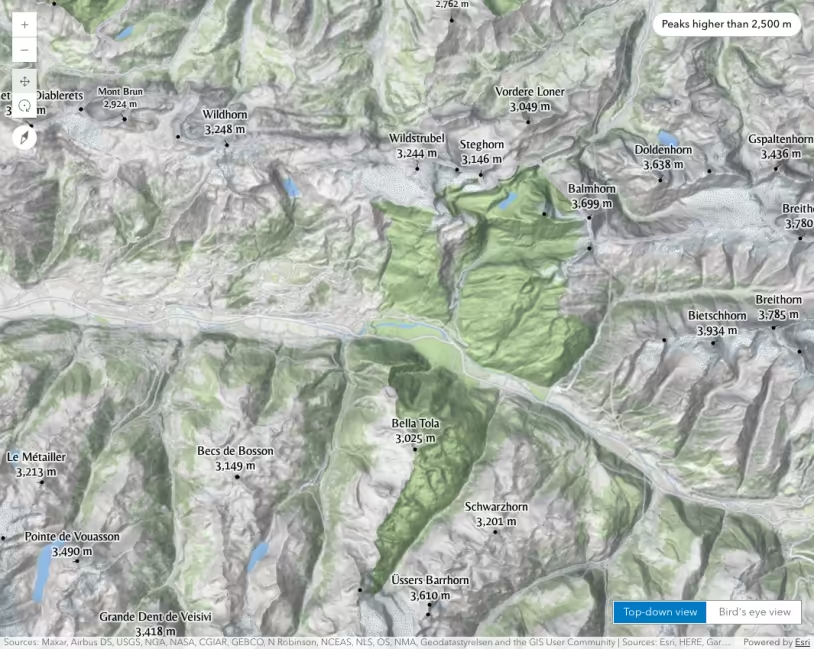
Terrain analysis with raster functions
Tessellation helpers for custom WebGL layer views
Thematic multivariate visualization (2D)
Thematic multivariate visualization (3D)
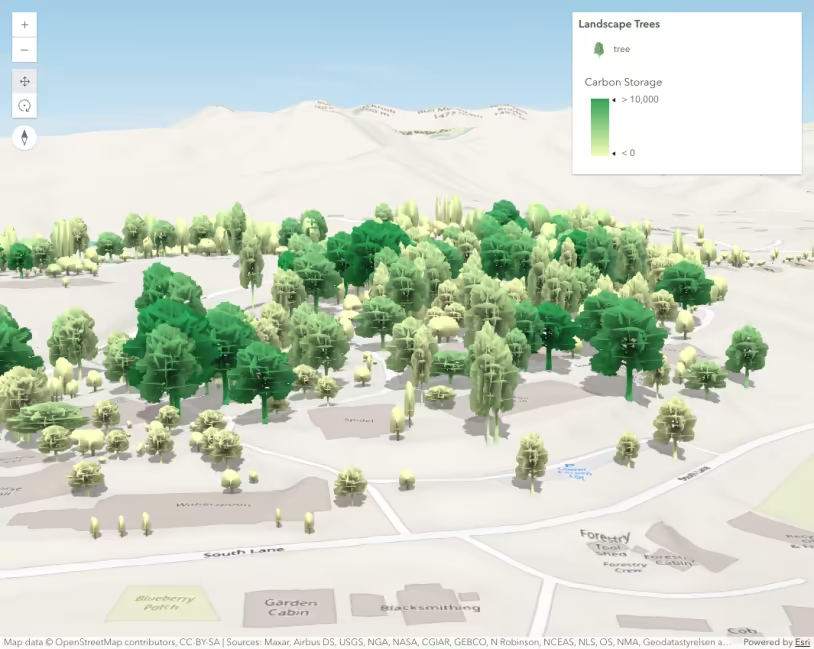
Thematic visualization with realistic 3D symbols
Tiling support for custom WebGL layer views
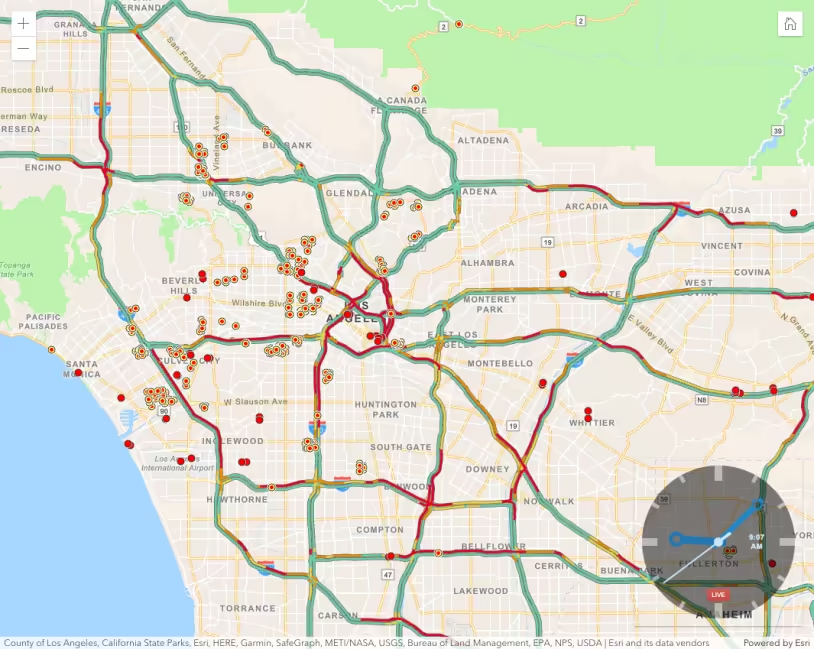
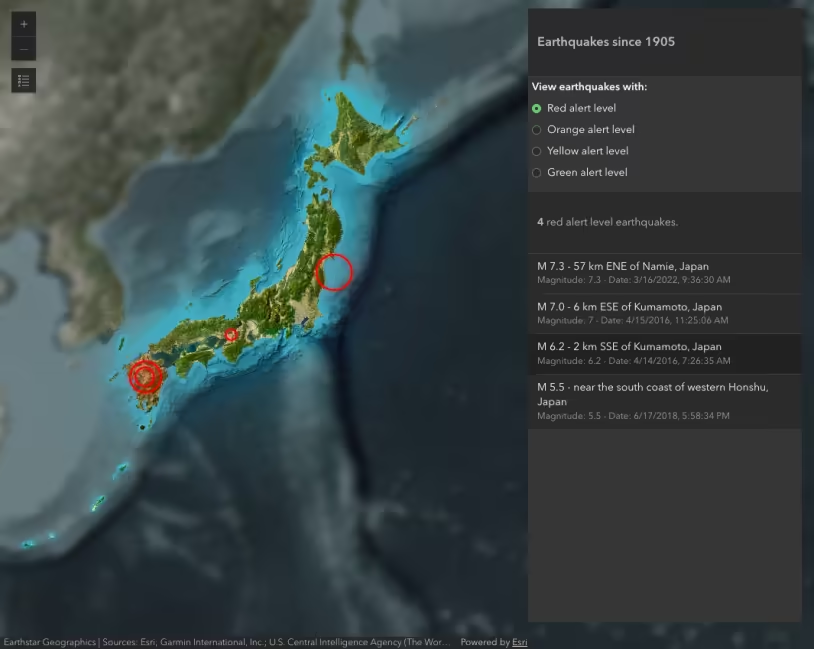
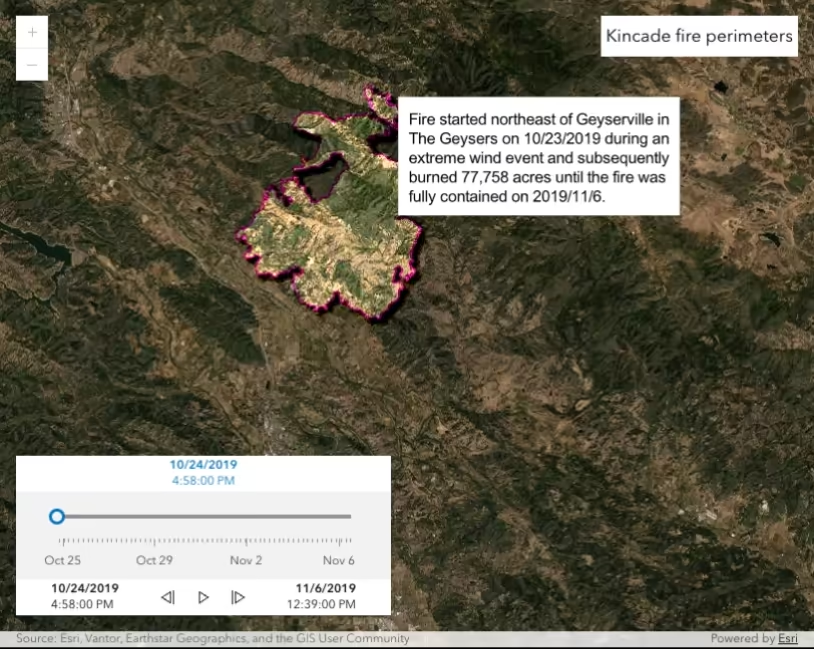
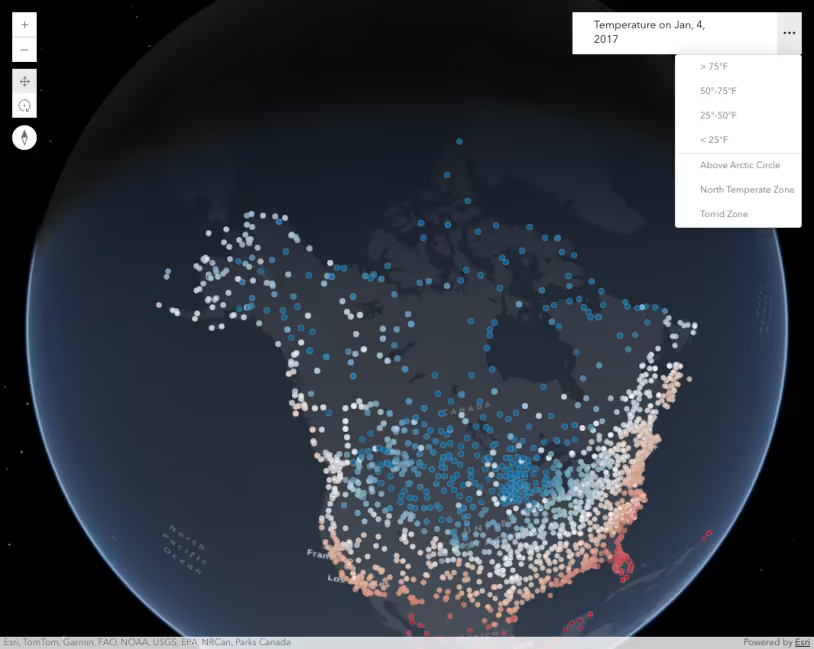
Time-based layer
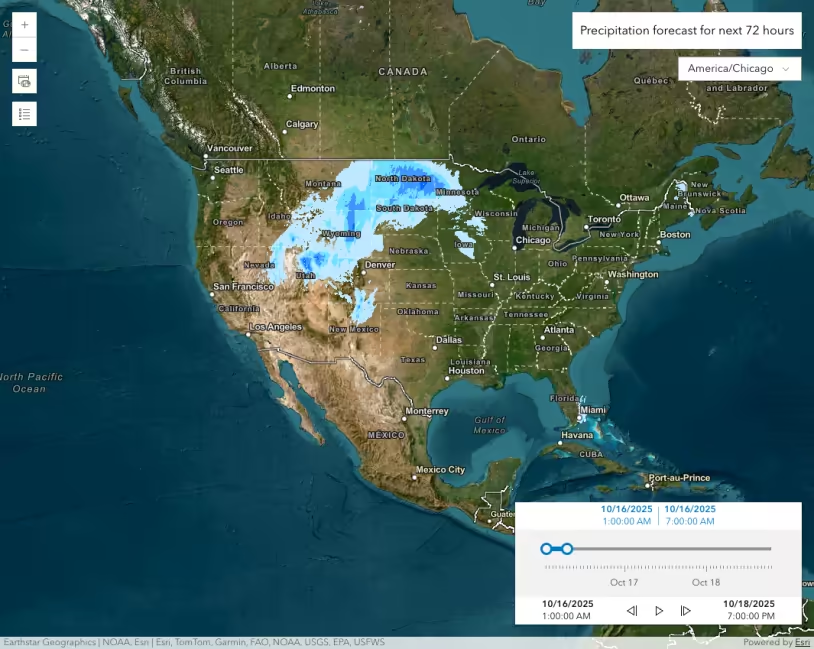
TimeSlider component
TimeSlider with timeOffset and actions
Timestamp-offset field
Toggle ground elevation
Transposed multidimensional ImageryTileLayer
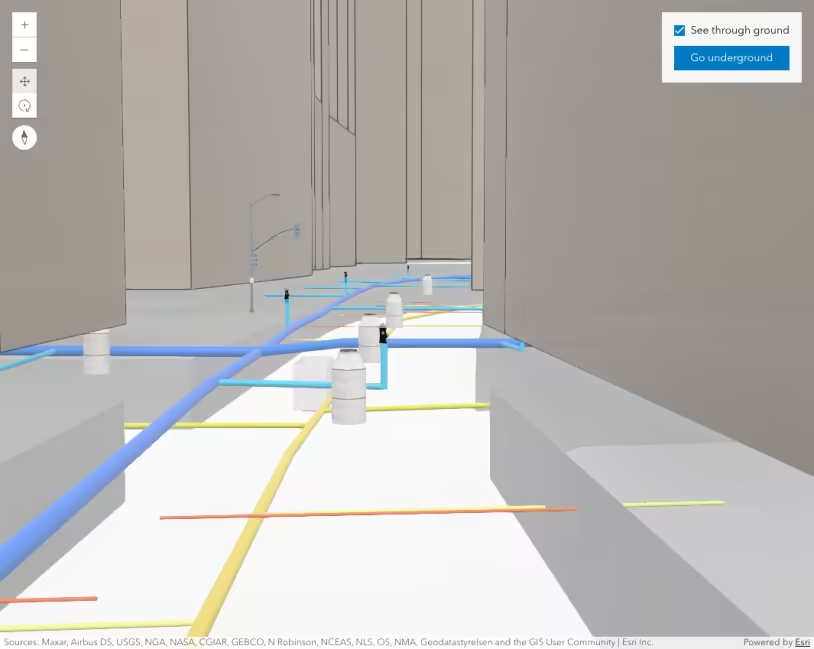
Underground navigation in global mode
Unique value groups with headings
Update a renderer's attribute
Update Feature Attributes
Update FeatureLayer using applyEdits()
Update legend text
Update the camera in a 3D view
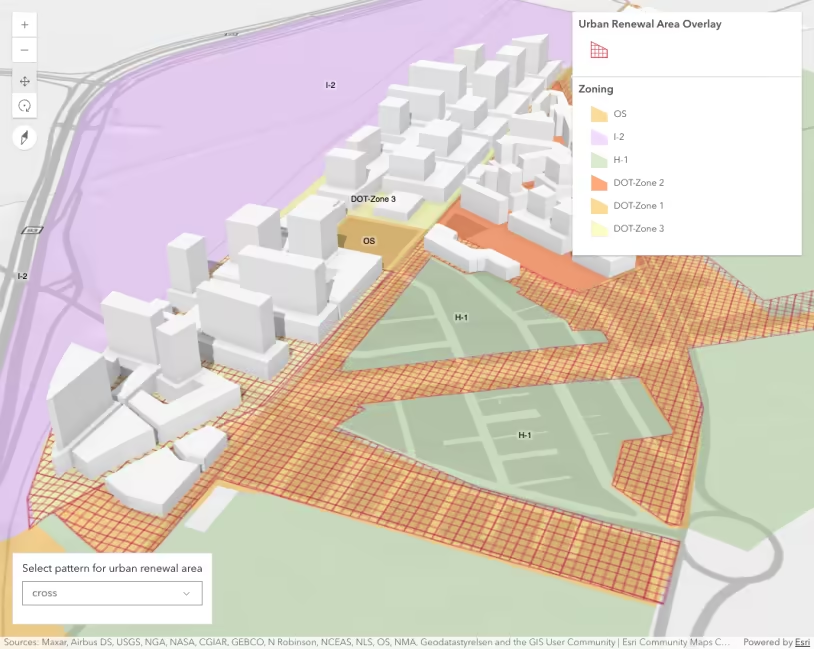
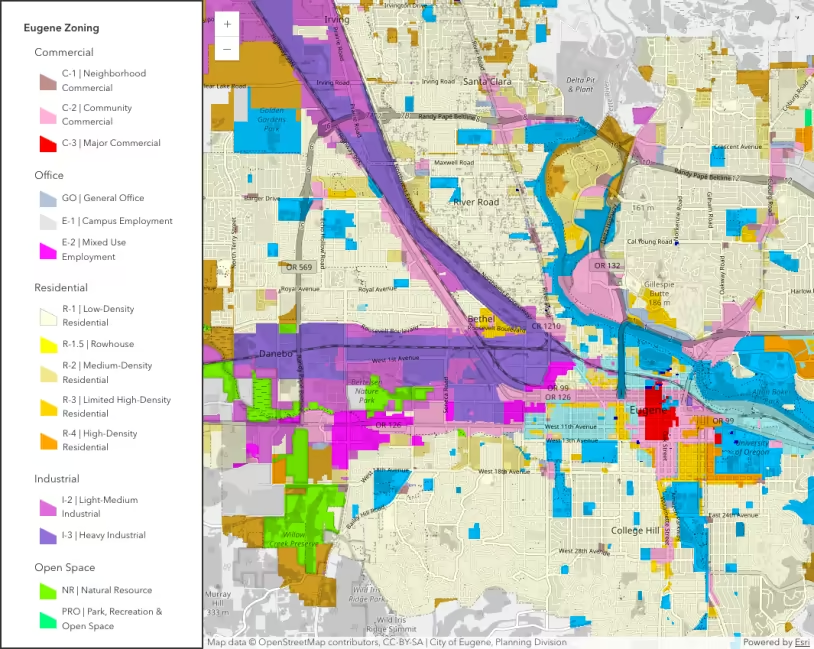
Urban visualizations with polygon patterns
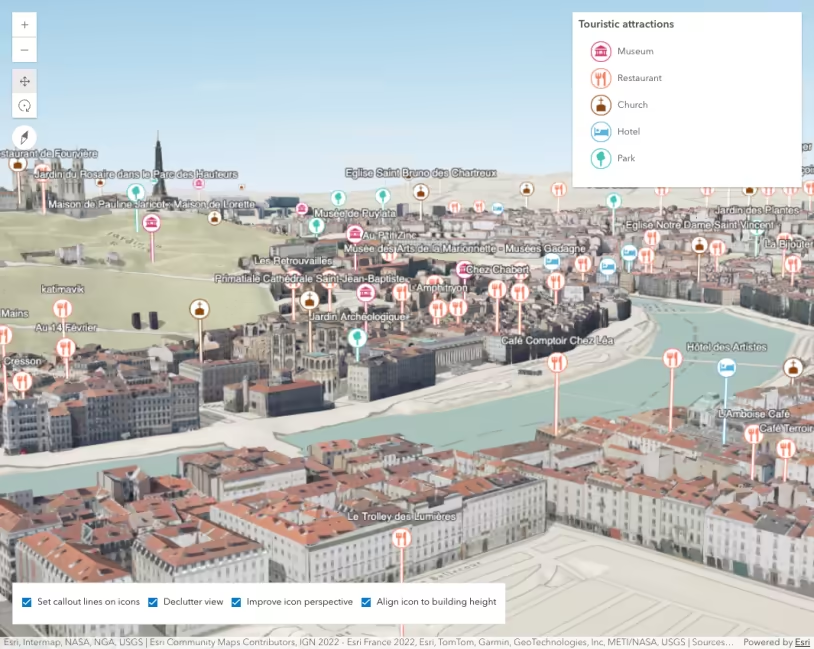
Using callout lines with labels
Using Esri Icon Fonts with map graphics
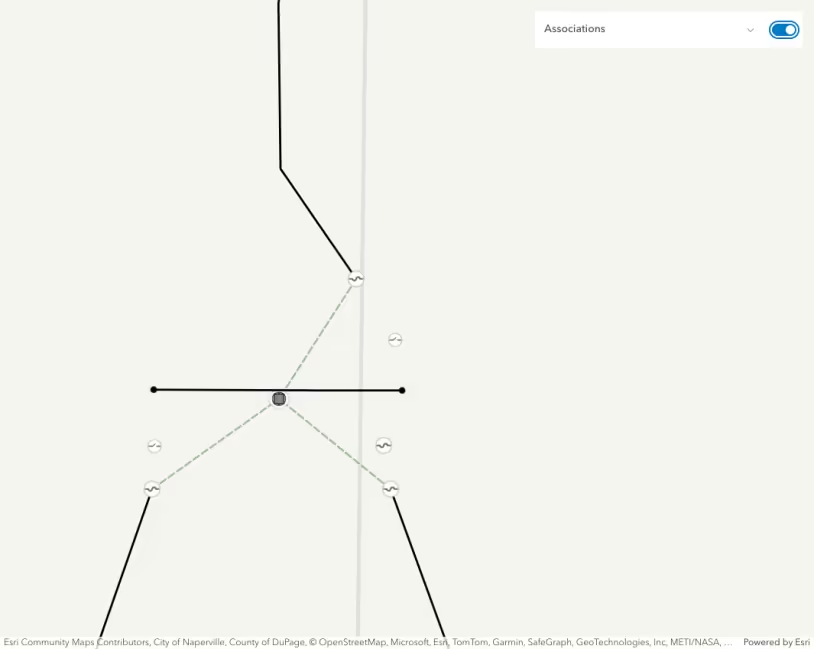
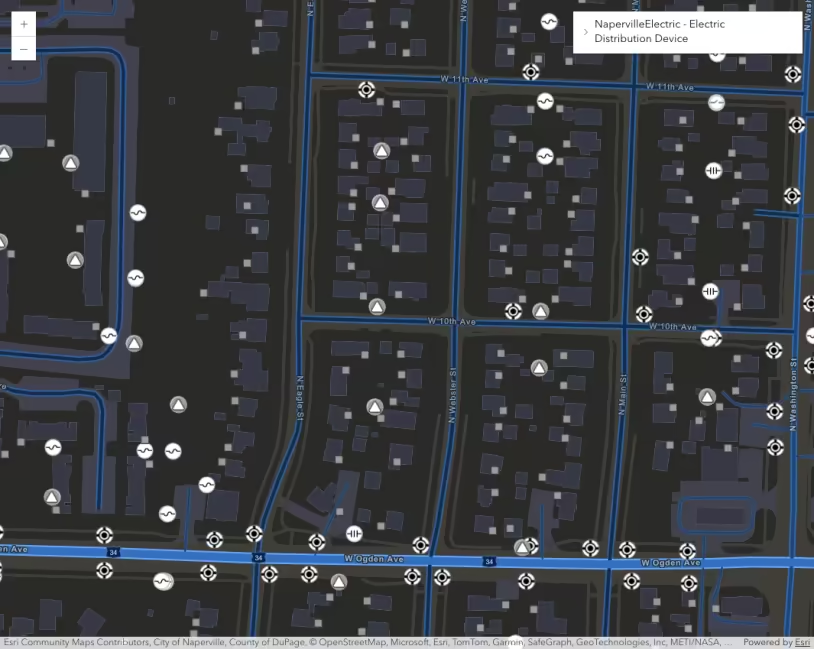
UtilityNetwork Associations component
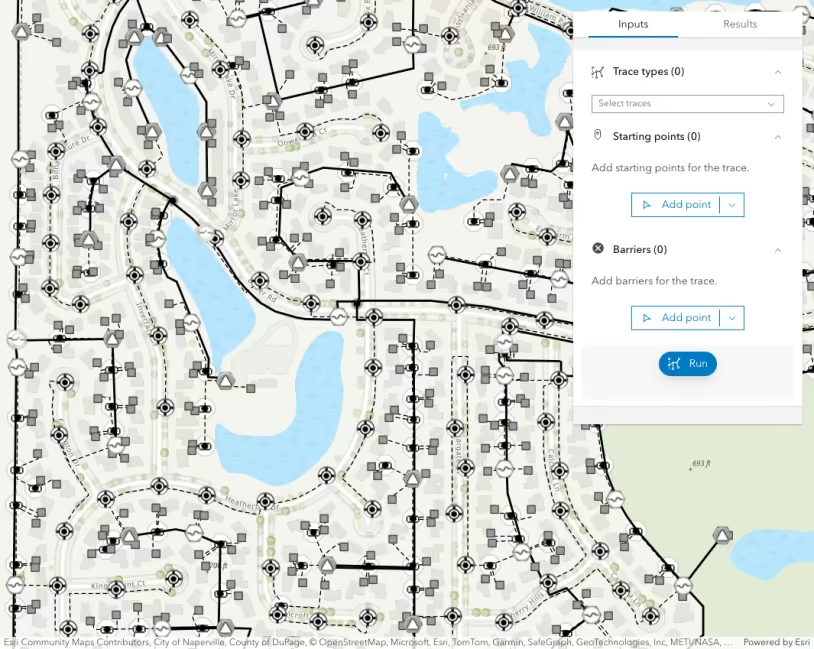
UtilityNetwork Trace component
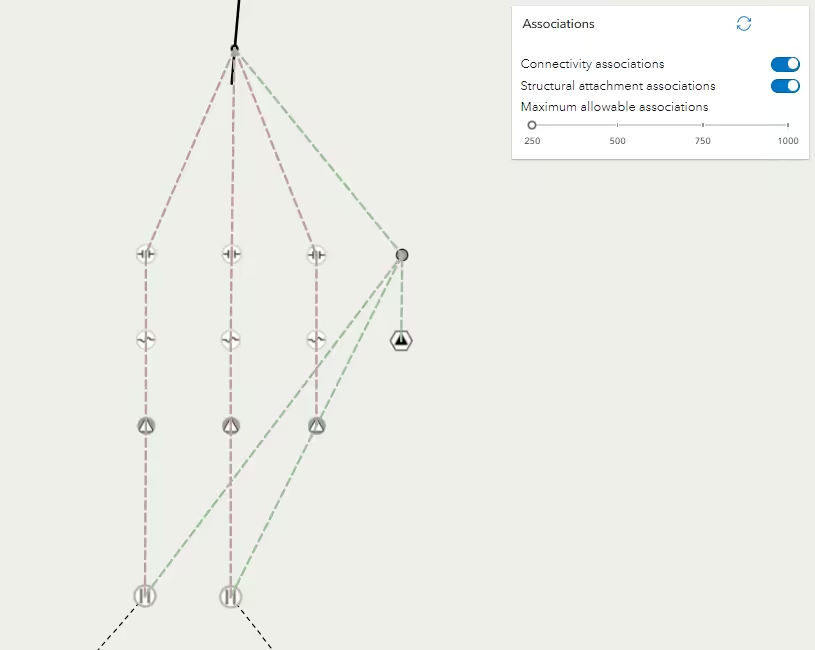
UtilityNetworkAssociations widget
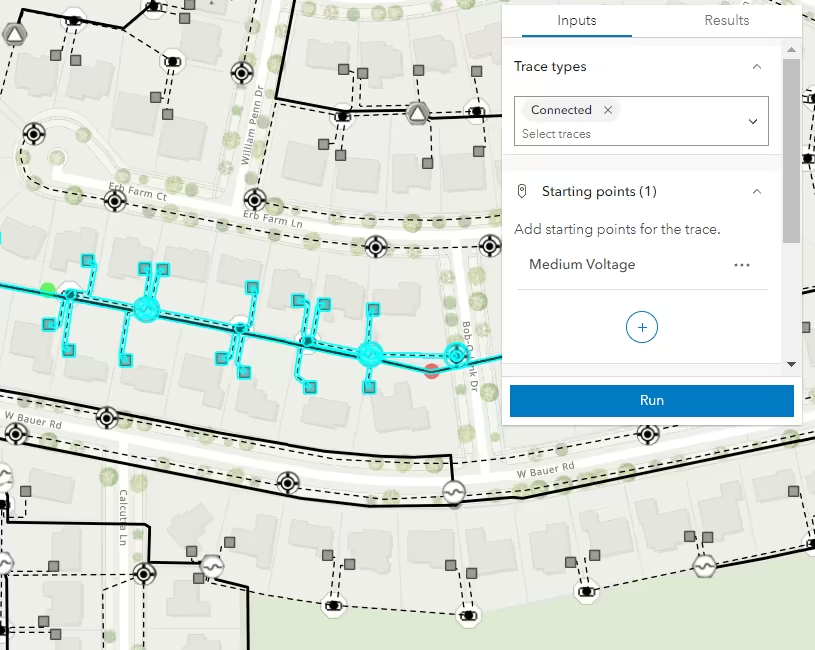
UtilityNetworkTrace widget
Value Picker component
Vary point sizes by scale
VectorTileLayer
VectorTileLayer - update style
VectorTileLayer - update style layers
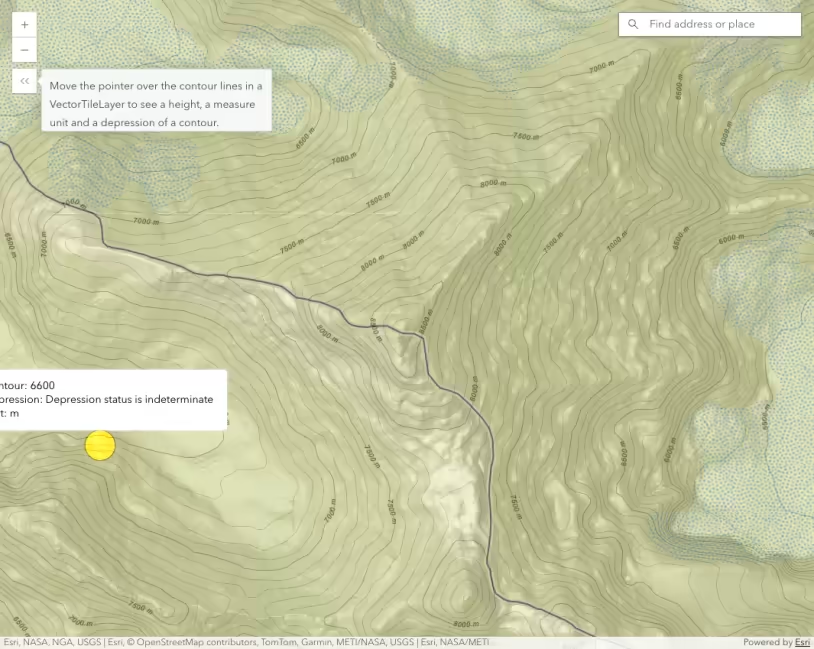
VectorTileLayer hitTest
ViewshedLayer in slides
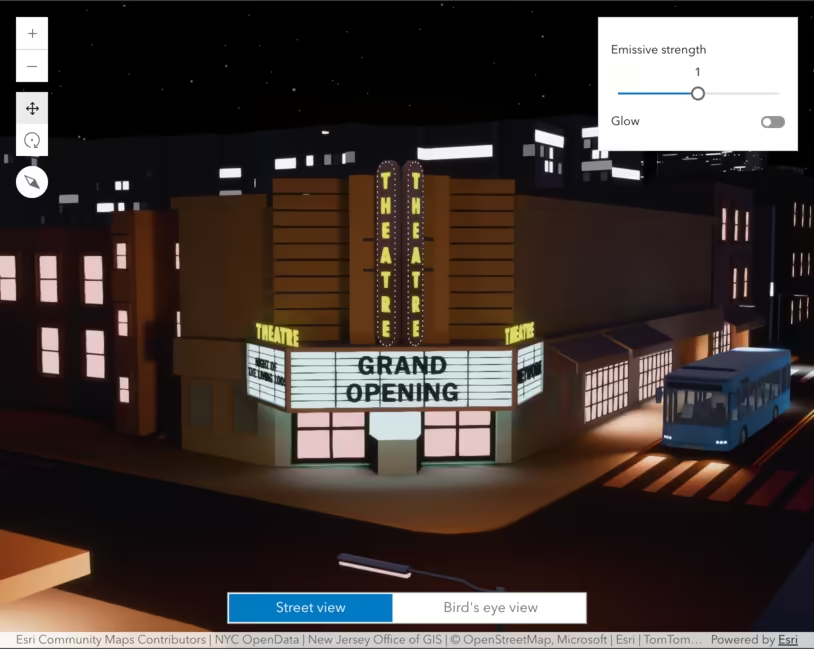
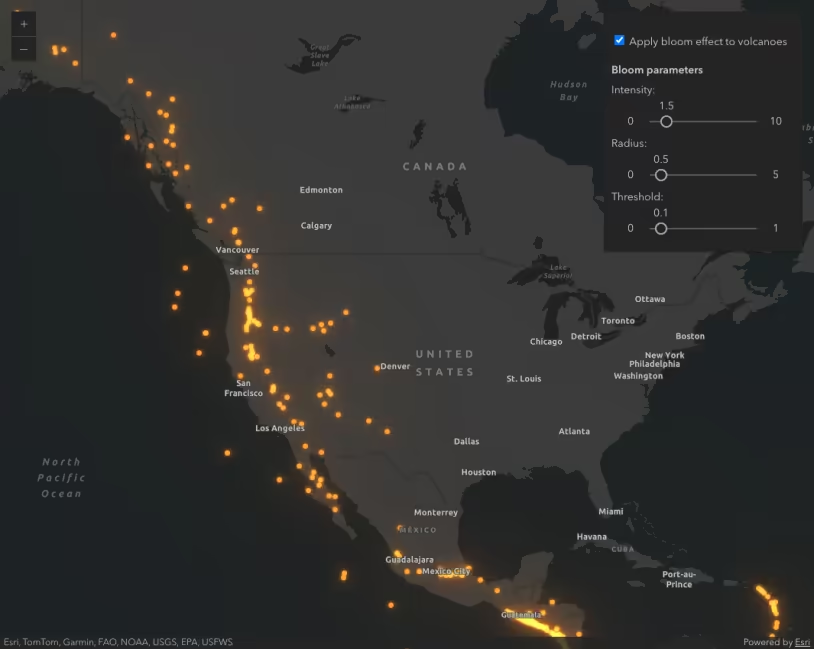
Visualizations with light-emitting symbols
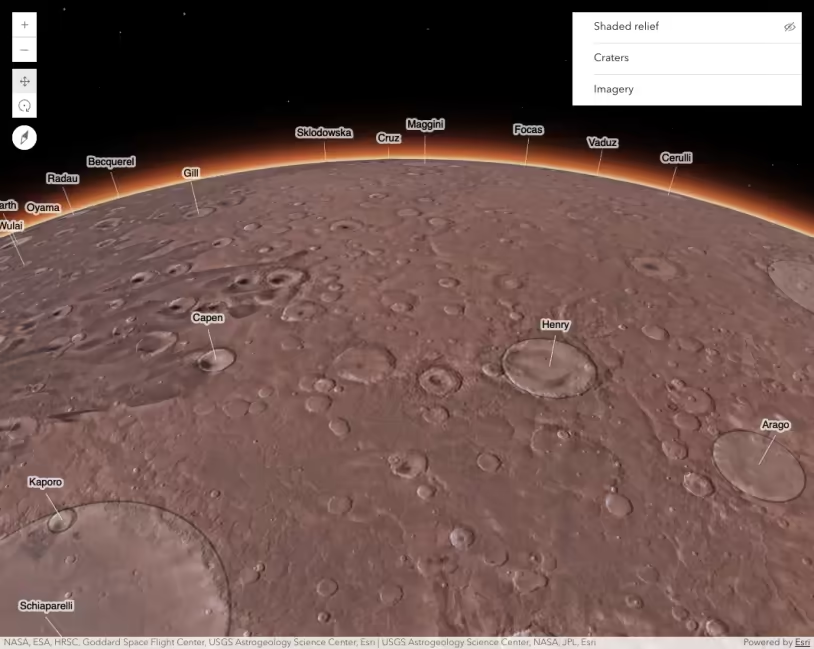
Visualize data on Mars
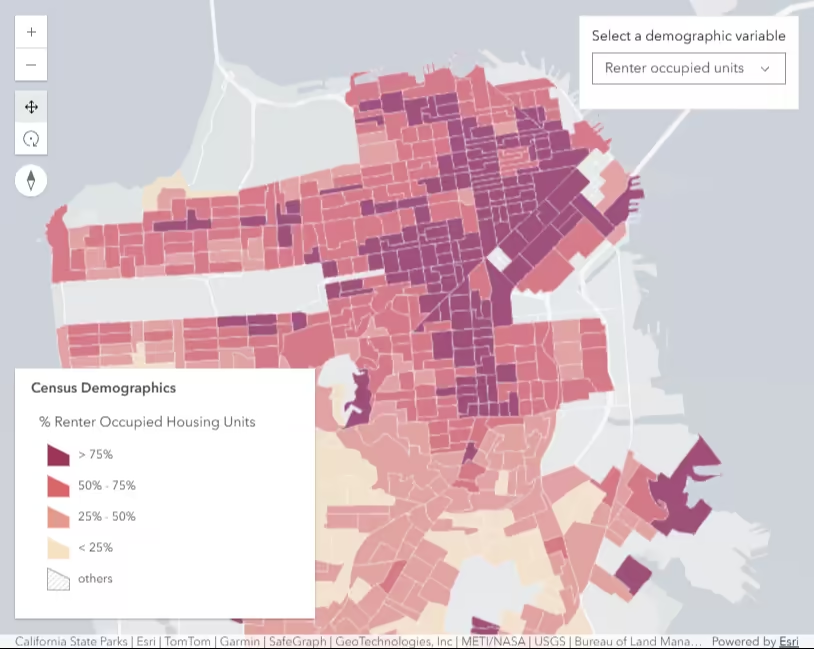
Visualize data with class breaks
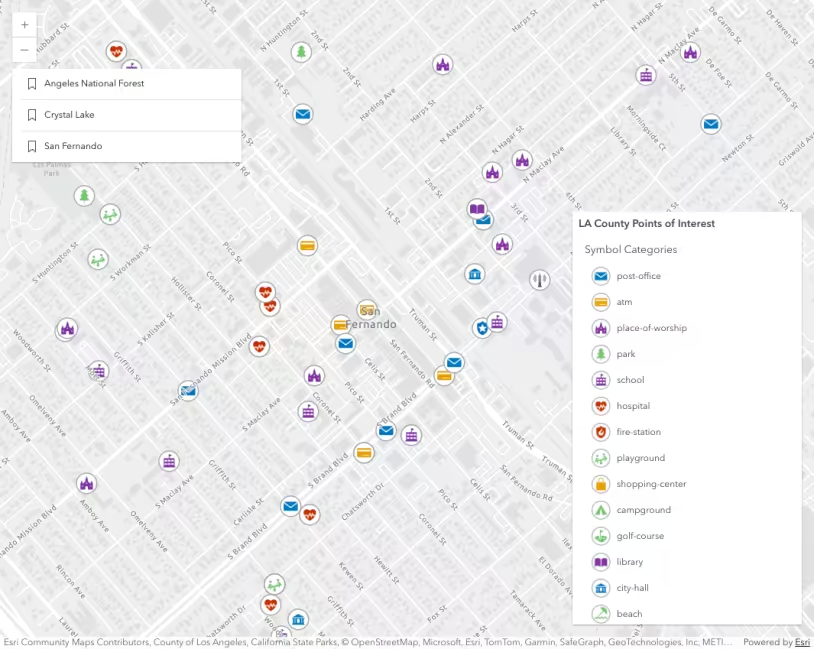
Visualize data with dictionary renderer
Visualize data with rotation
Visualize features by type
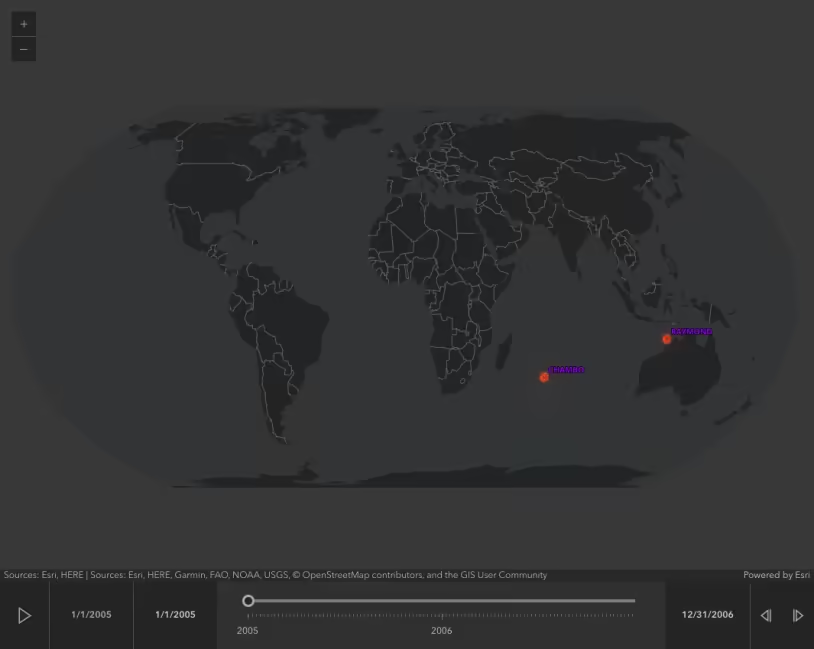
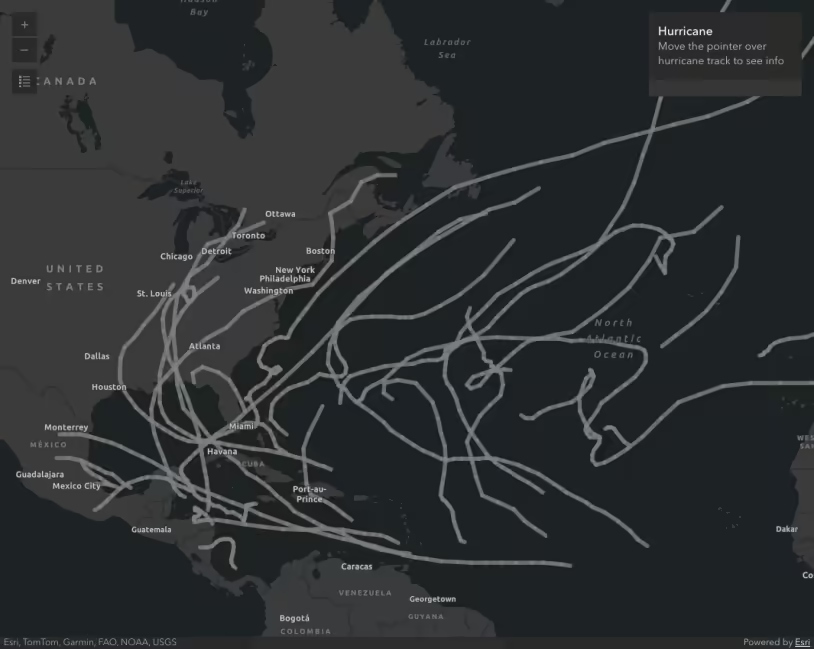
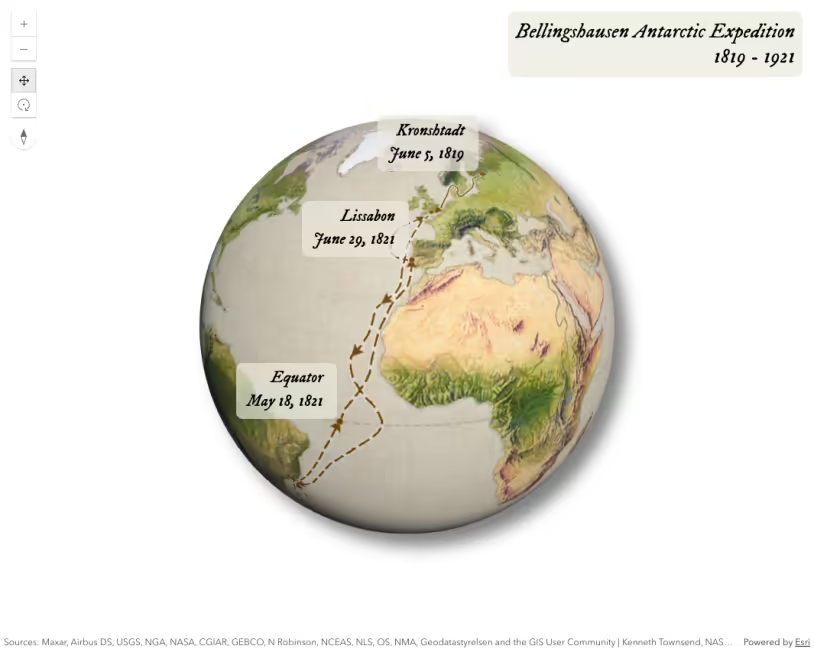
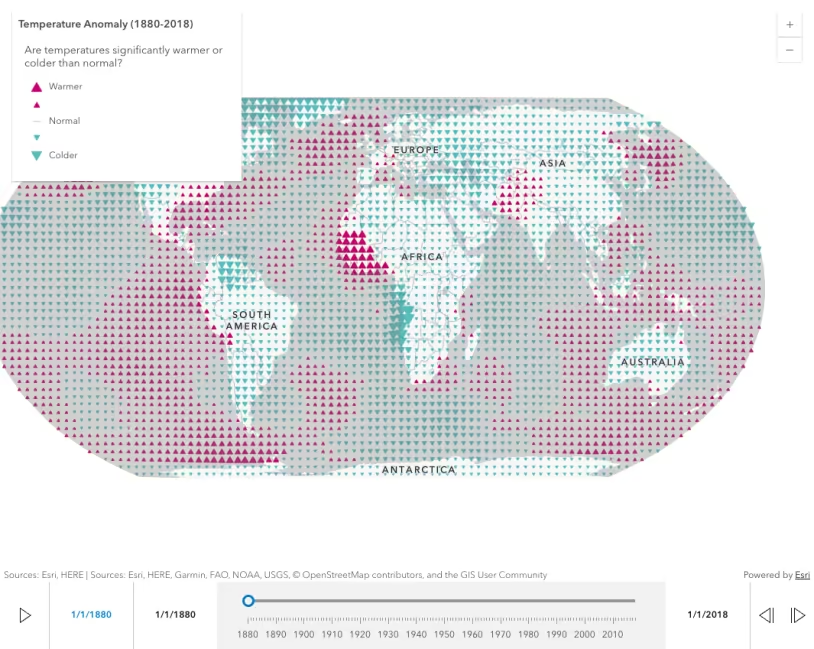
Visualize historical track data
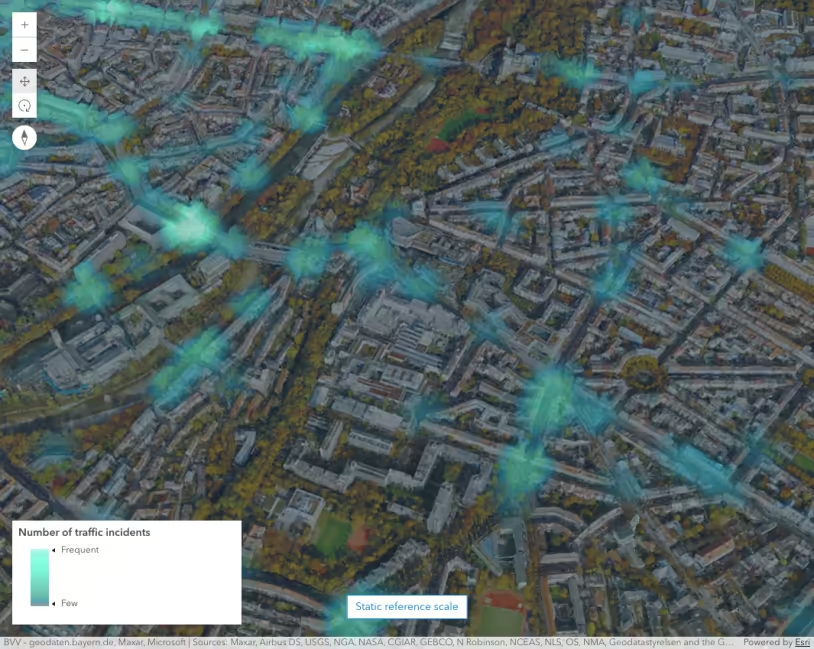
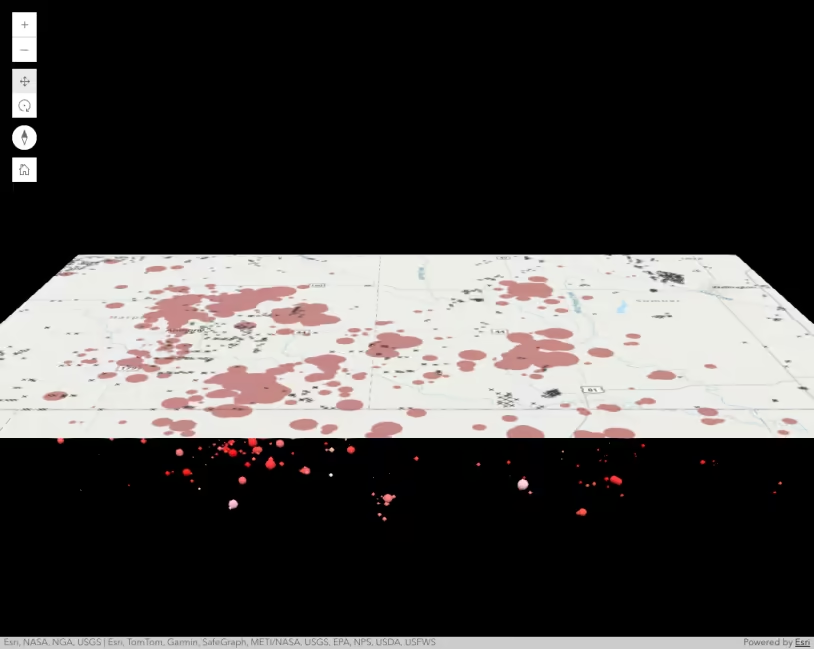
Visualize points in a scene with a heatmap
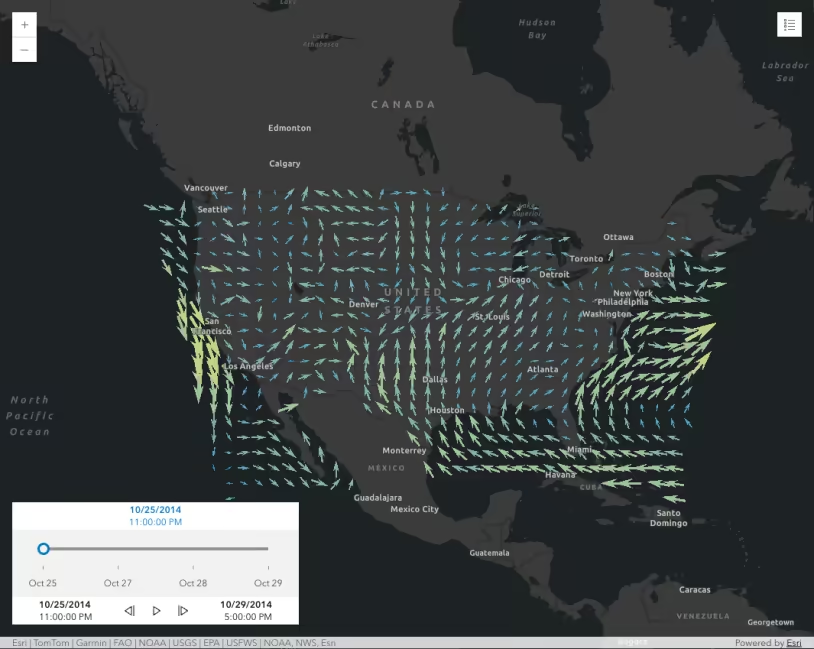
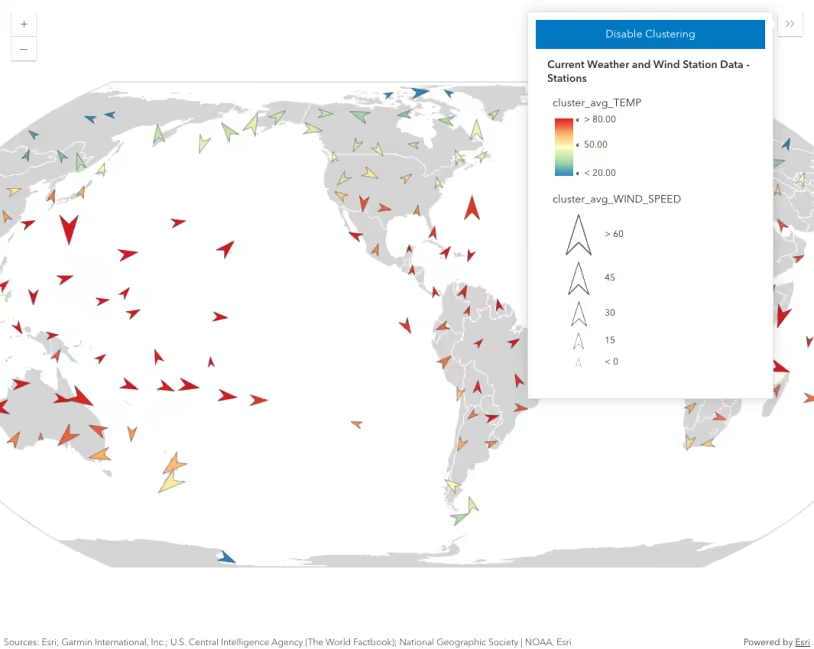
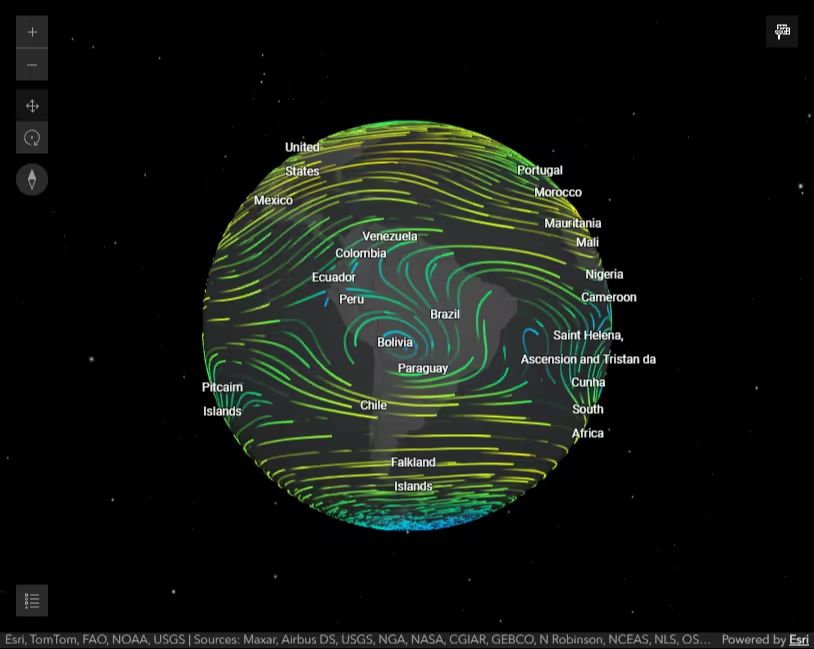
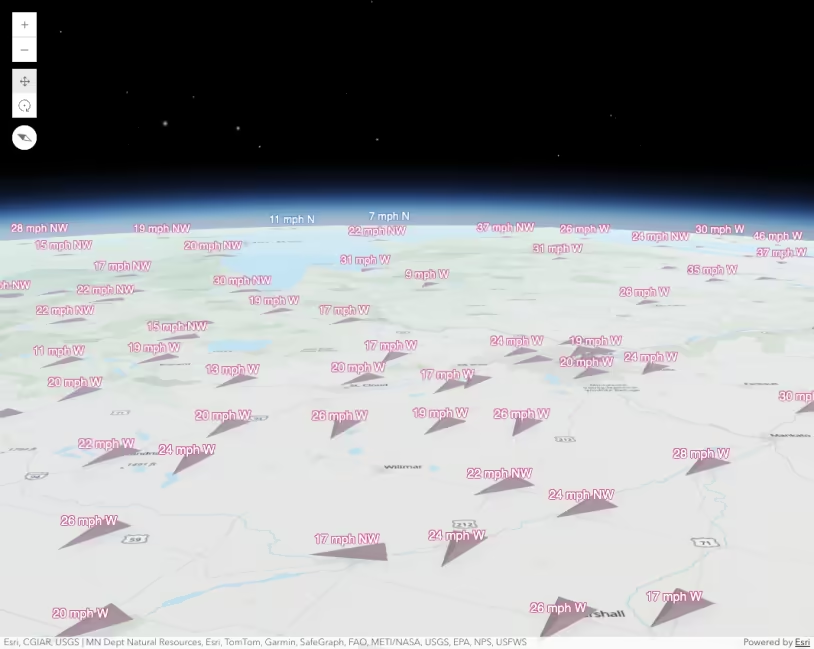
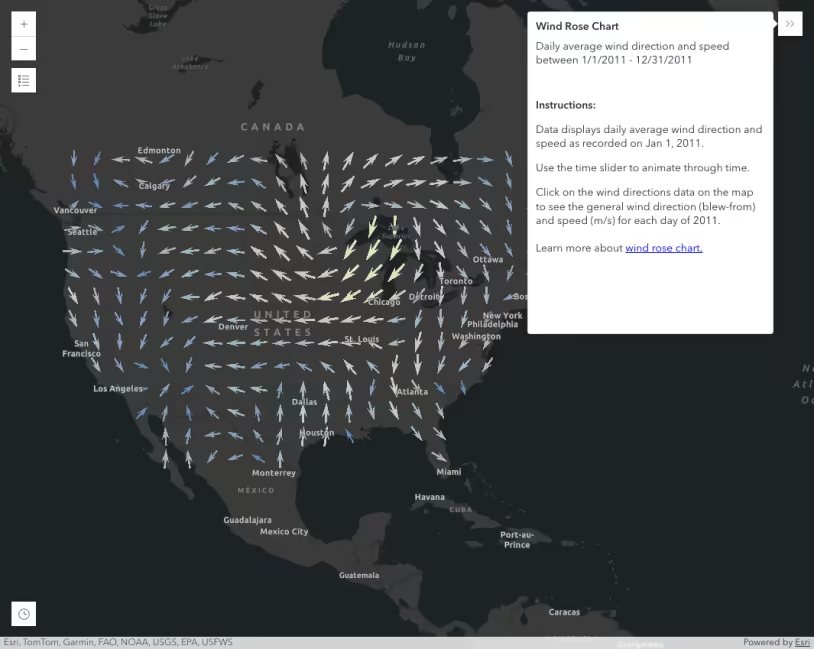
Visualizing wind data with VectorFieldRenderer
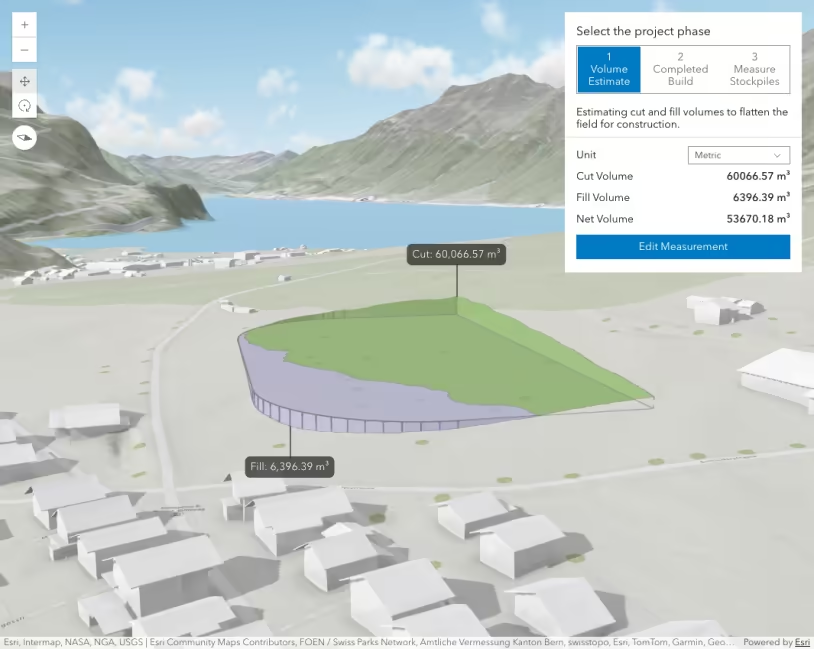
Volume measurement analysis object
VoxelLayer and time
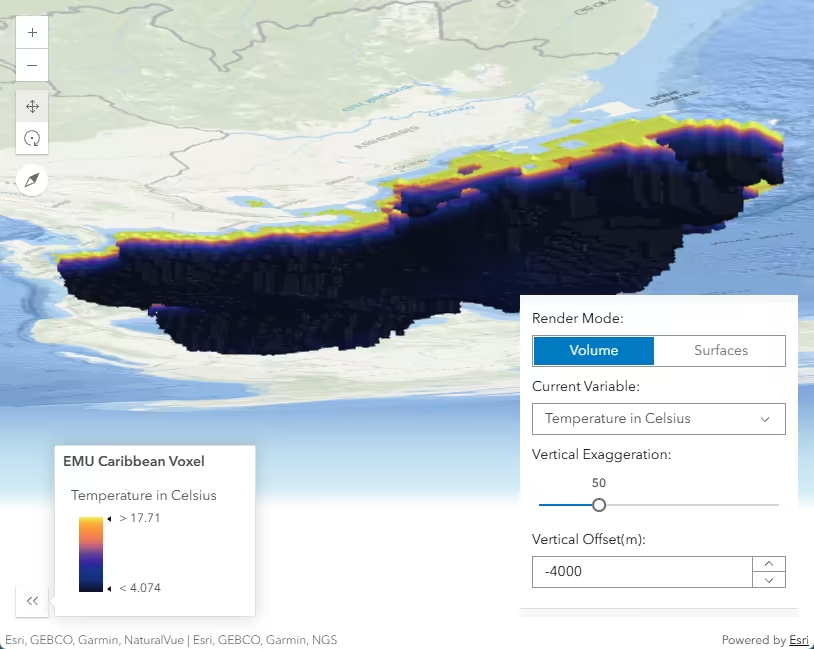
VoxelLayer variable and render mode
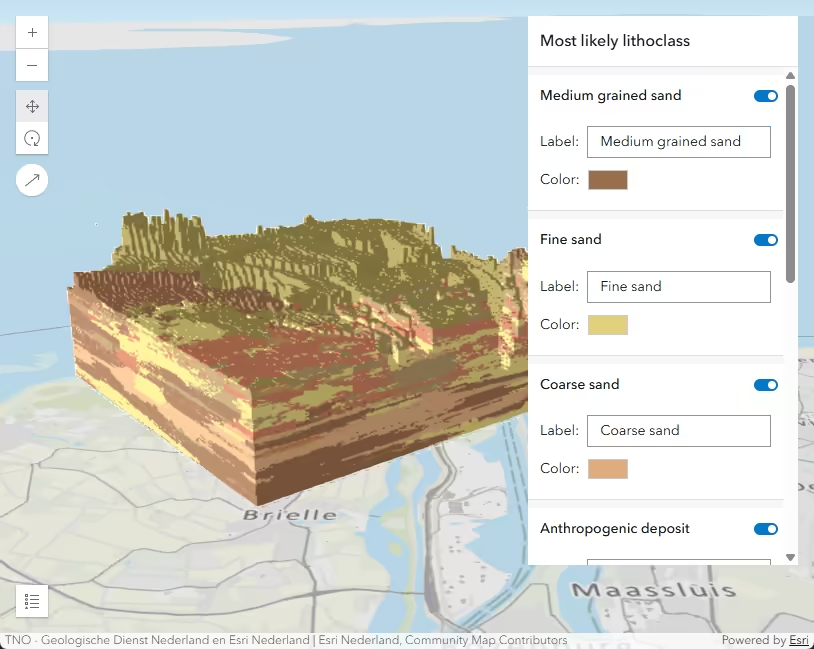
VoxelLayer with discrete variable
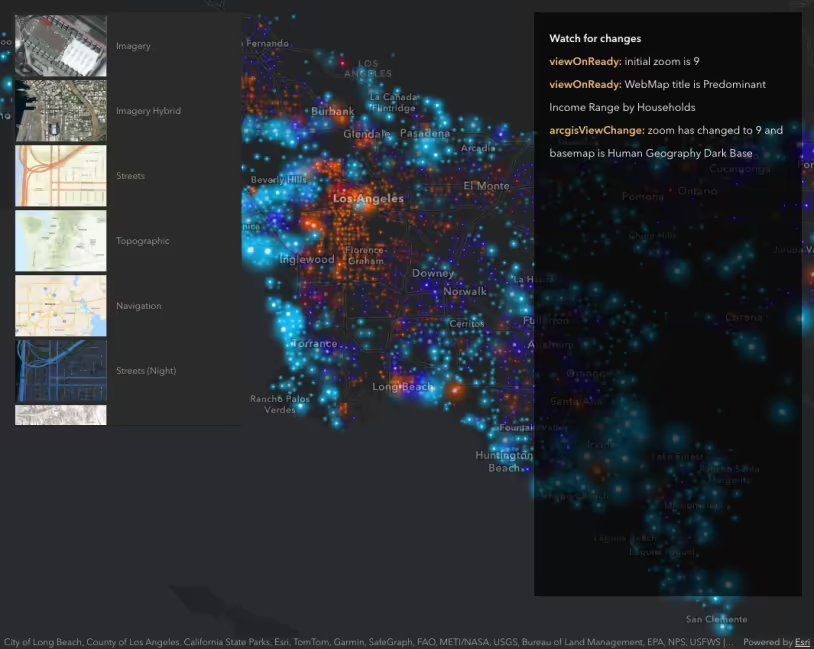
Watch for changes in components
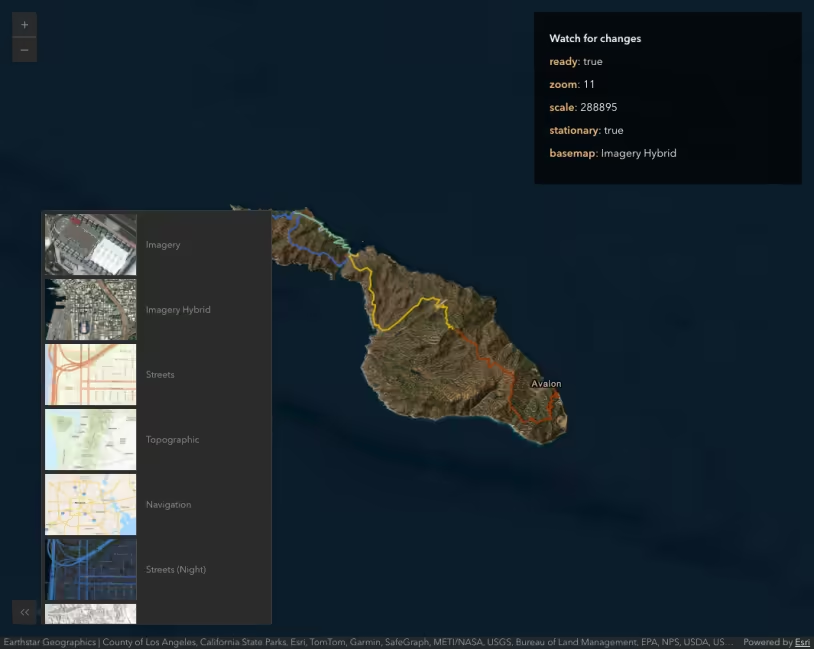
Watch for changes in components using reactiveUtils
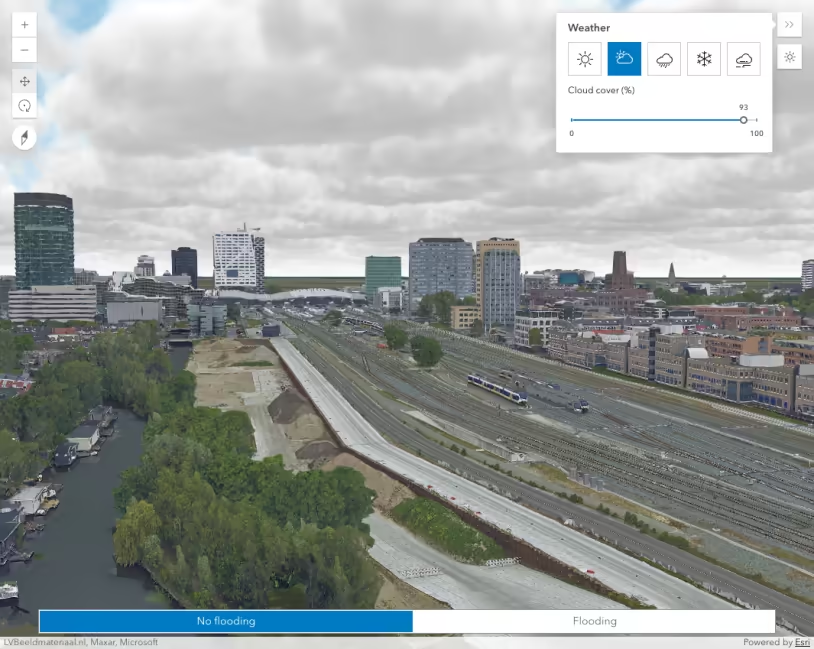
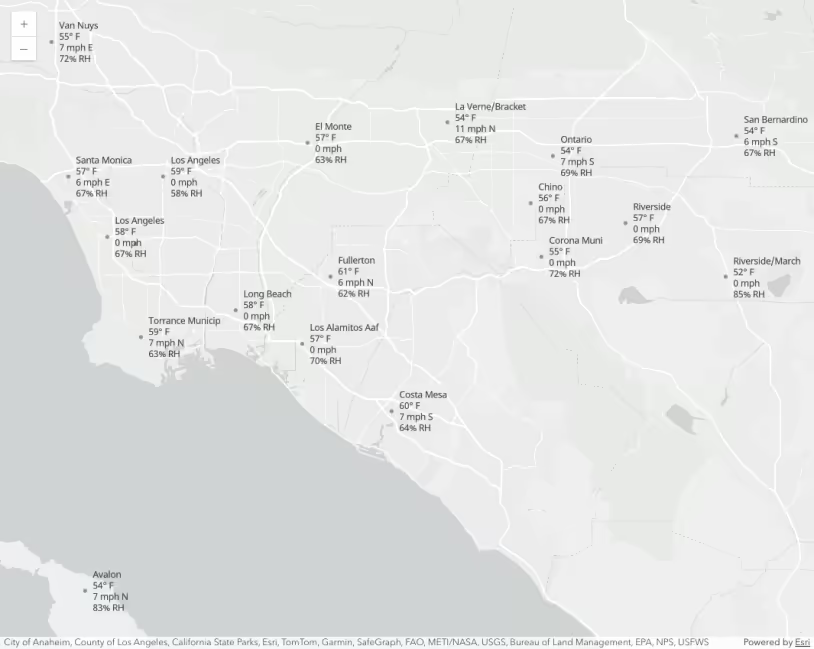
Weather component
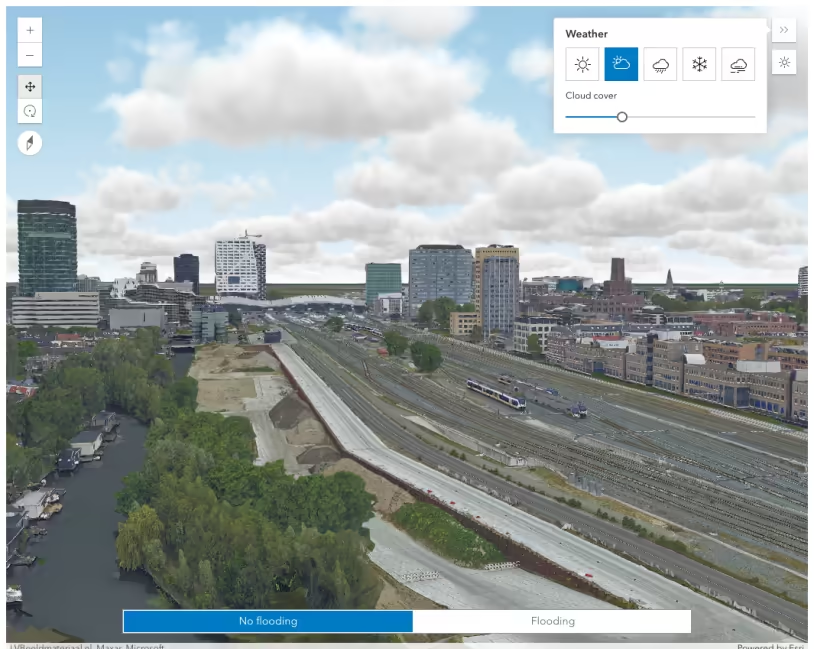
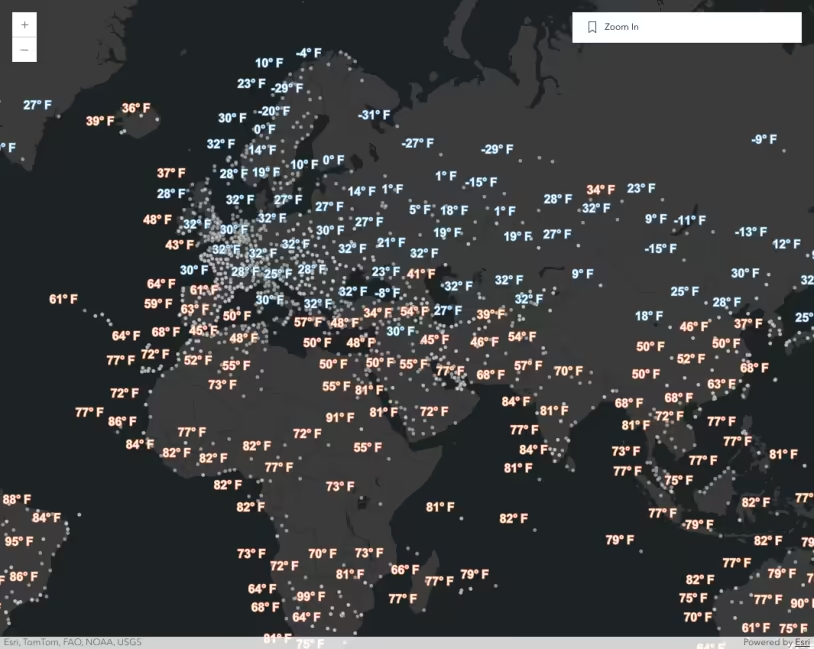
Weather visualization
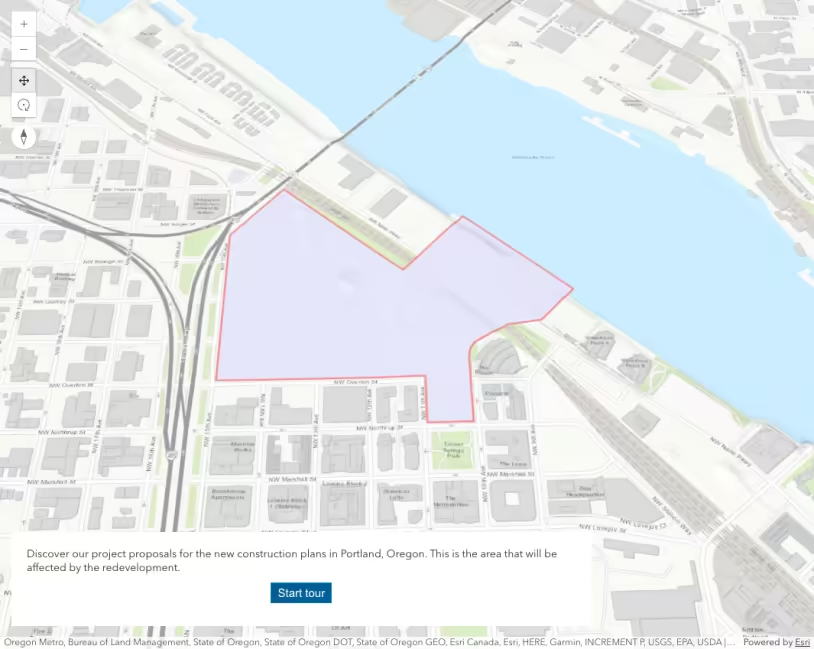
Web scene - slide tour
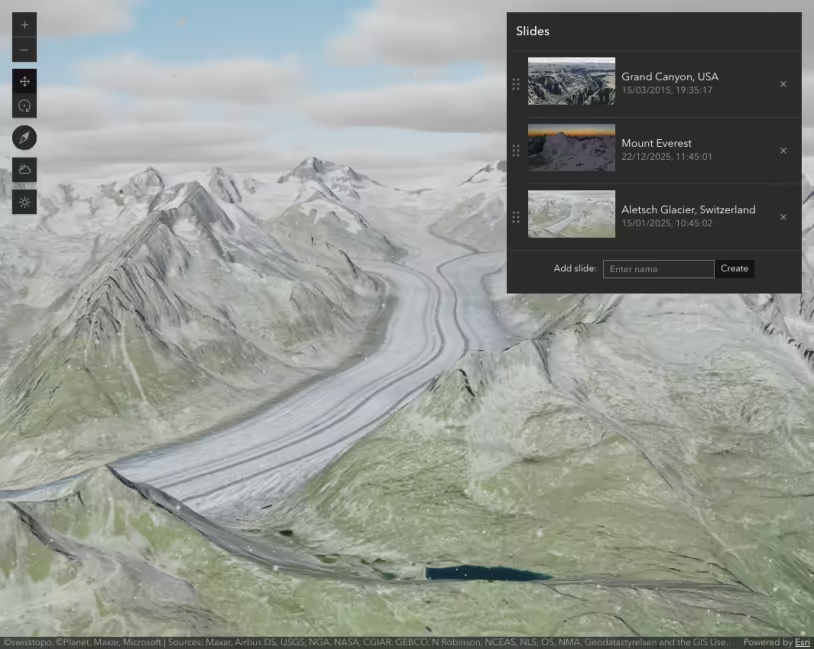
Web scene - slides
WebStyleSymbol - continuous size (2D)
WebStyleSymbol (2D)
WebTileLayer
WFSLayer
WMSLayer
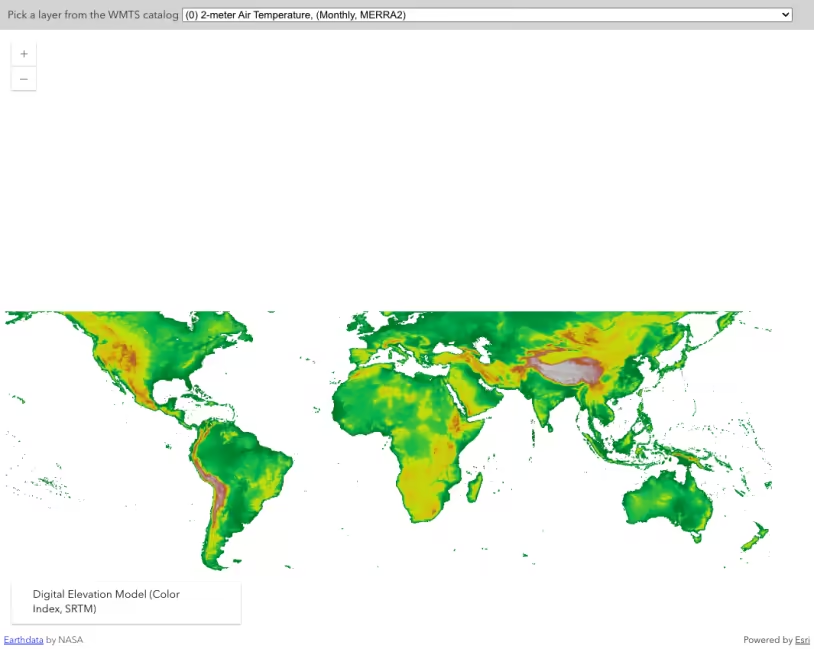
WMTSLayer
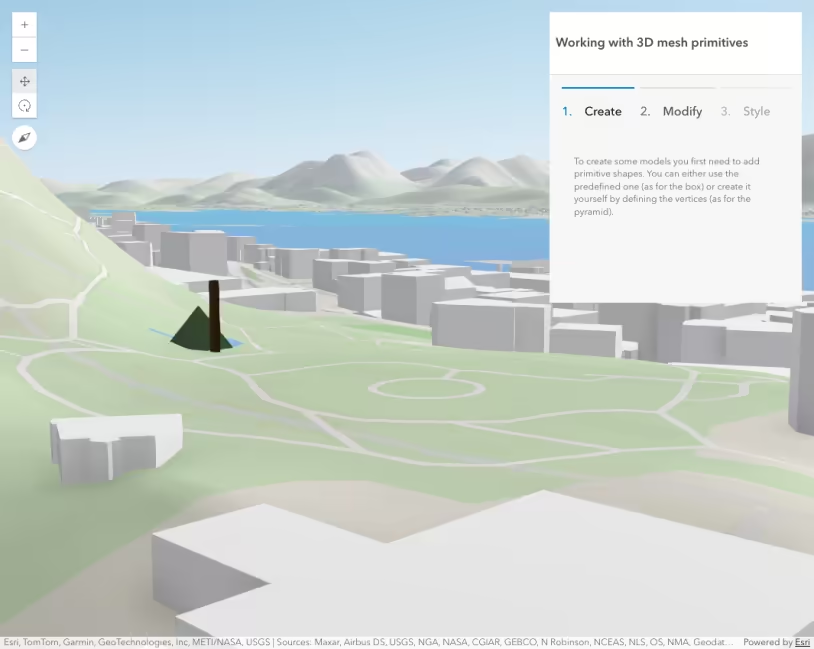
Working with 3D mesh primitives
Working with KnowledgeGraphLayer
Working with large feature collections
Zoom to extent of all features