Welcome to a flattened collection of all of the ArcGIS Maps SDK for JavaScript samples. Click a sample's card to navigate to the description page that will explain how the sample works and allow you to interact with the sample in a variety of ways. Use the categories on the right to navigate to the sample of interest. There are 410 samples in the ArcGIS Maps SDK for JavaScript.
Latest samples
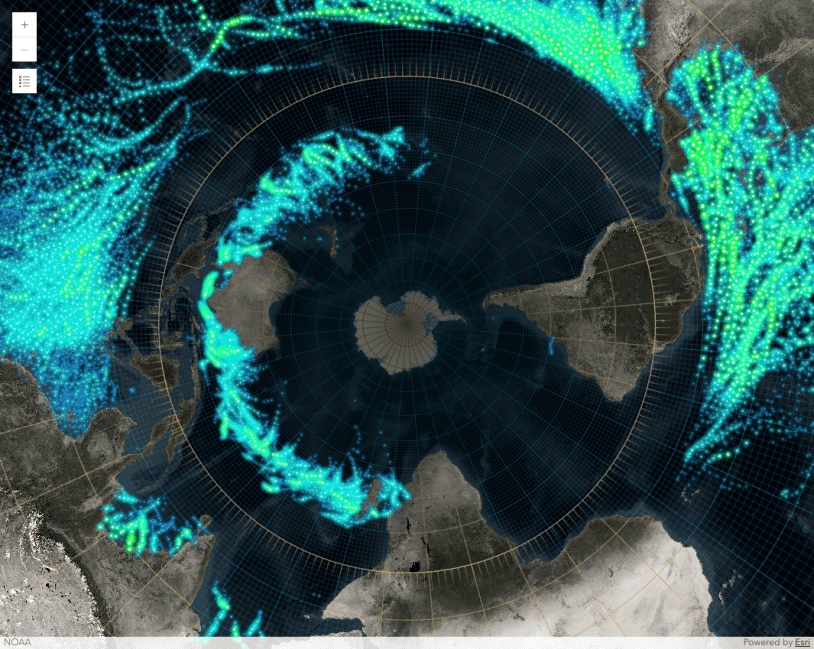
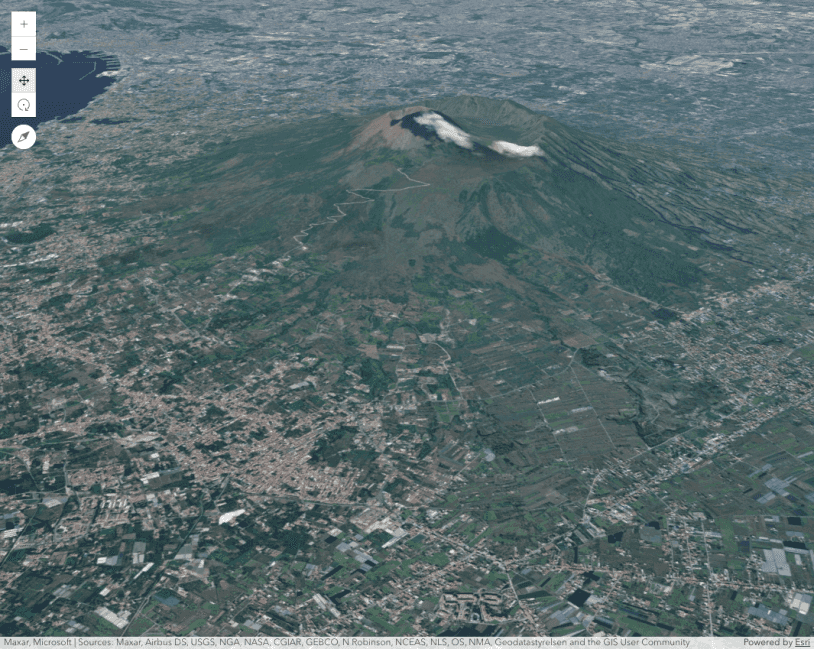
FlowRenderer in a 3D scene
This sample demonstrates how to use the FlowRenderer on an ImageryTileLayer within a 3D scene and how to filter its dimensions.
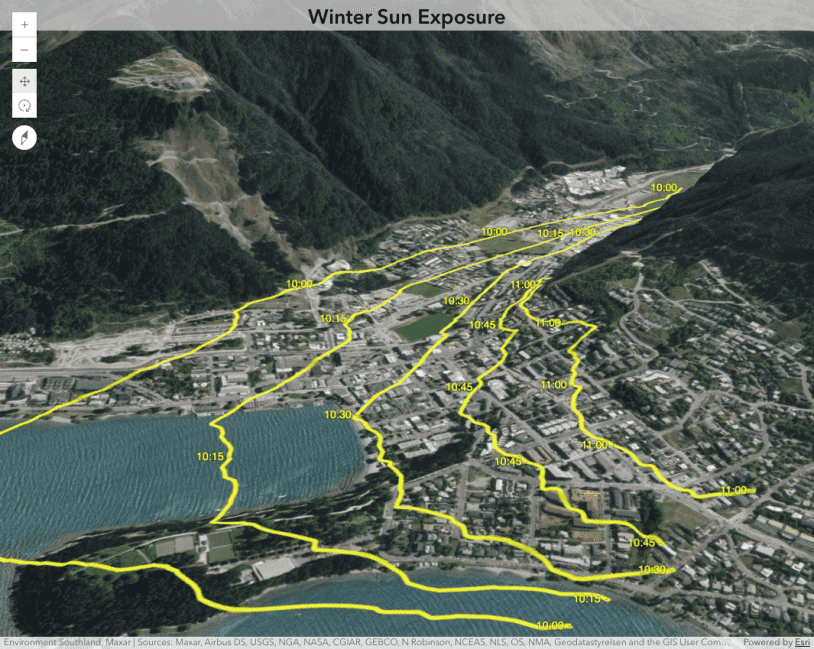
FlowRenderer with elevation modes
This sample demonstrates how to use the FlowRenderer on an ImageryTileLayer in a 3D scene and visualize it at different elevation modes.
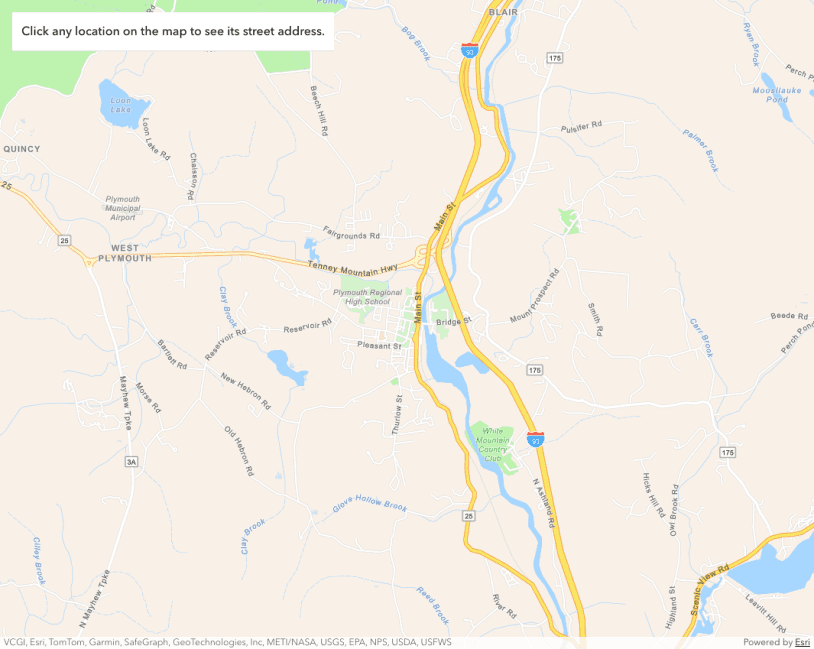
Intro to popup component
A step-by-step guide about adding popup components to your app.
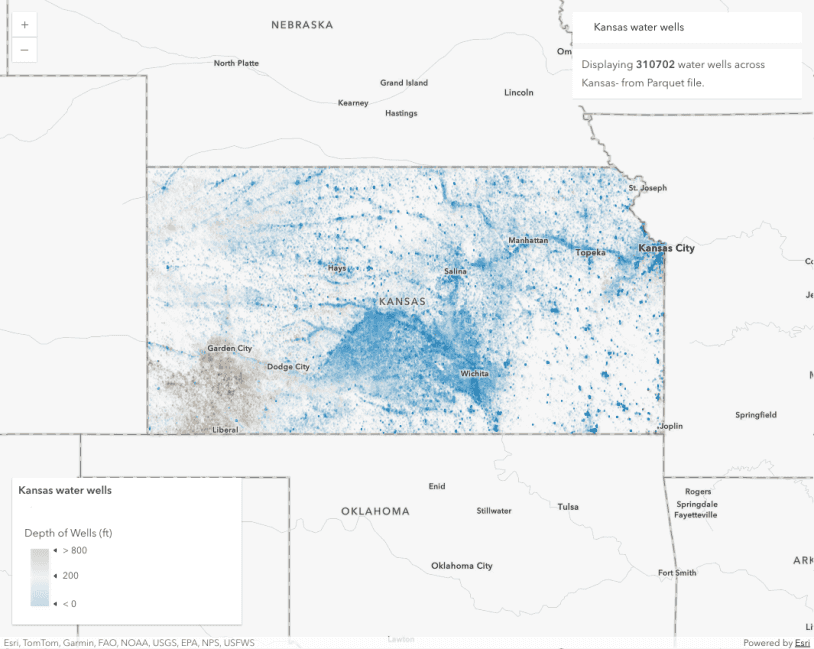
ParquetLayer
Intro to ParquetLayer
Mapping and views
Intro to map components (2D)
Intro to map components - Create a 2D map


Save a web map

Swap web maps in the same view
Access features with hitTest
Client-side projection
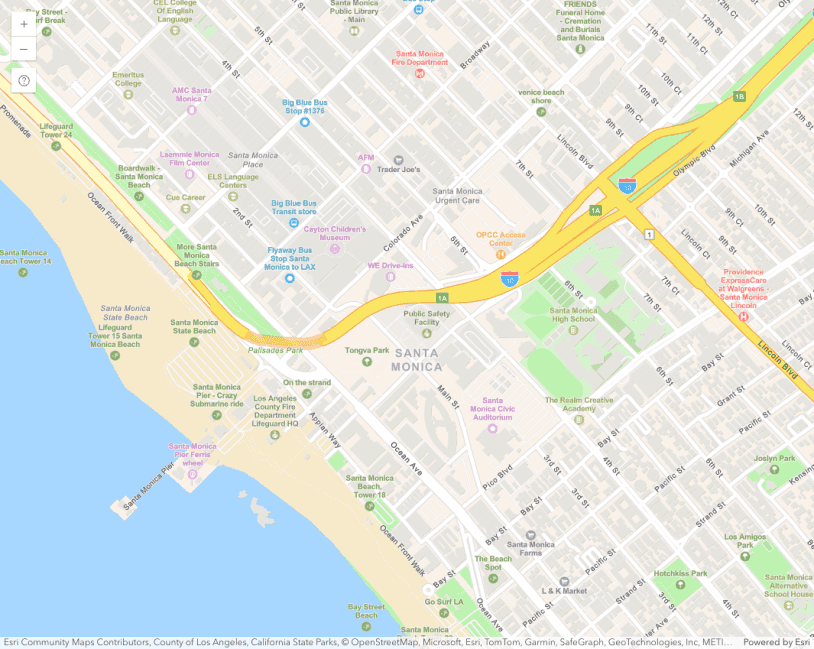
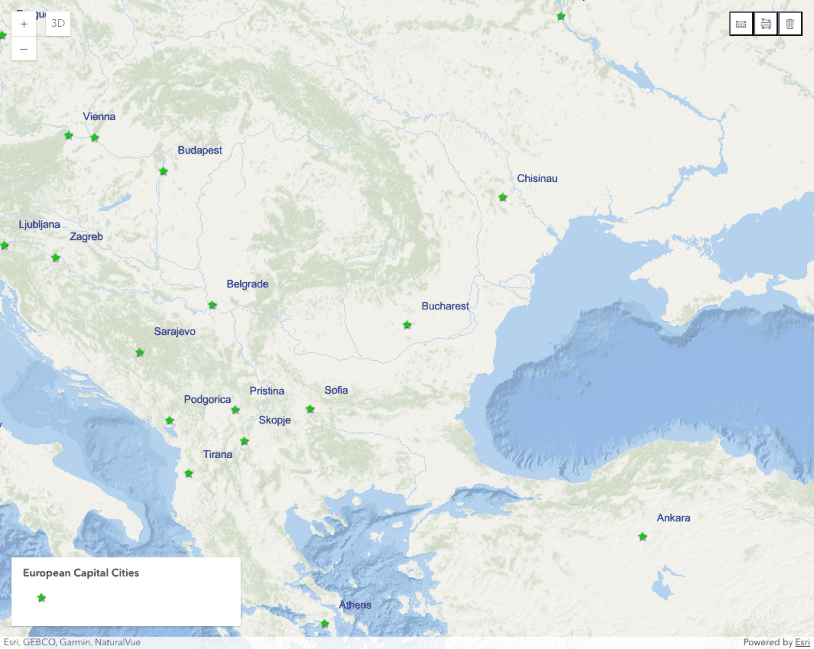
Basemap places
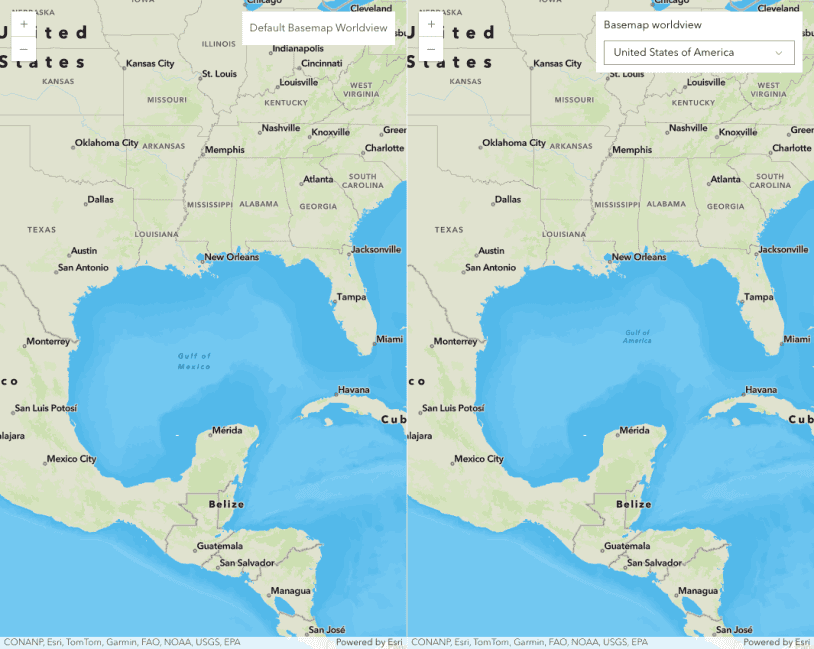
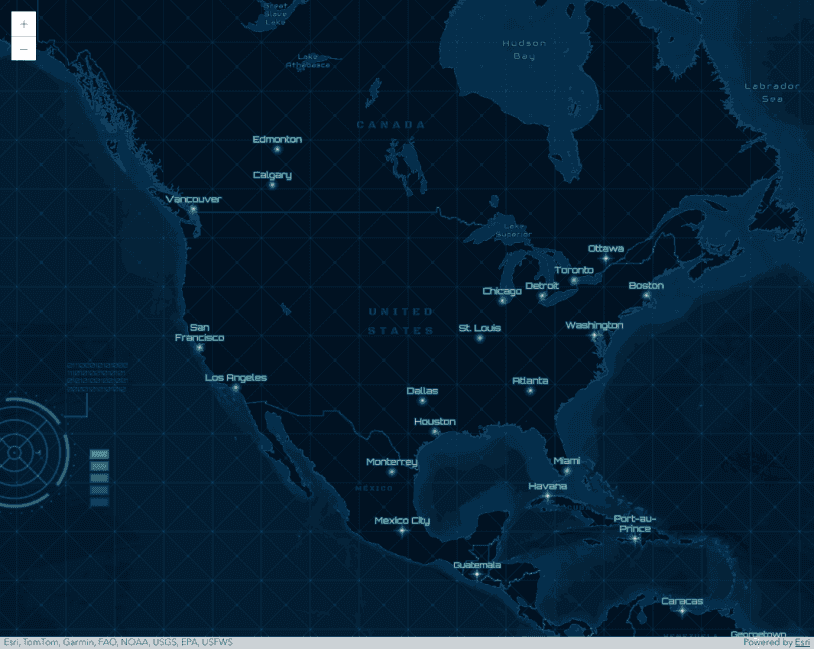
Basemap worldview
Change the worldview of your basemap with the BasemapStyle class.

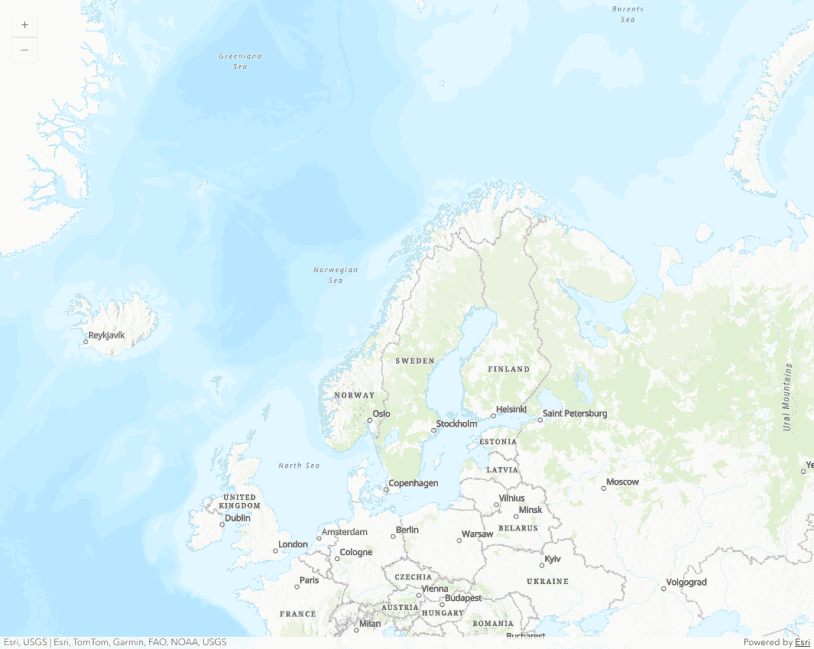
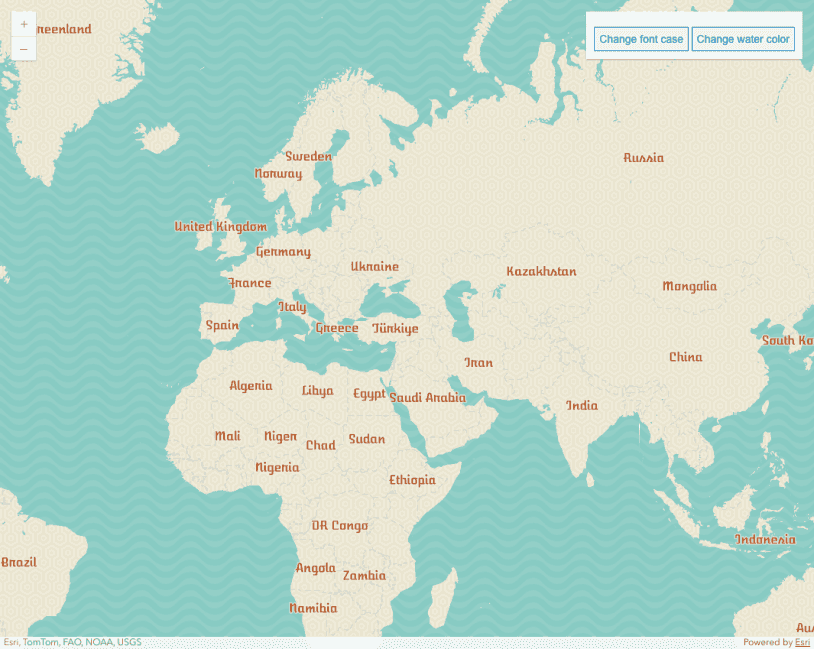
Static basemap tiles
Change the style of your basemap from the static basemap tiles service.
Load a basic web scene
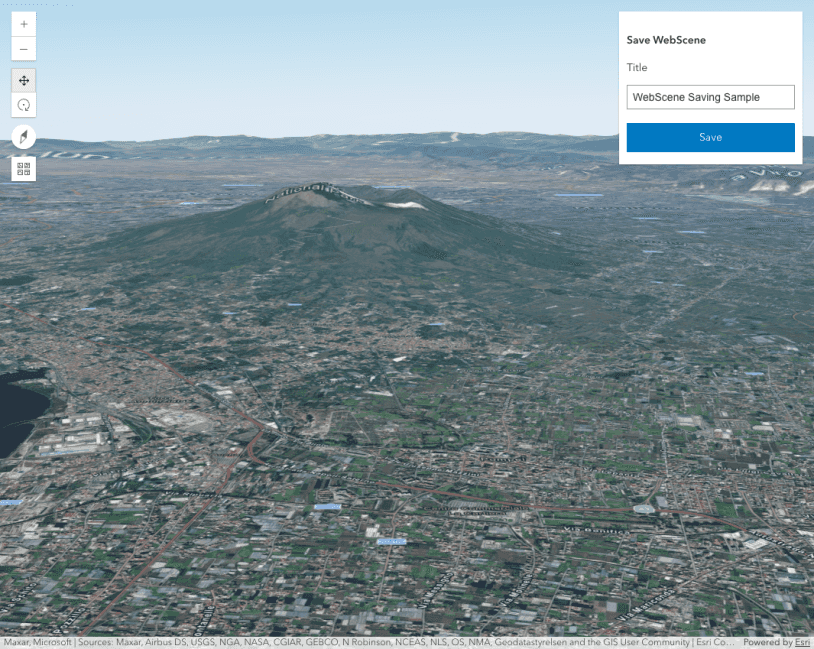
Save a web scene

Web scene - slides

Create a local scene
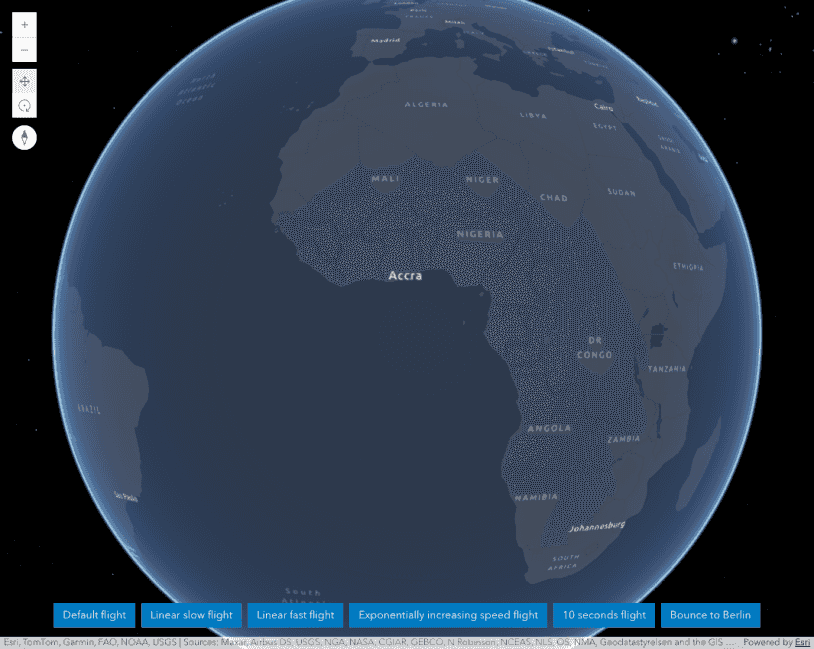
Scene - goTo()
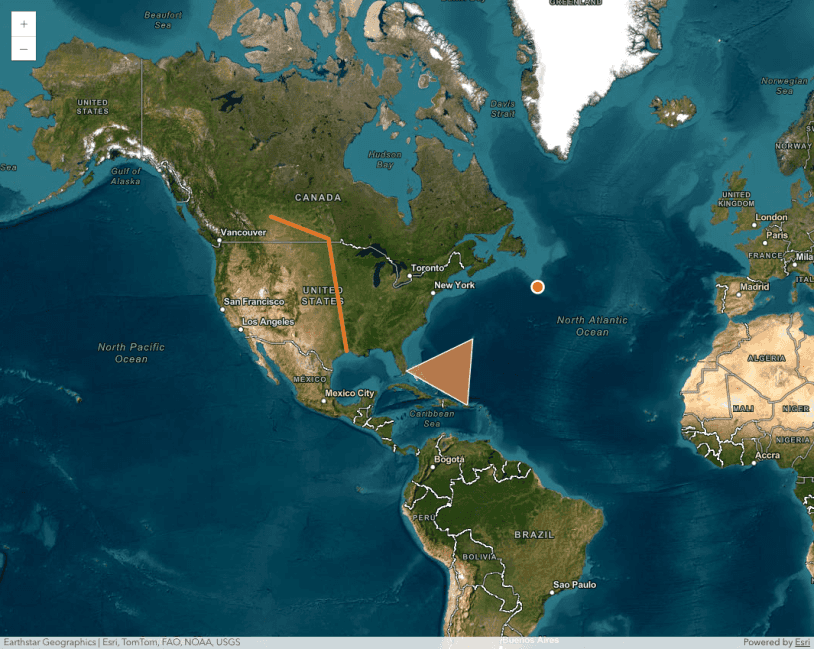
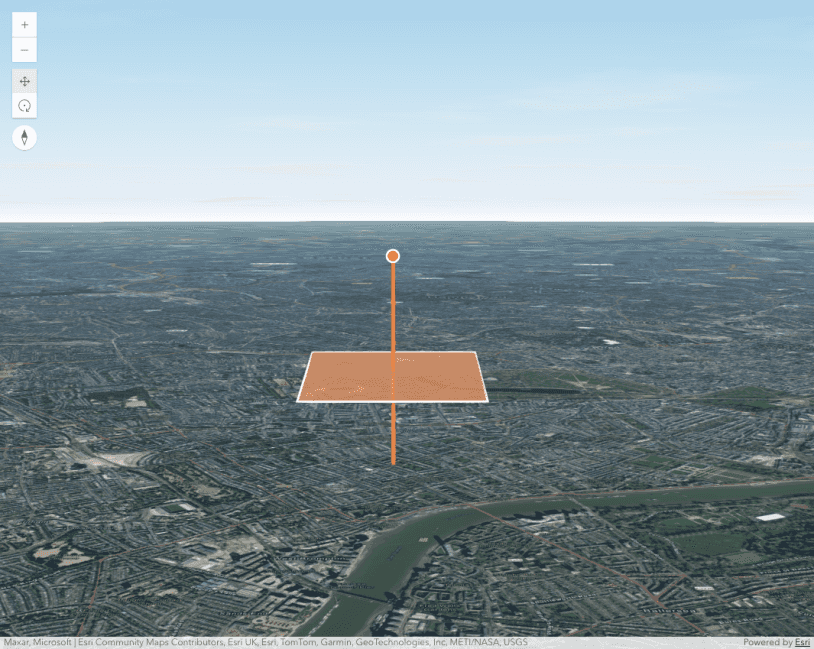
3D Scene - visibleArea
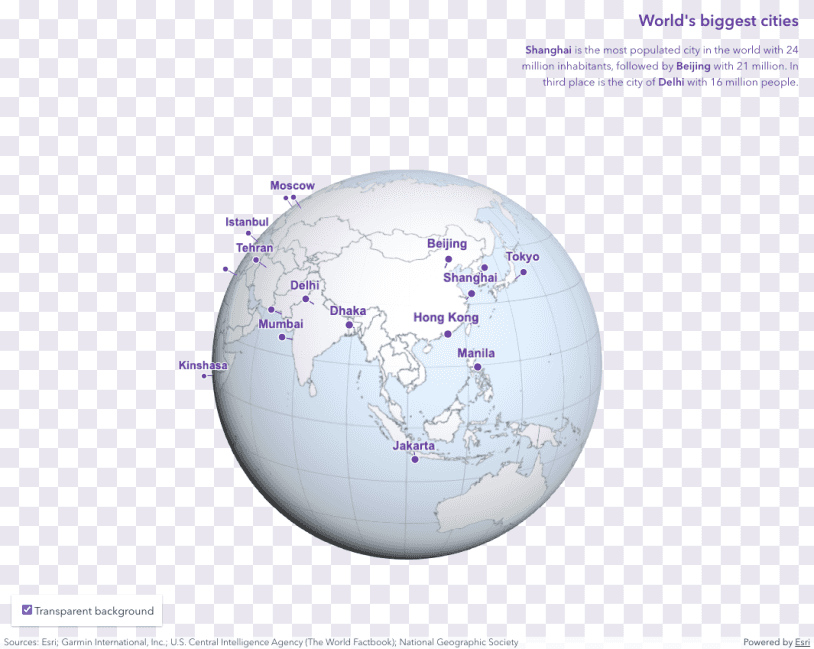
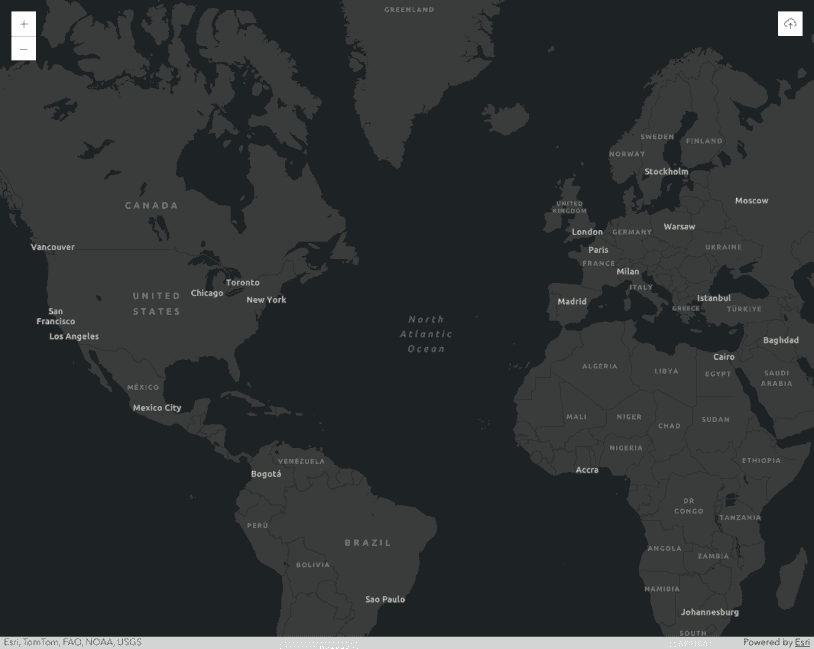
Custom background for SceneView
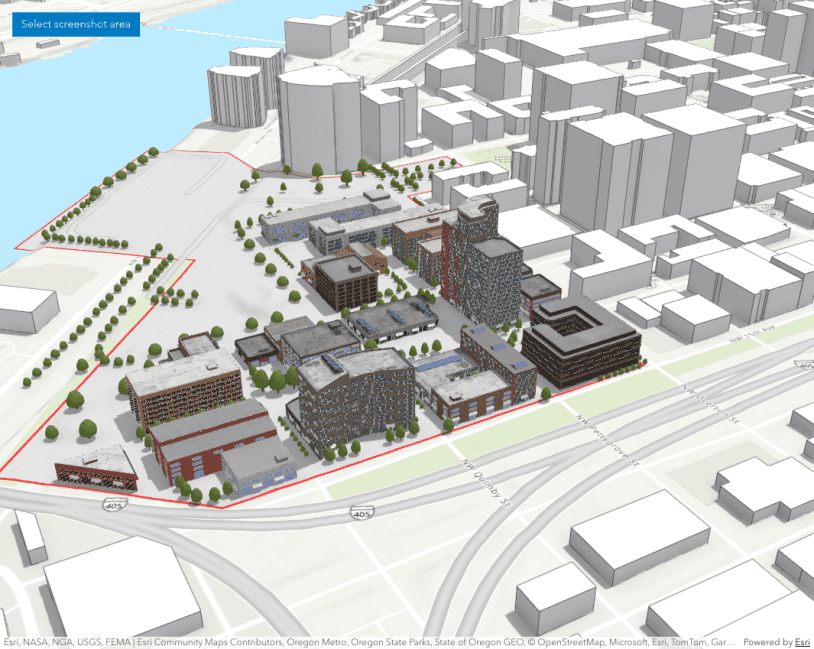
Take a screenshot of a Scene
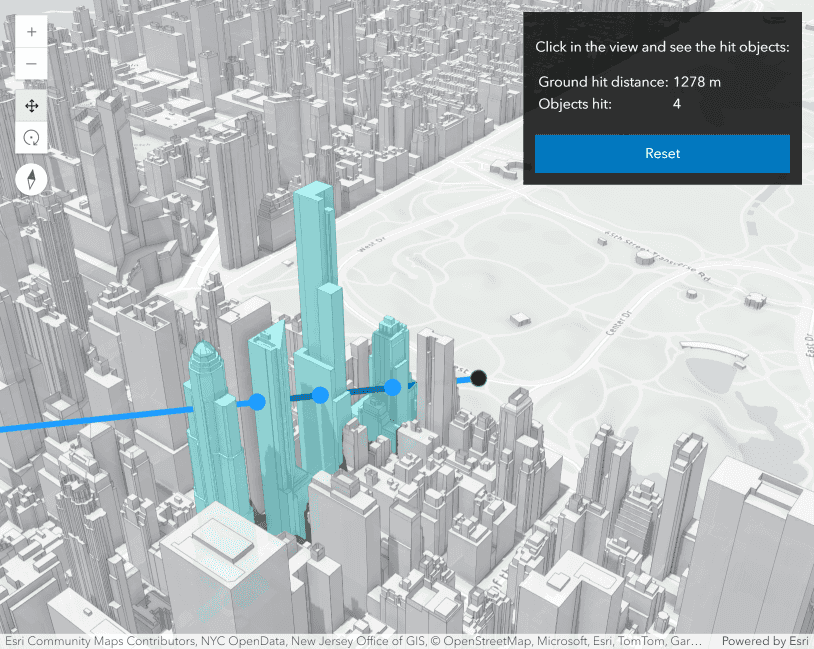
Scene - hitTest
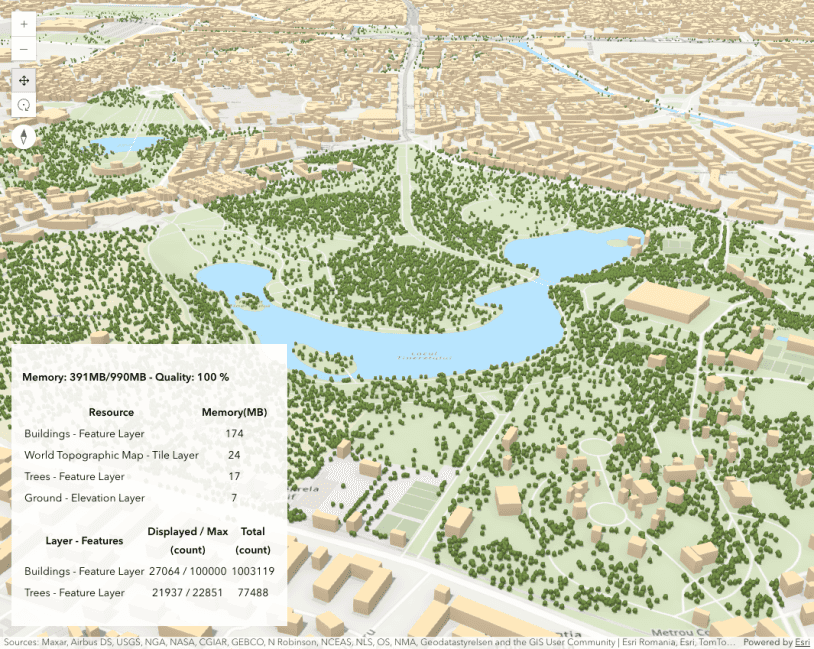
SceneView memory resources
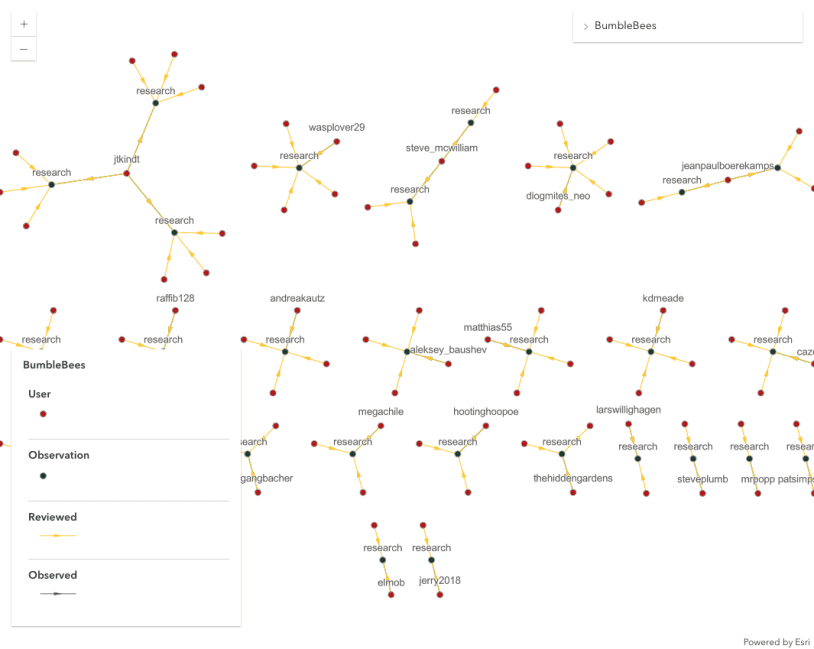
Create a link chart
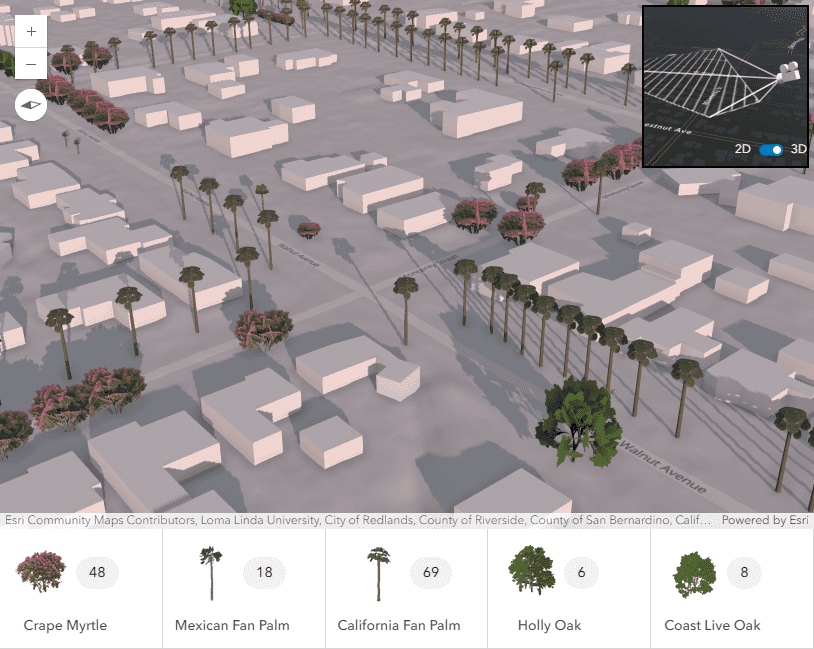
Switch view from 2D to 3D
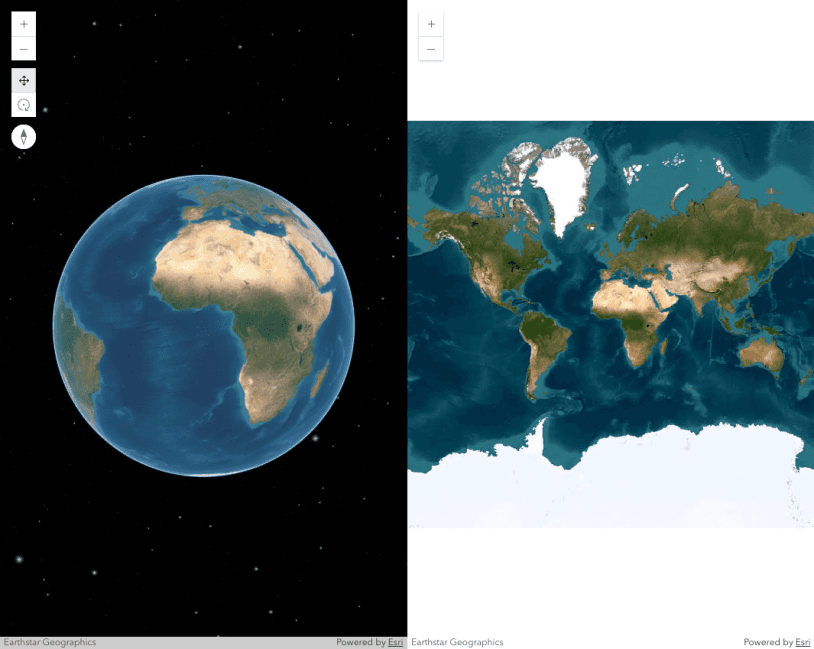
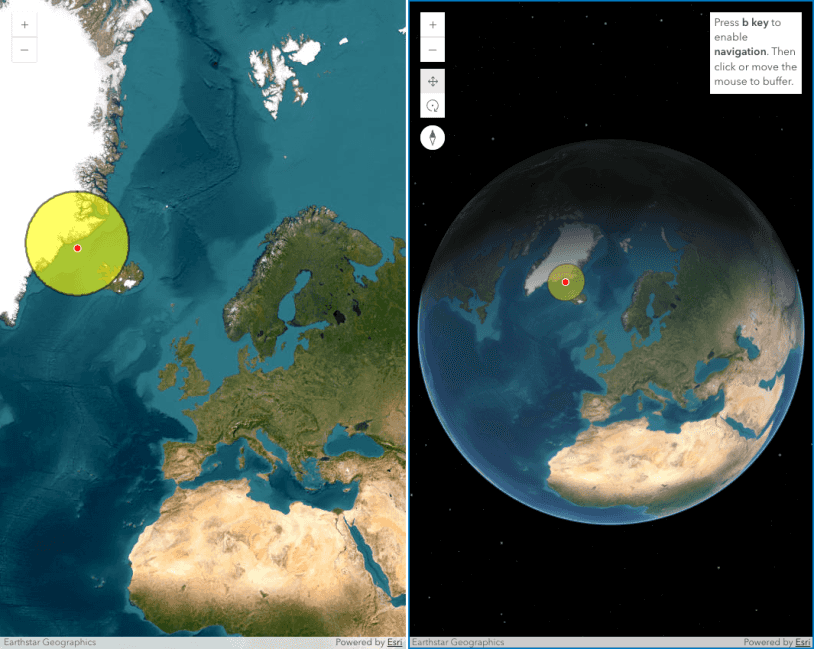
Synchronize MapView and SceneView


Underground navigation in global mode
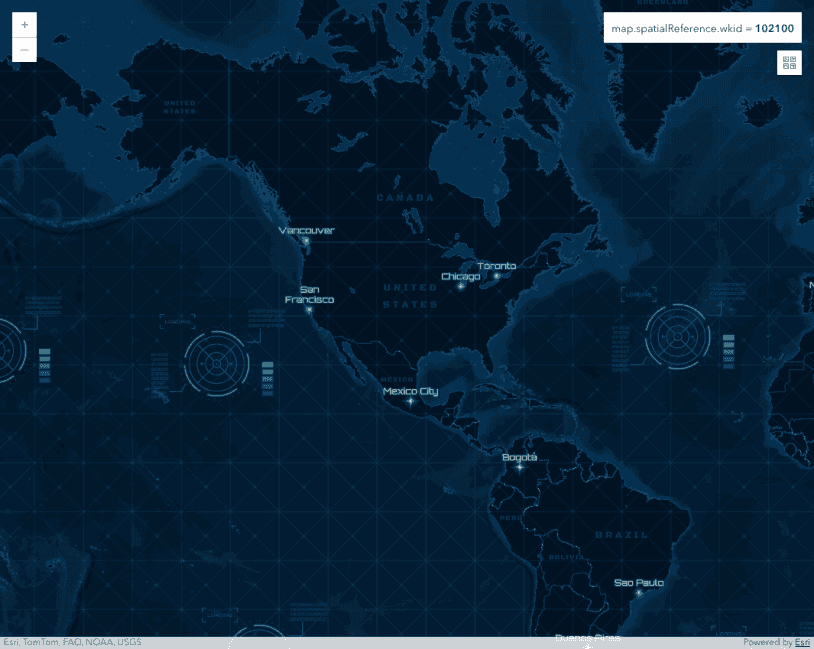
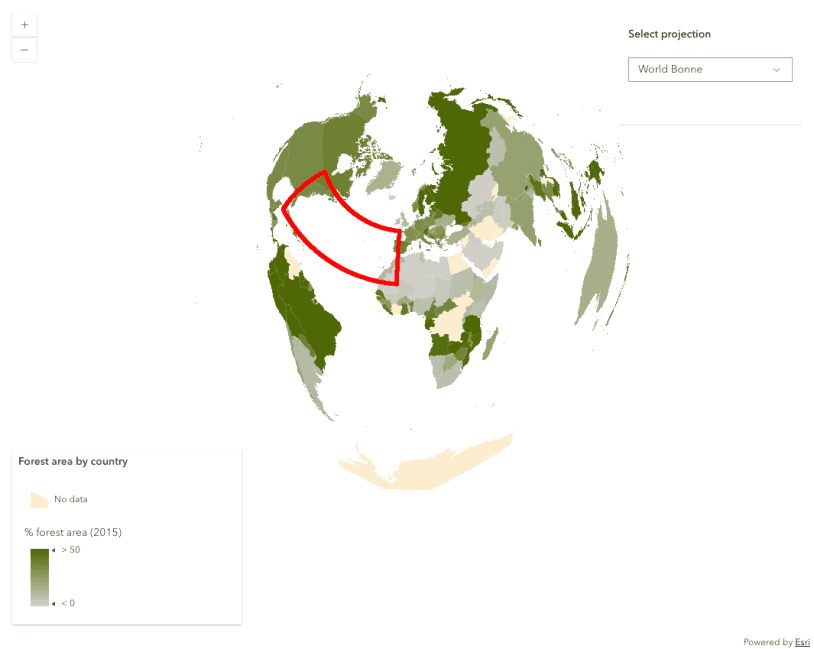
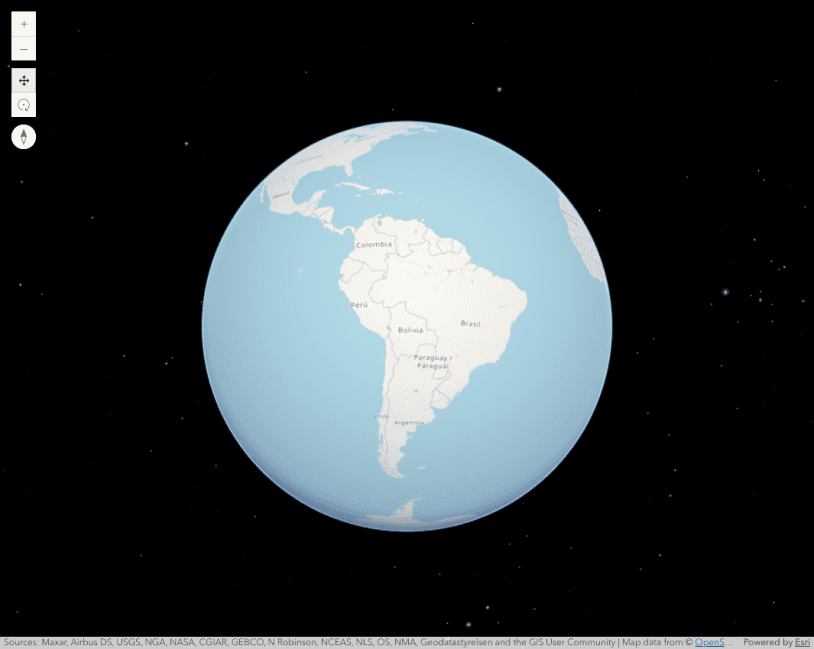
Basemaps with different projections


Map padding
Adjust the padding in the map to work with a subsection of the view
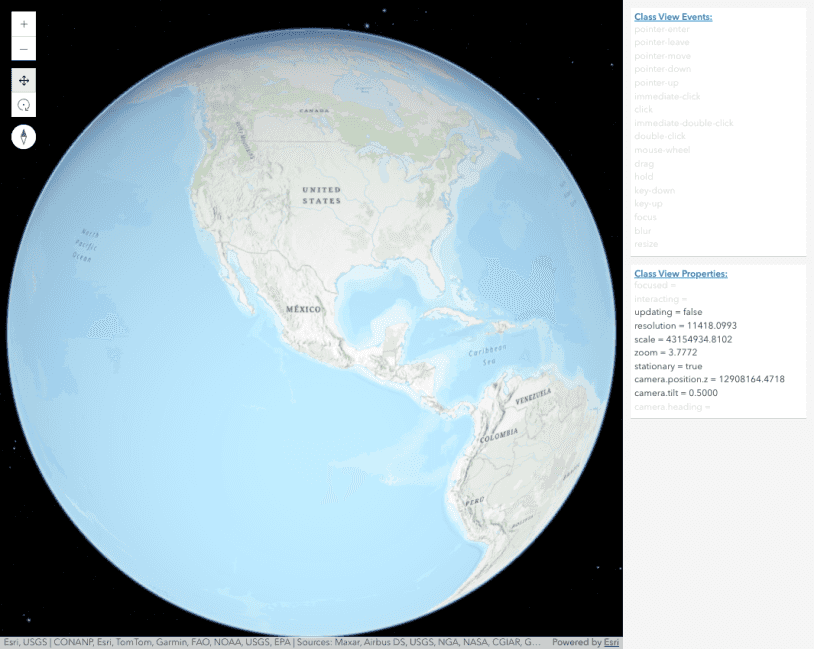
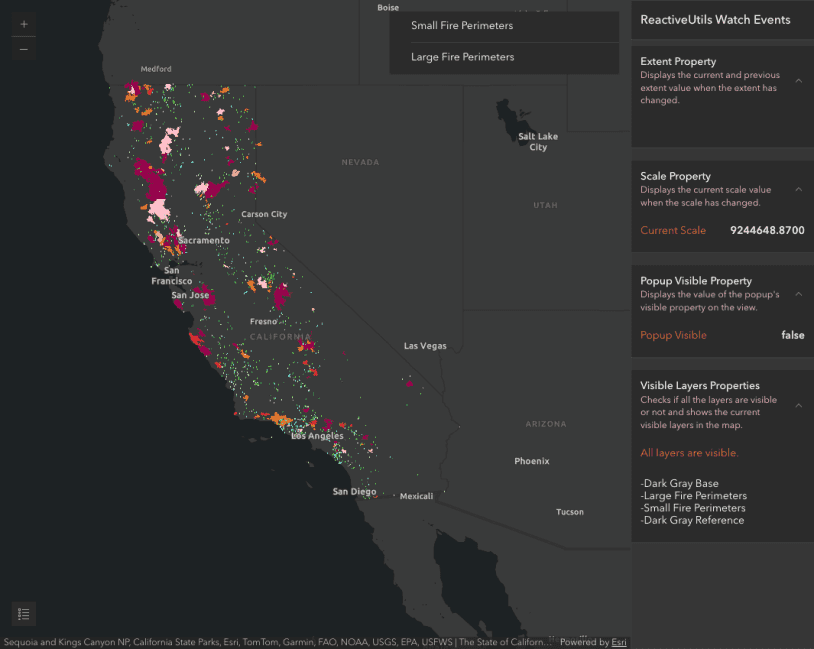
View event explorer / watch properties
Event explorer / watch properties
Layers
Intro to FeatureLayer

Add or remove graphics from a FeatureLayer
Working with large feature collections
What to do to keep your app interactive when working with large feature collections.

Highlight point features
Apply effects to features

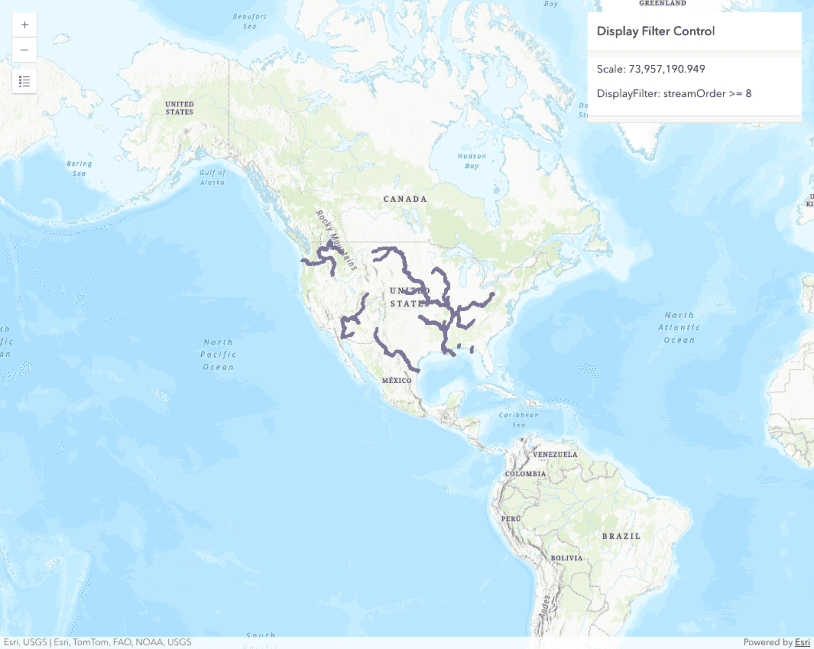
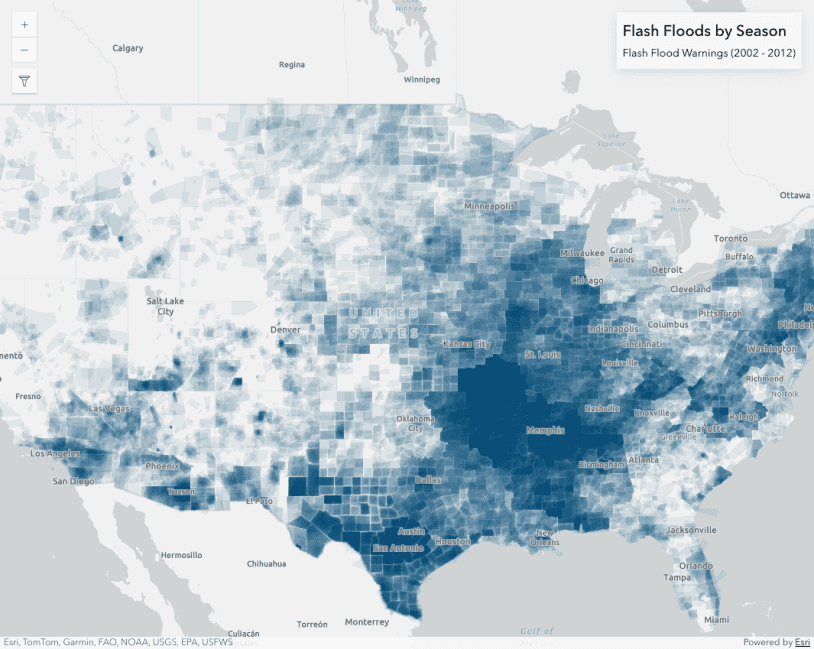
Scale dependent DisplayFilter
Apply a scale-dependent display filter to a feature layer
Intro to SceneLayer
Filter SceneLayer with FeatureFilter
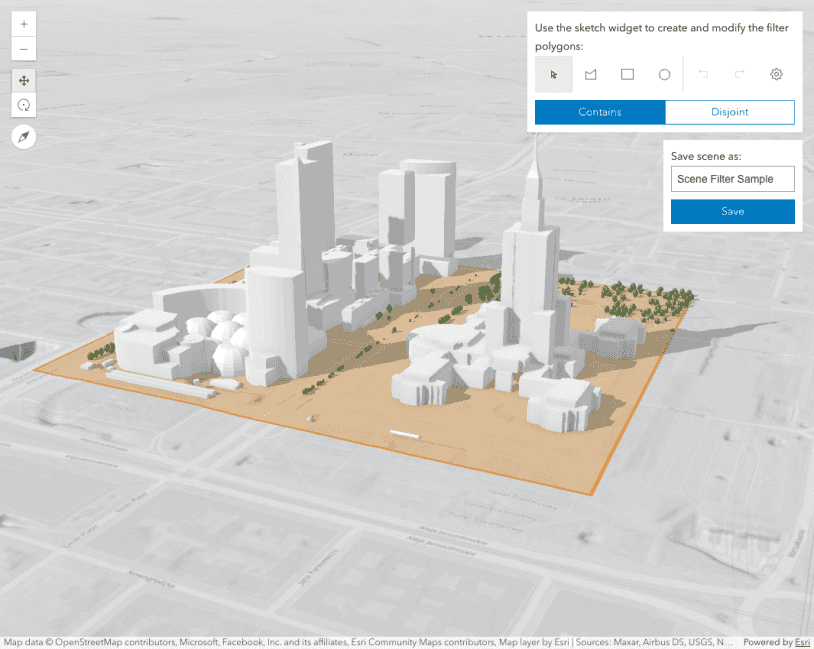
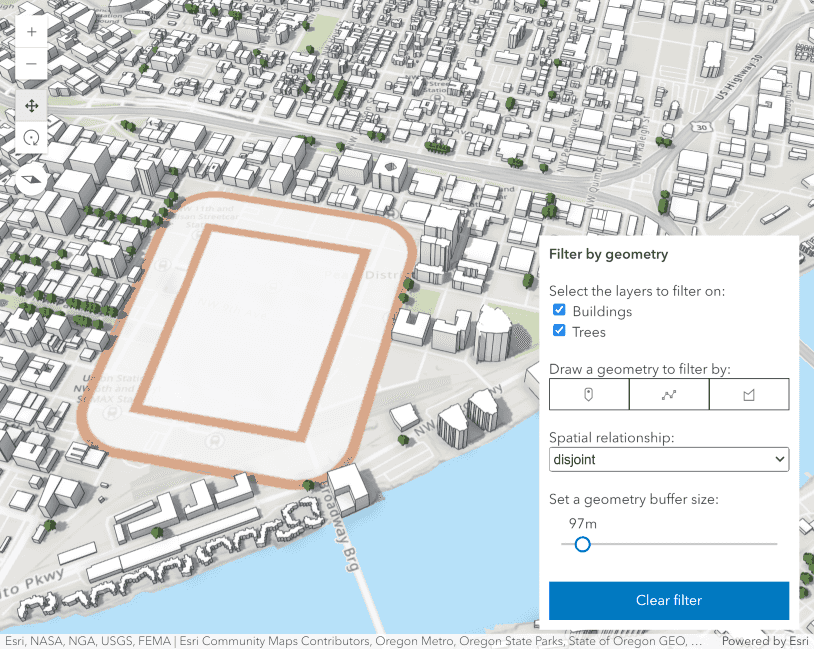
Filter SceneLayer with SceneFilter

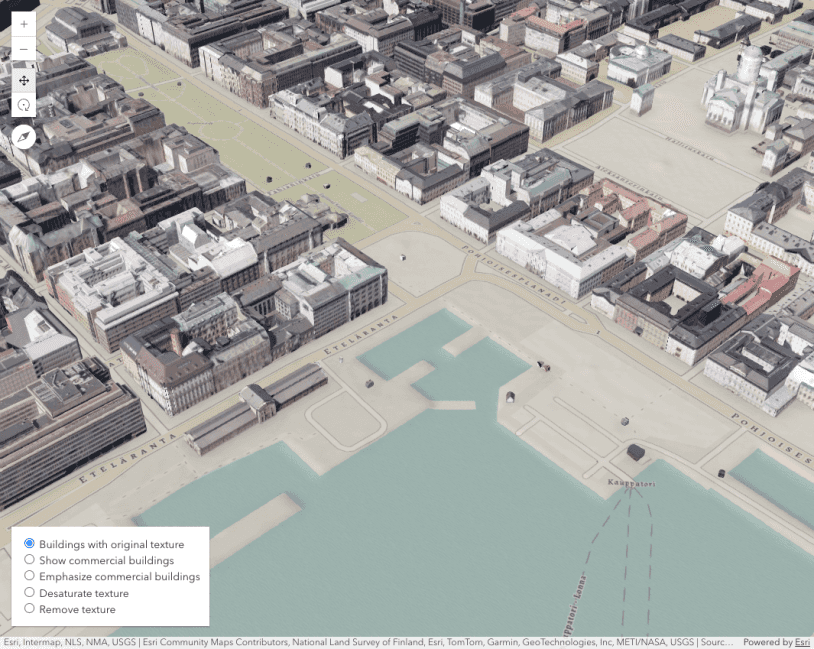
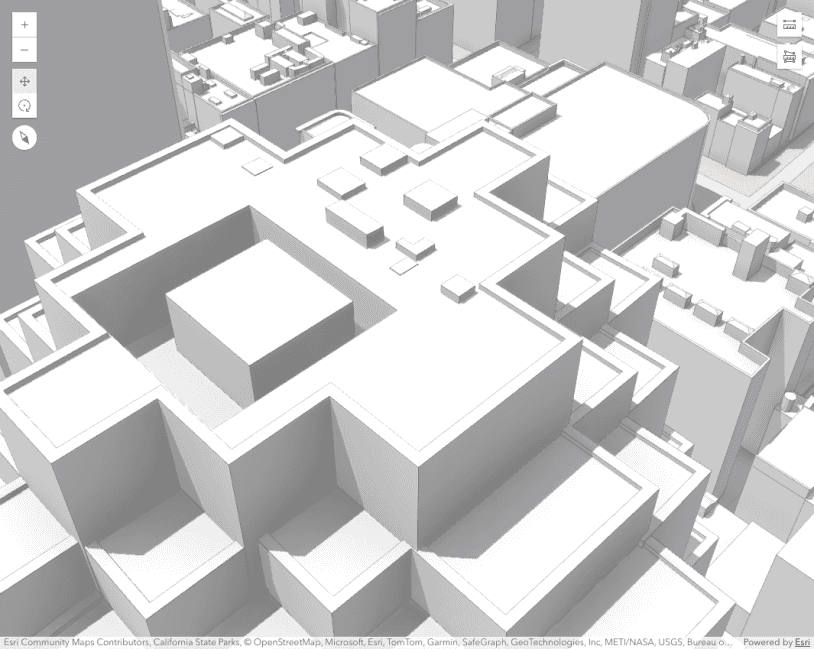
Coloring options for textured buildings
Add edges to a SceneLayer


Query client-side 3D extents

SceneLayerView - query statistics by geometry

Highlight SceneLayer

BuildingSceneLayer with Slice component

Filter BuildingSceneLayer with BuildingExplorer

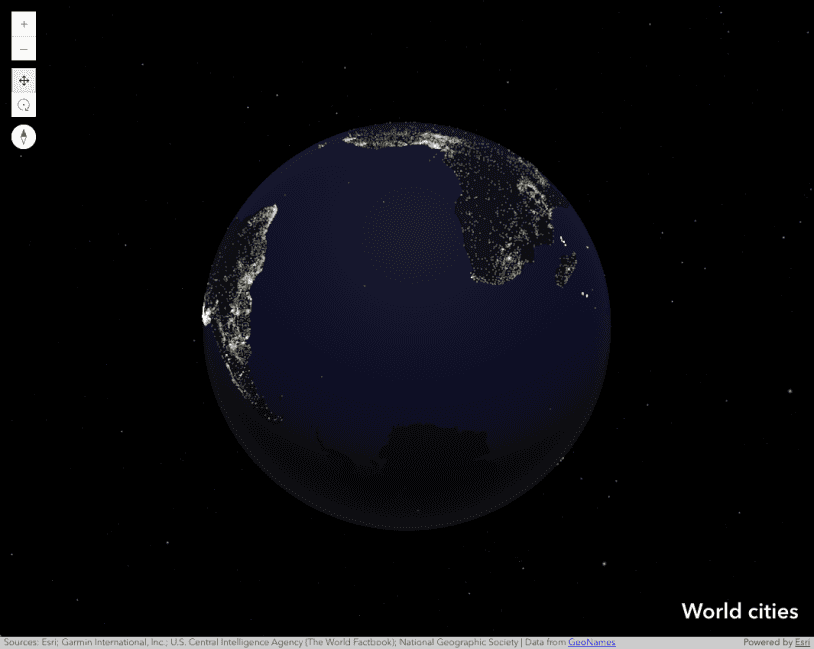
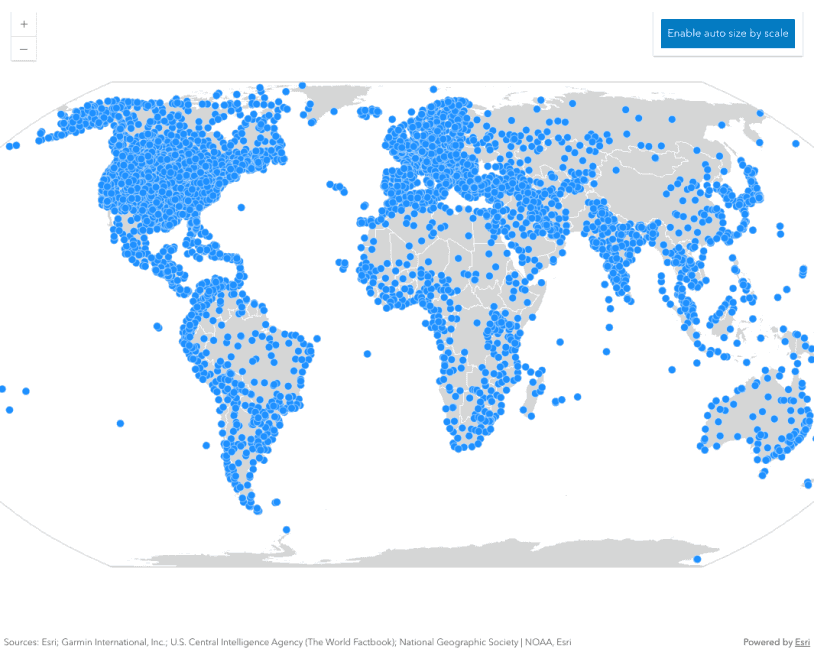
Intro to CSVLayer
CSVLayer - Project points on the fly
Select features by rectangle
GeoJSONLayer
GeoJSONLayer with dynamic URL
Filter features with TimeSlider component
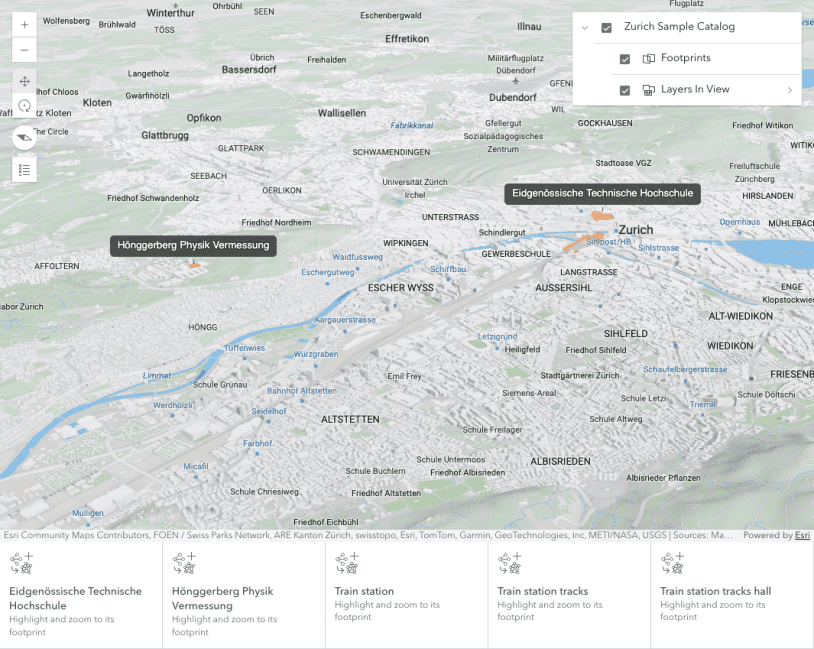

Explore data in CatalogLayer
Intro to ParquetLayer
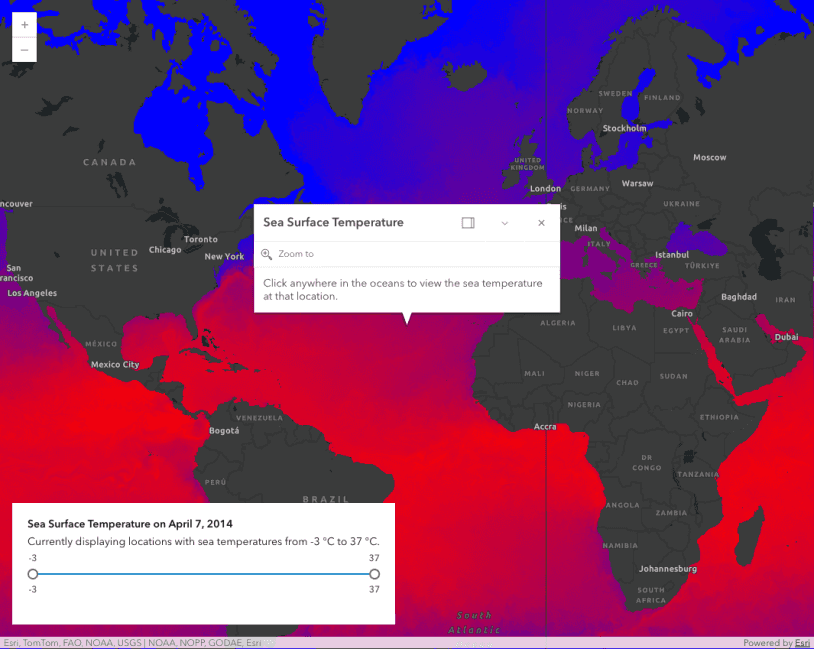
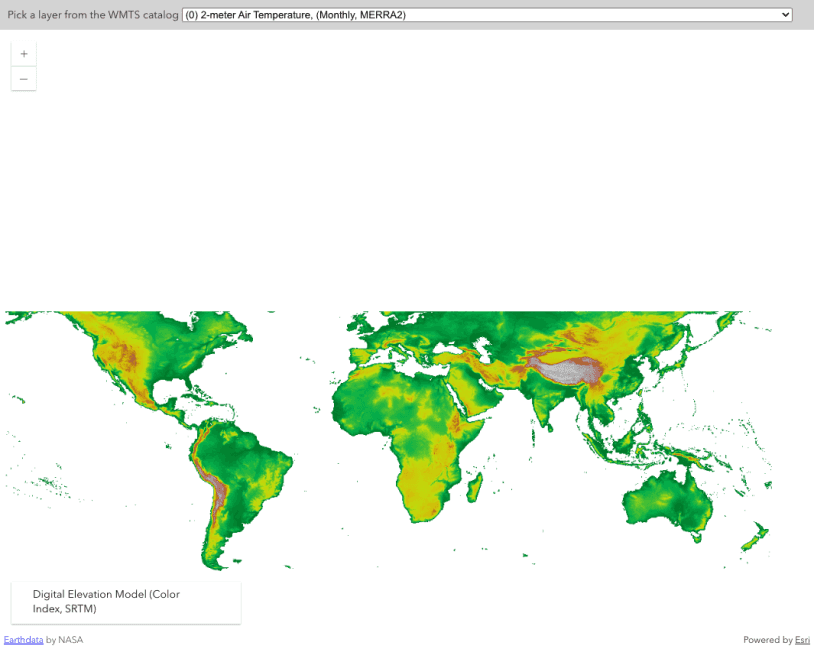
Intro to ImageryLayer
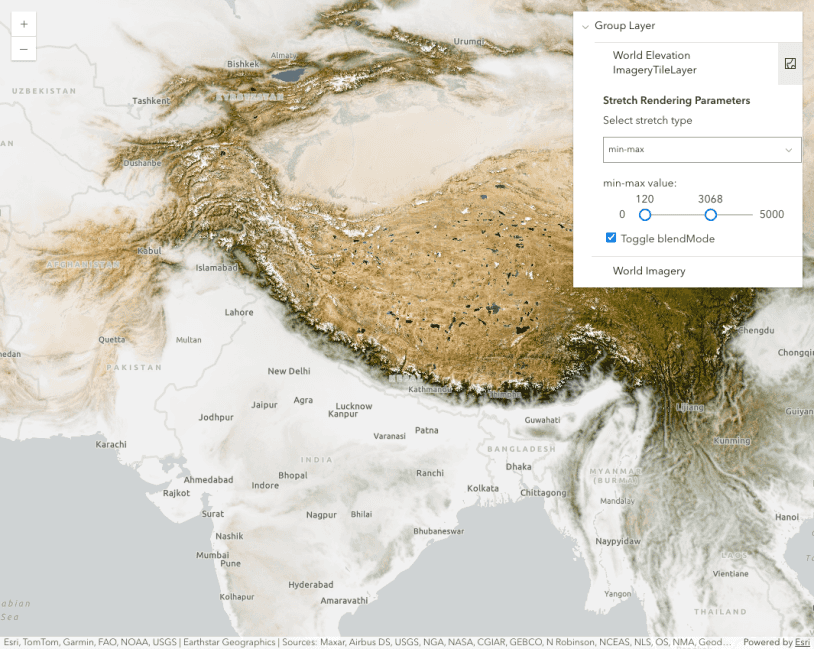
Intro to ImageryTileLayer

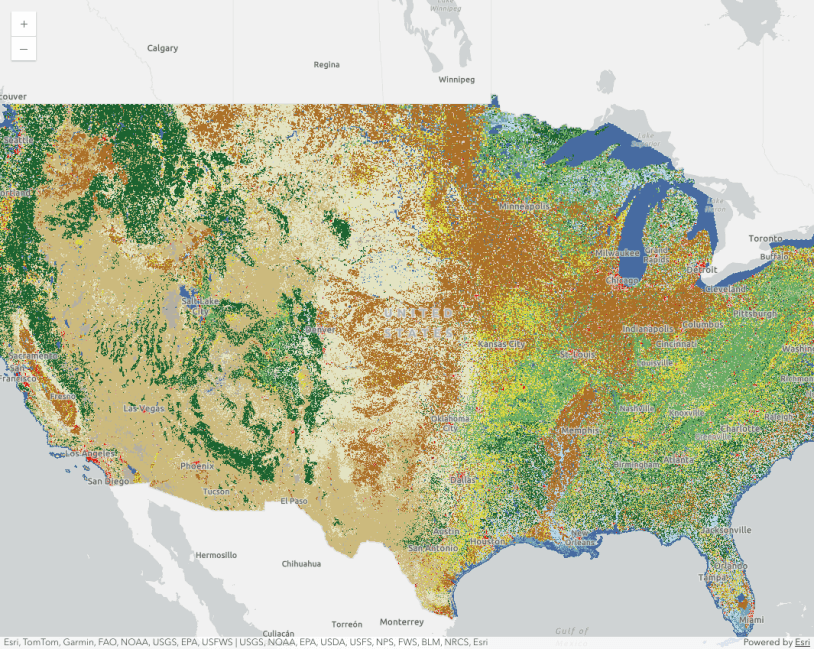
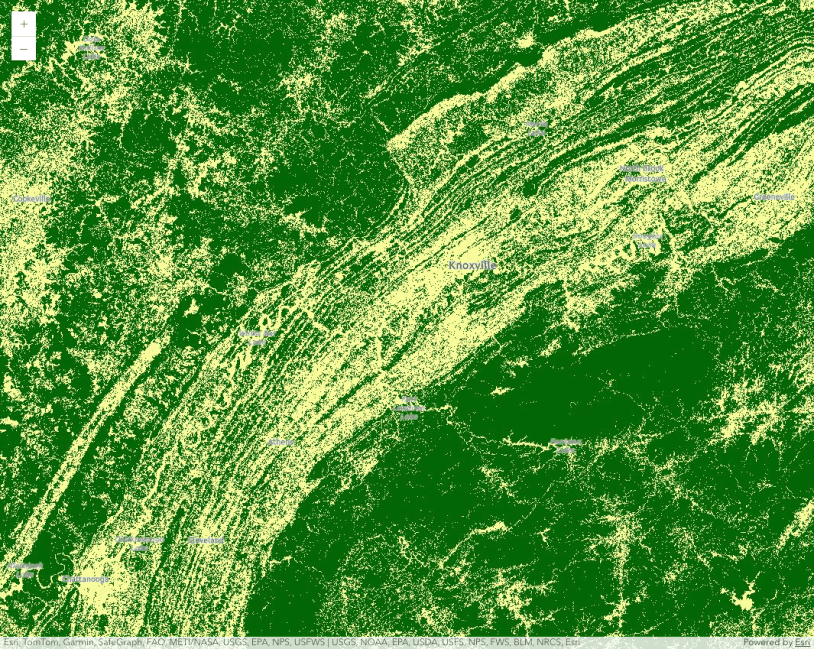
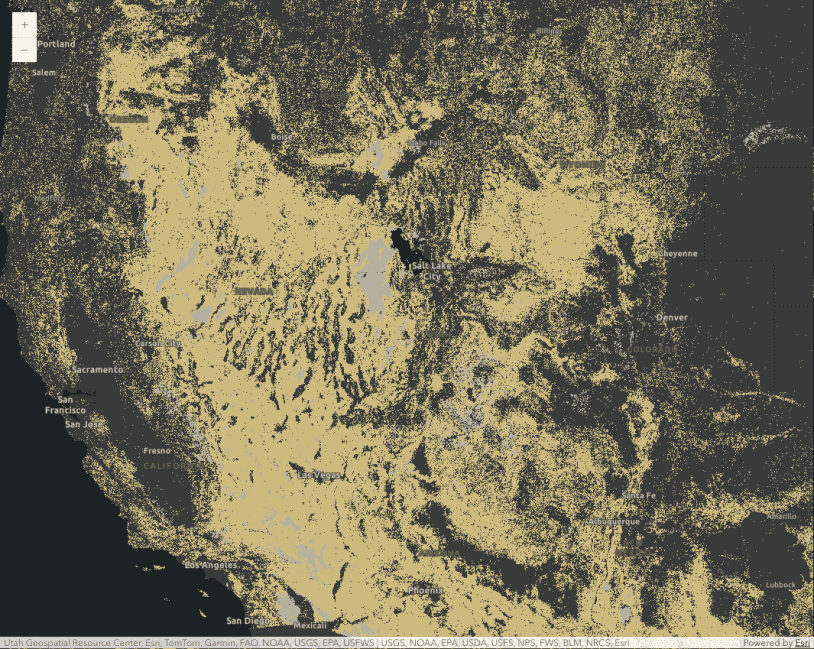
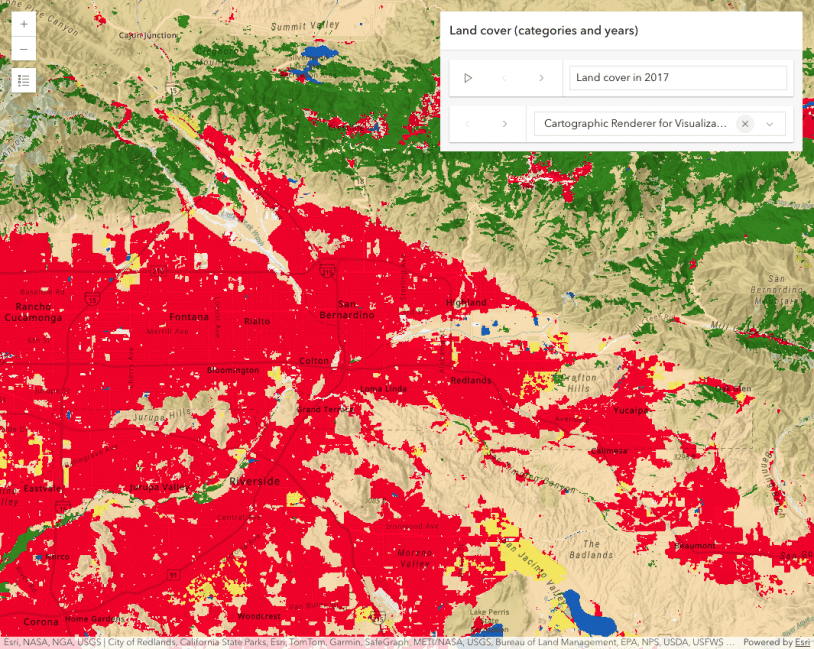
Hosted land cover ImageryTileLayer


Intro to WCSLayer
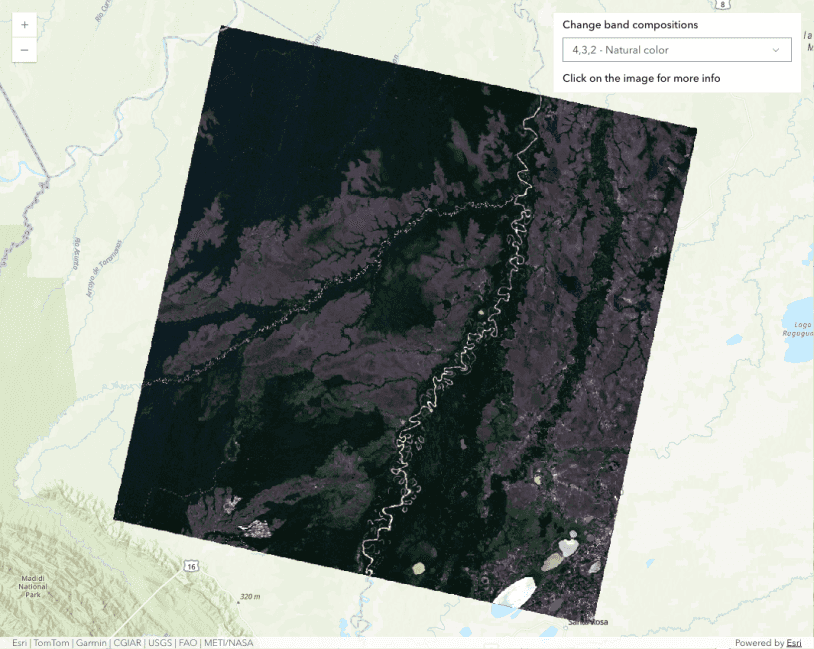
ImageryTileLayer with Cloud Optimized GeoTiff


ImageryTileLayer - shaded relief renderer

Transposed multidimensional ImageryTileLayer
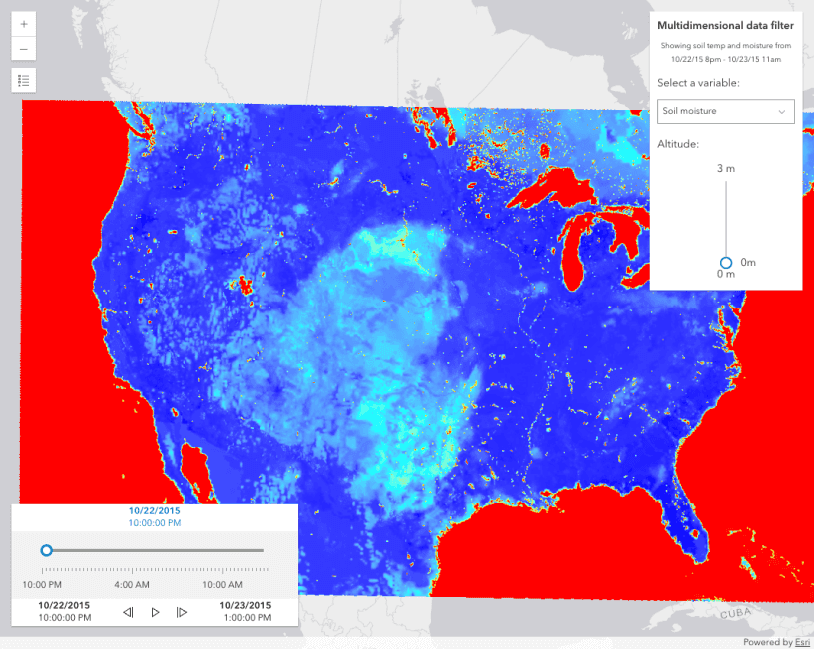
Multidimensional ImageryTileLayer
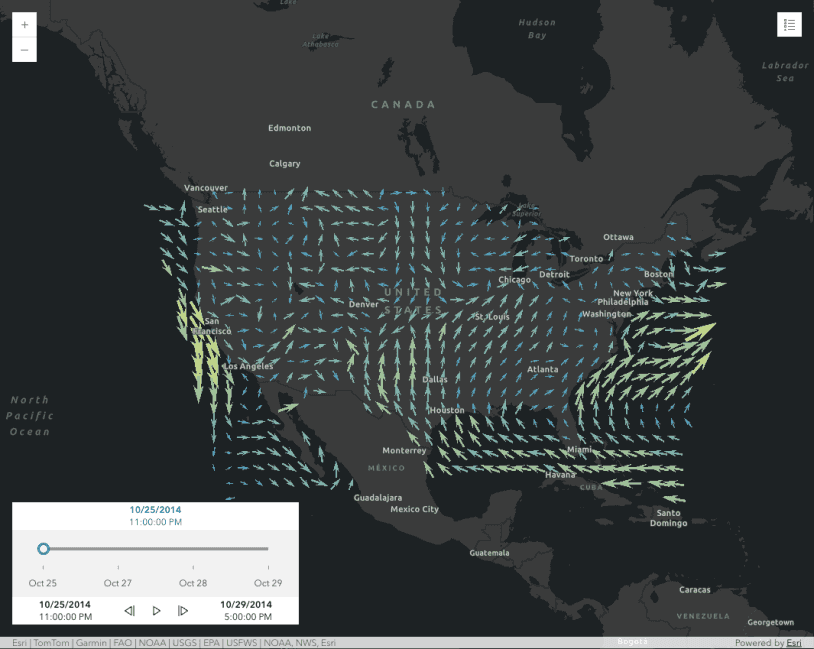
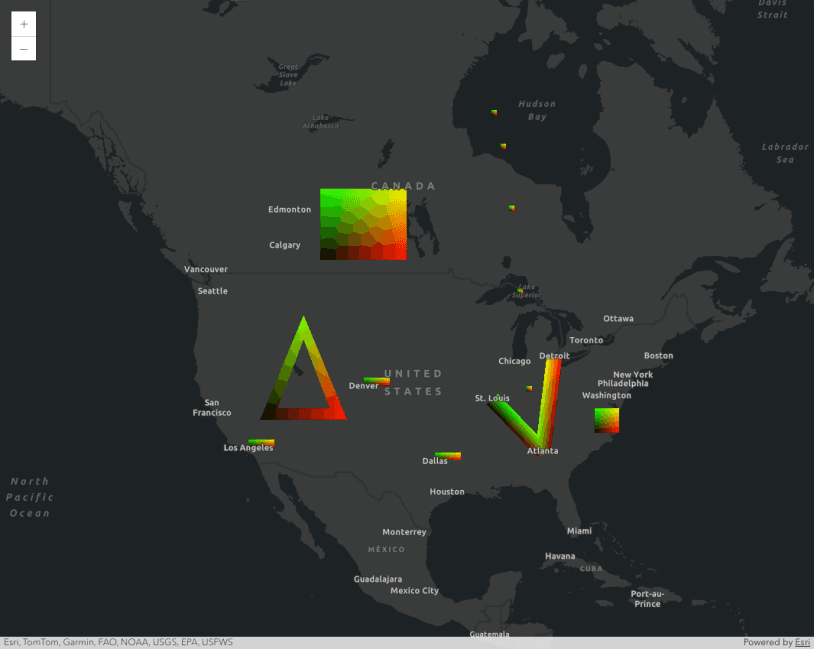
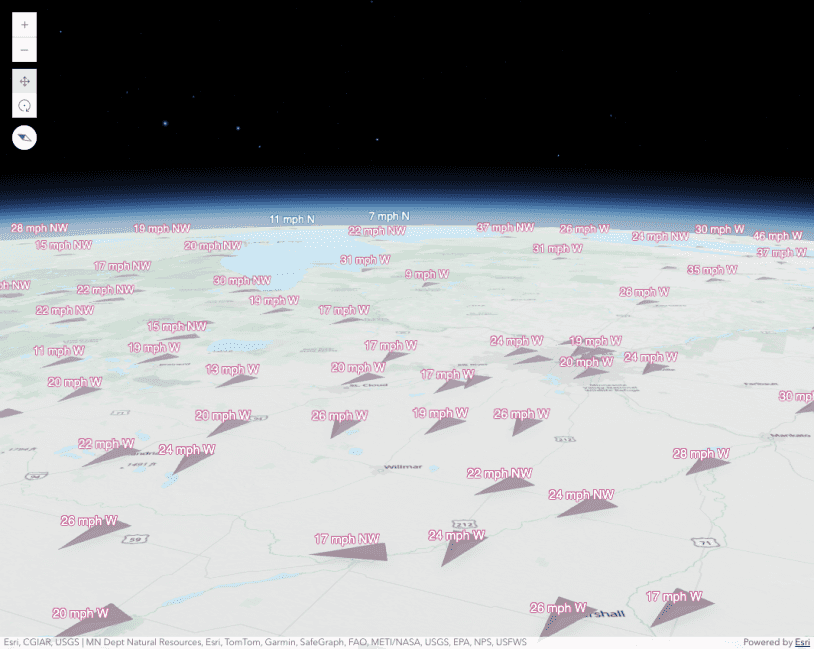
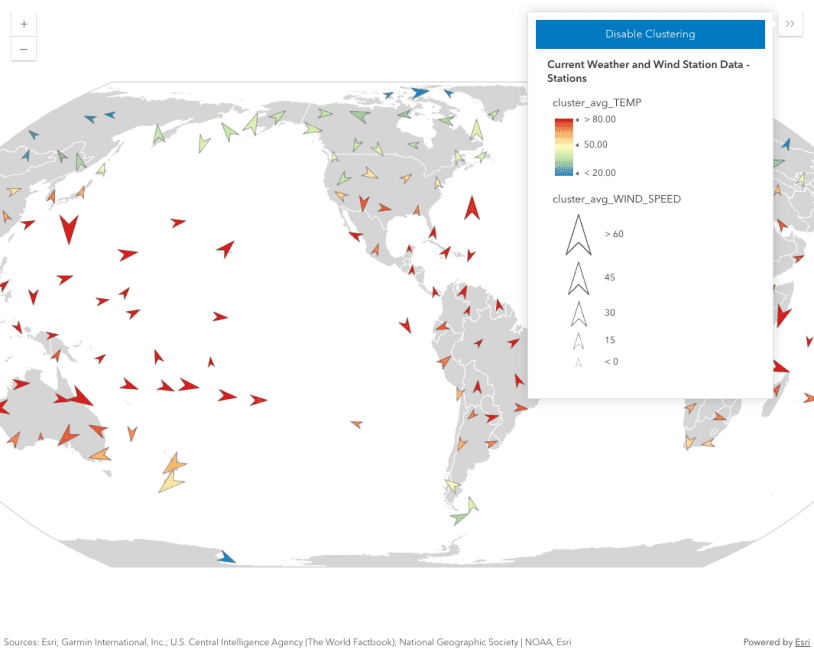
Visualizing wind data with VectorFieldRenderer

FlowRenderer with visual variables

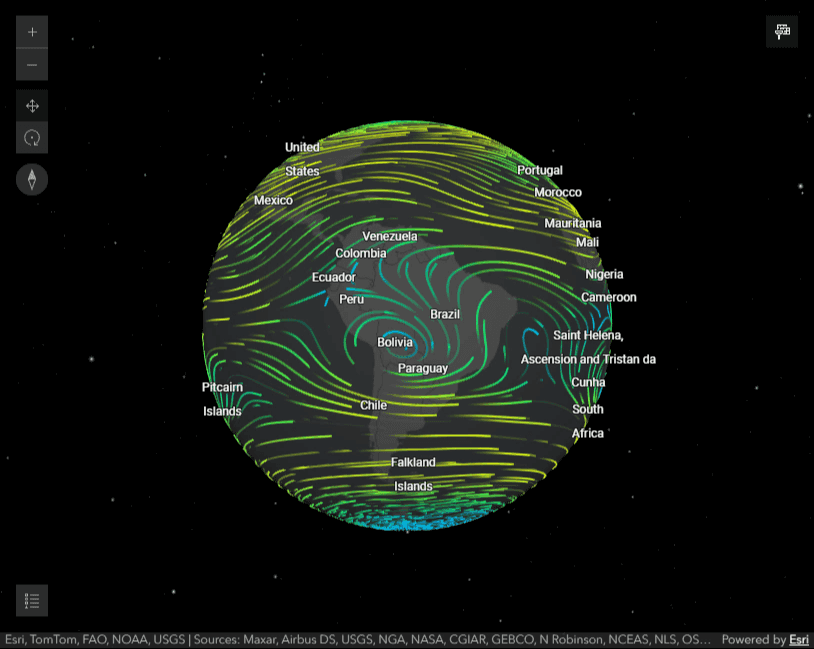
FlowRenderer in a 3D scene
This sample demonstrates how to use the FlowRenderer on an ImageryTileLayer within a 3D scene and how to filter its dimensions.
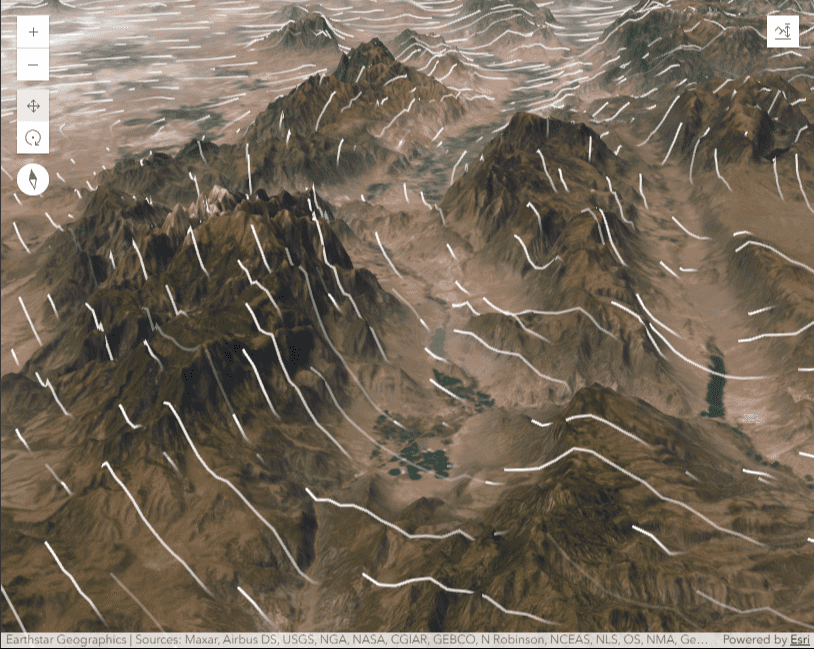
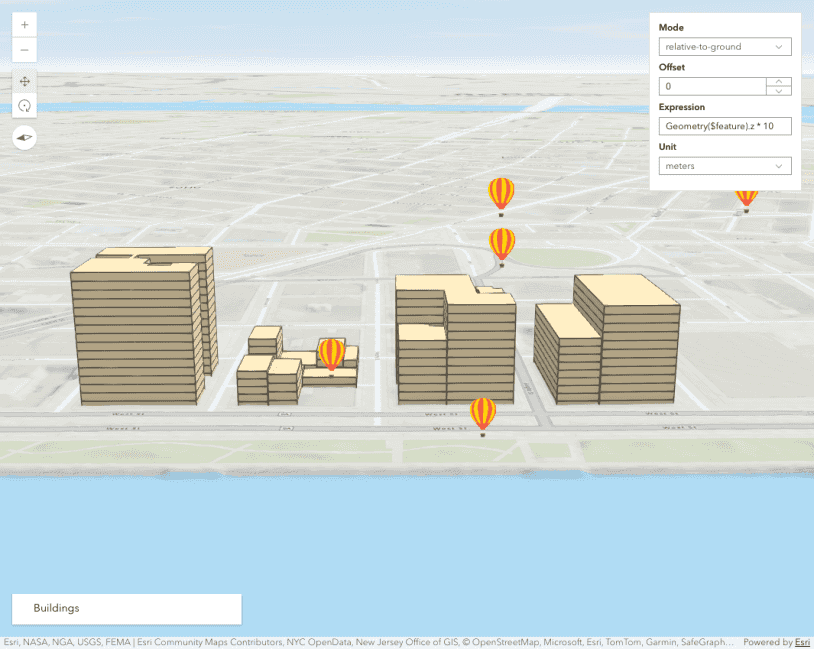
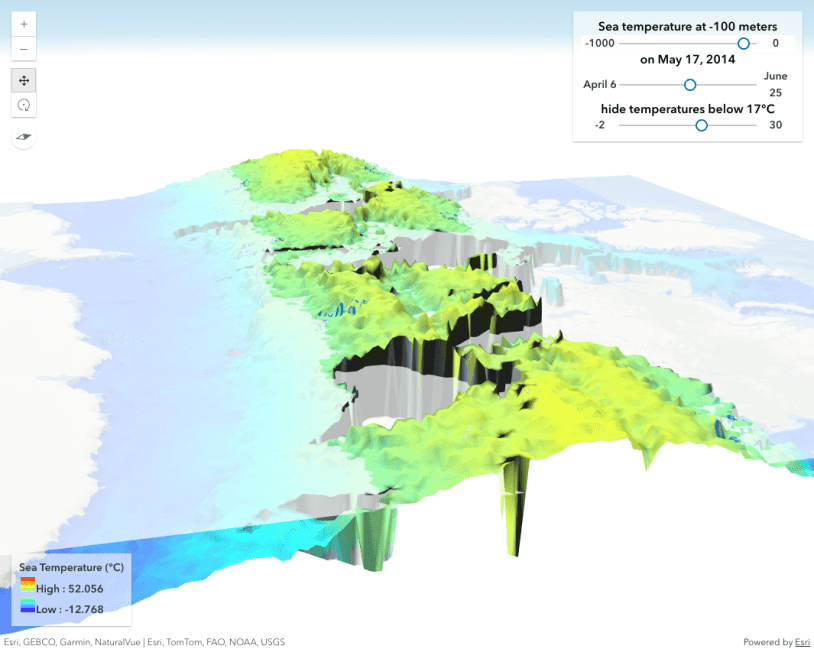
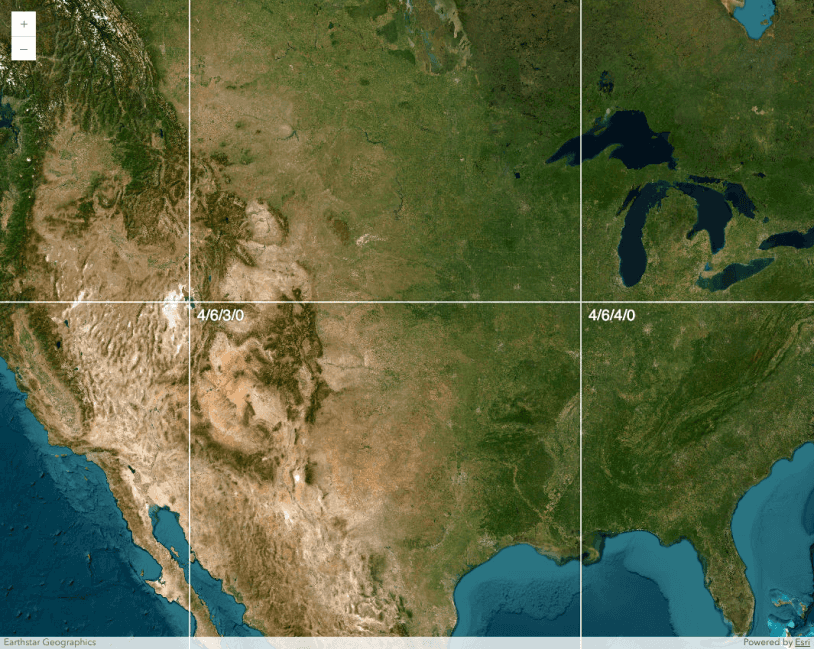
FlowRenderer with elevation modes
This sample demonstrates how to use the FlowRenderer on an ImageryTileLayer in a 3D scene and visualize it at different elevation modes.


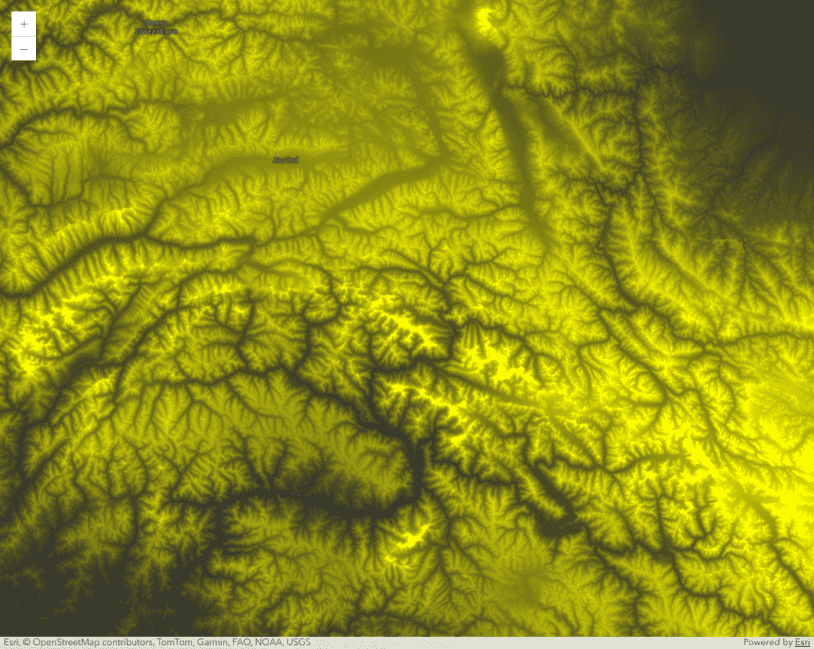
Toggle ground elevation
Elevation options

ElevationLayer
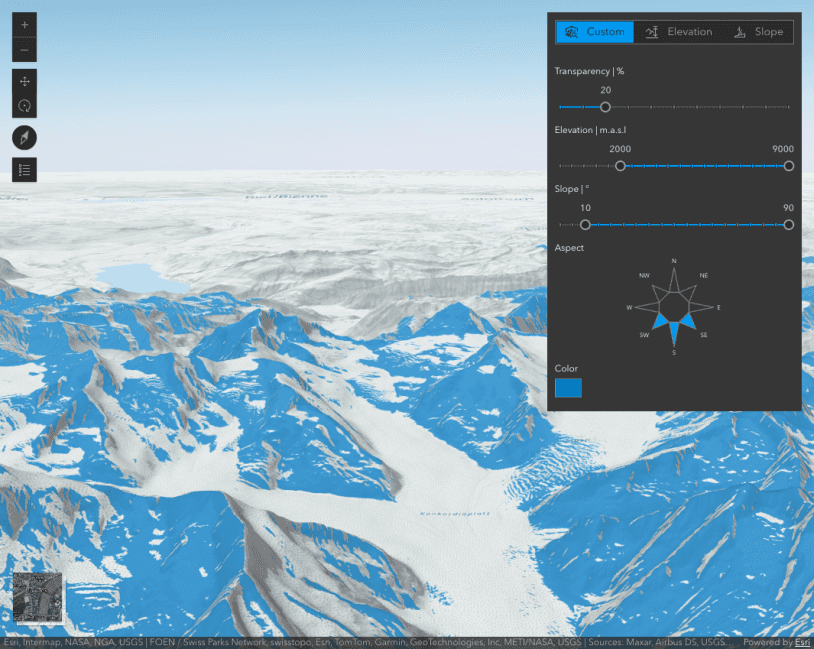
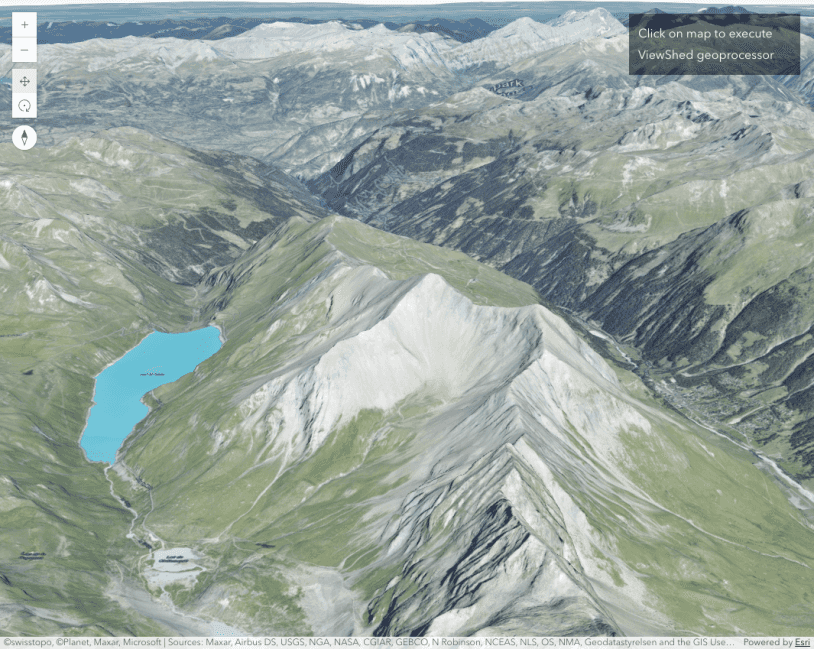
Terrain analysis with raster functions
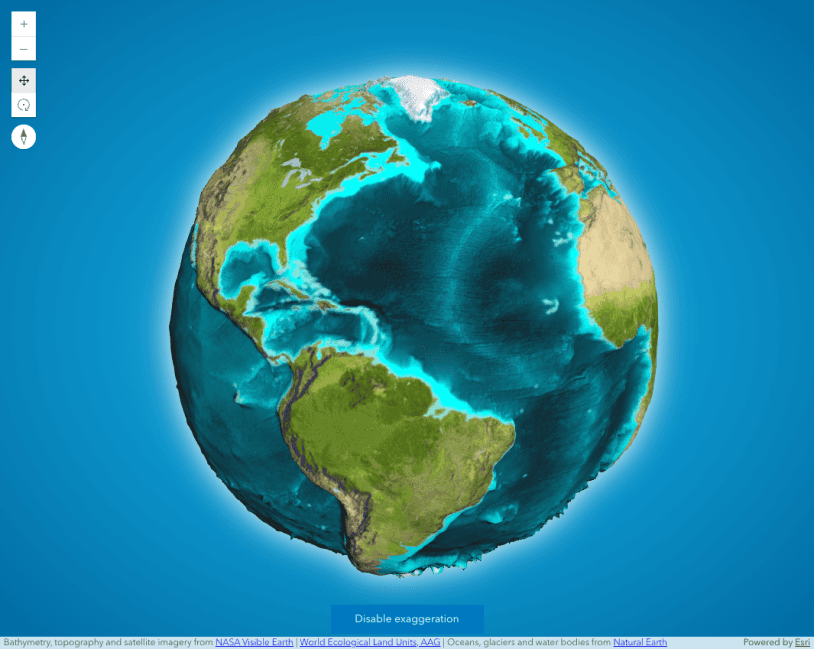
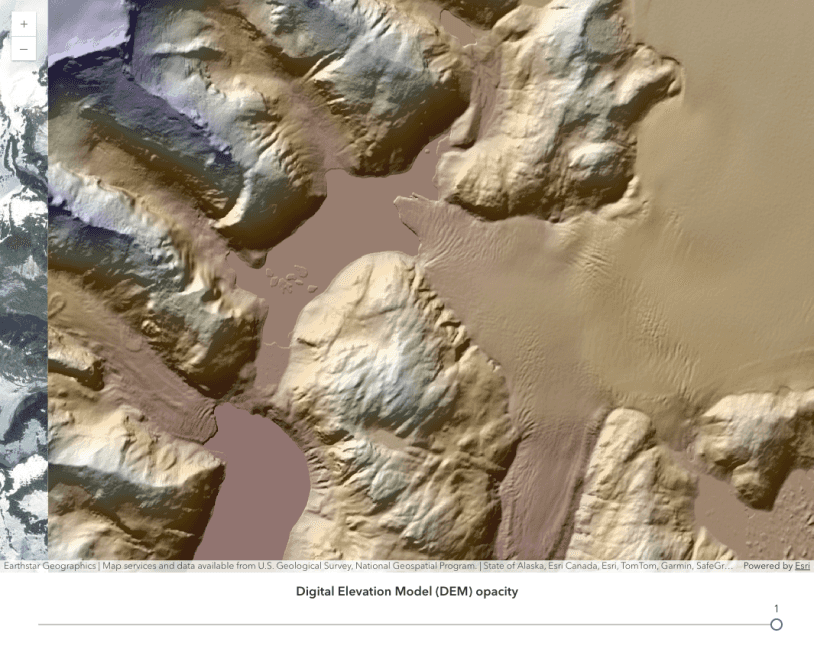
Custom ElevationLayer - Exaggerating elevation
Custom ElevationLayer - Thematic data as elevation

IntegratedMesh3DTilesLayer
Integrated mesh modification
IntegratedMeshLayer
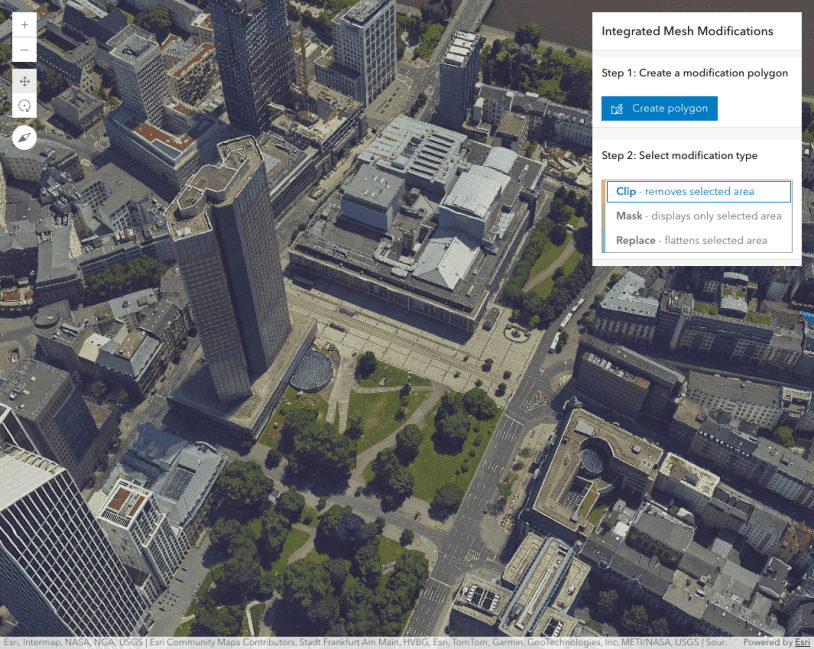
Integrated mesh modification

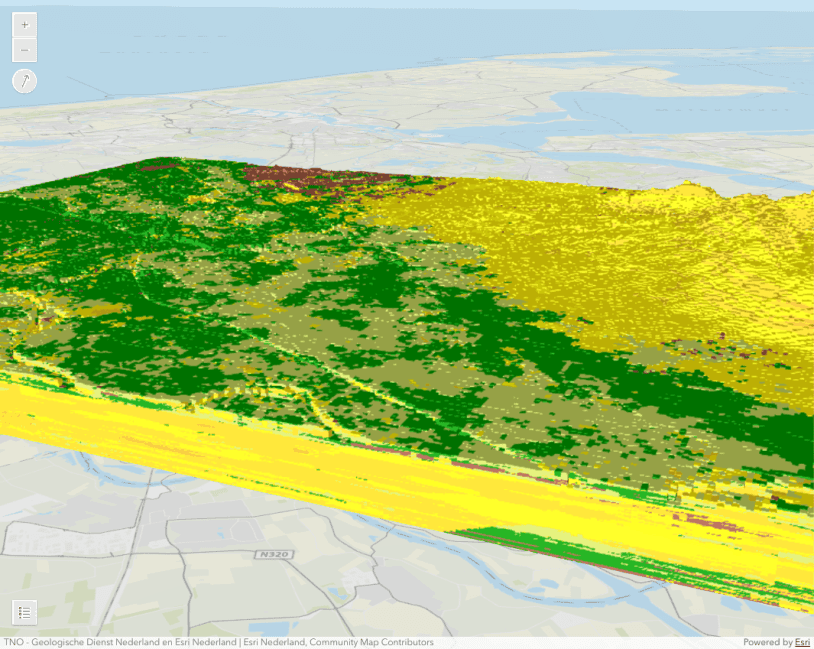
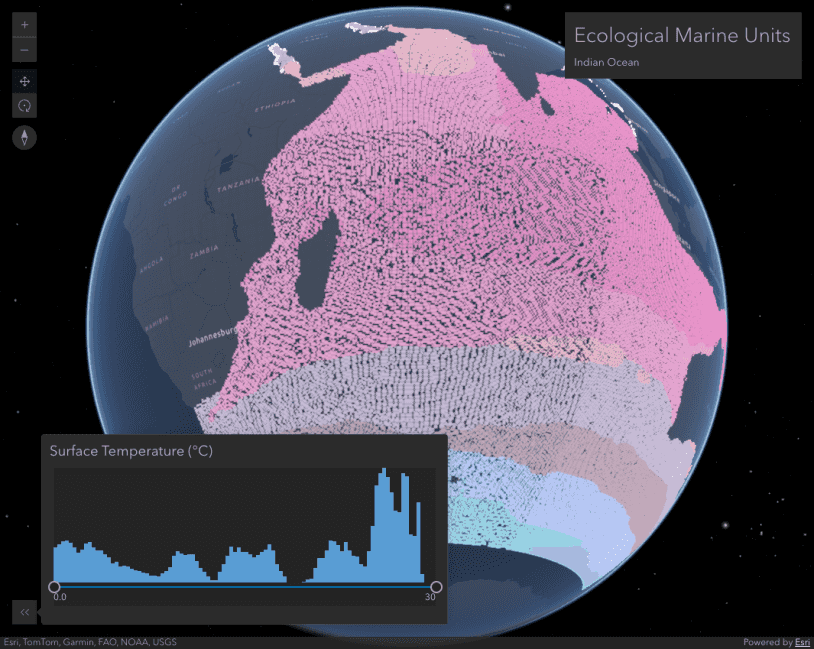
Intro to VoxelLayer
VoxelLayer variable and render mode
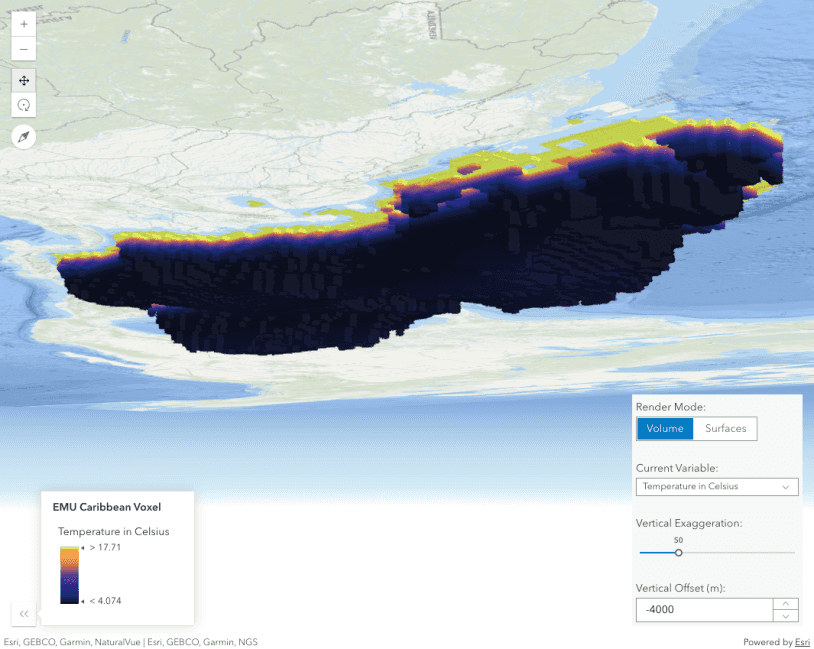
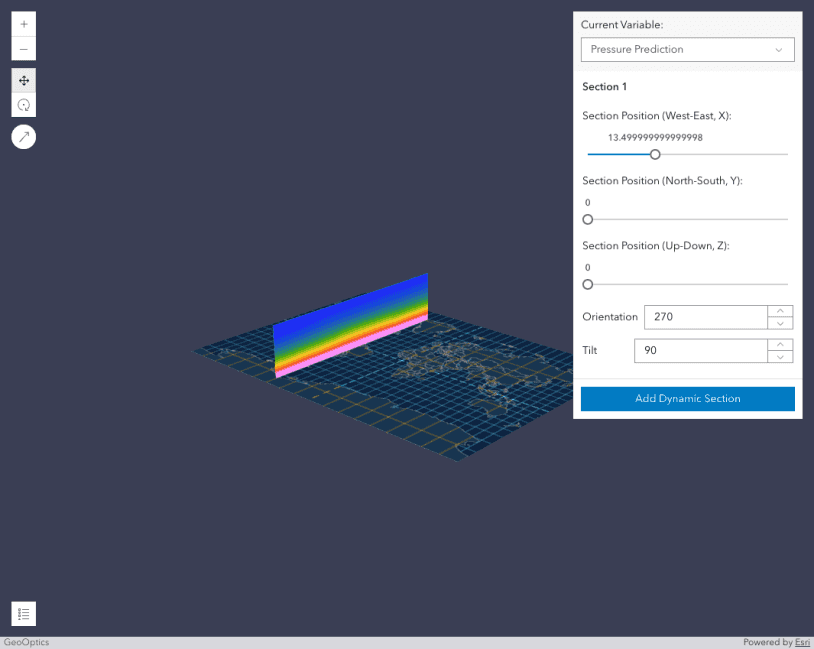
VoxelLayer variable, render mode, vertical exaggeration, vertical offset

Create area of interest for VoxelLayer
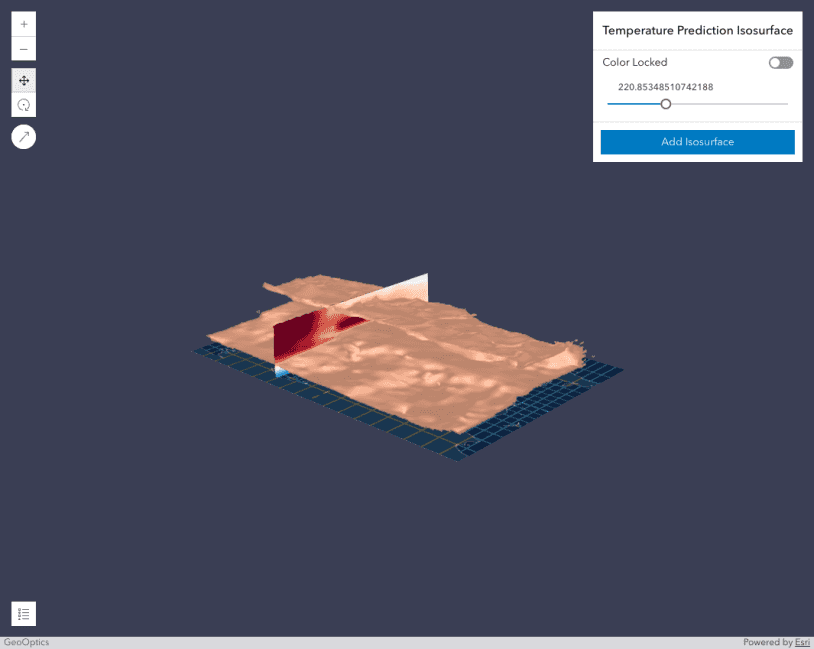
Explore a VoxelLayer using isosurface
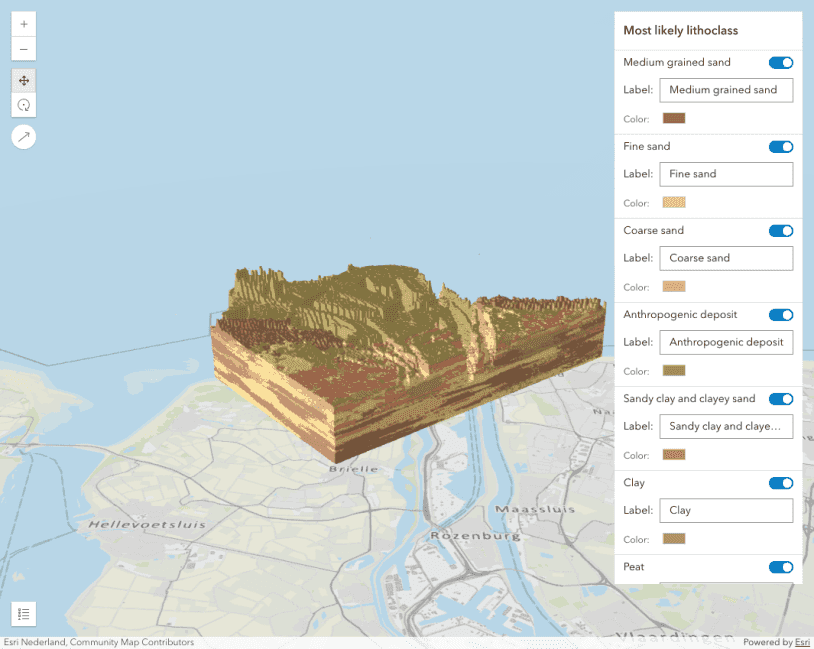
VoxelLayer with discrete variable
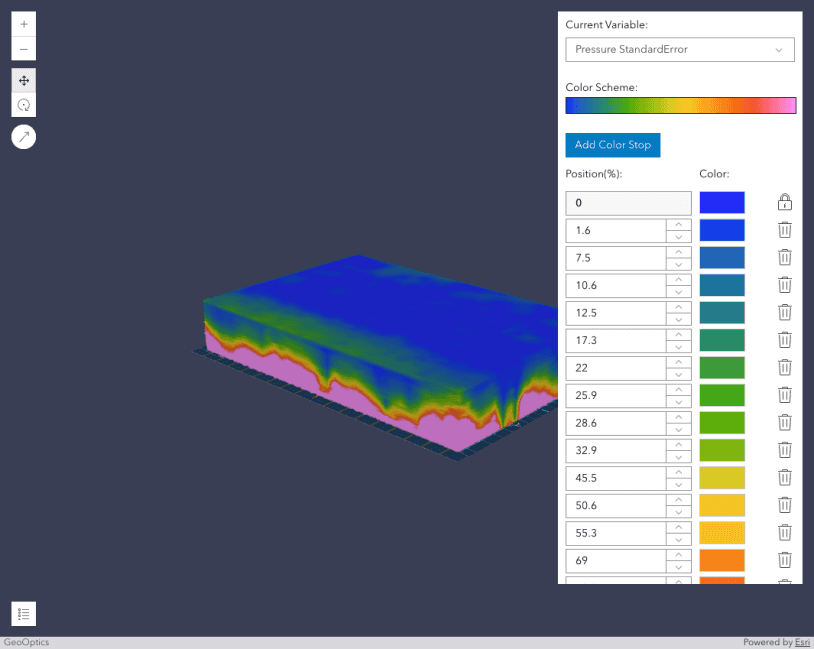
Modify the color scheme of a continuous variable
VoxelLayer Color Stops for continuous variable
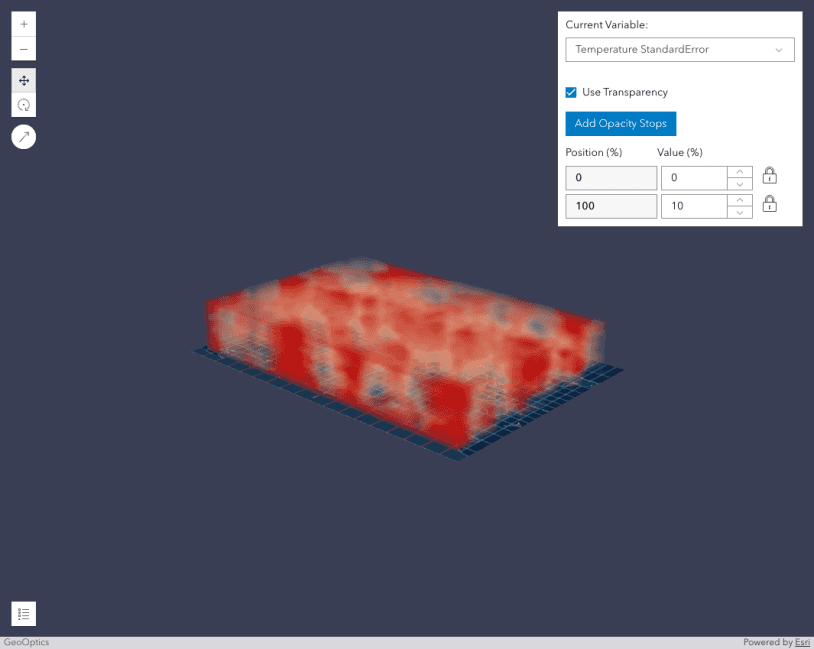
Modify the opacity of a continuous variable
VoxelLayer Opacity Stops for continuous variable

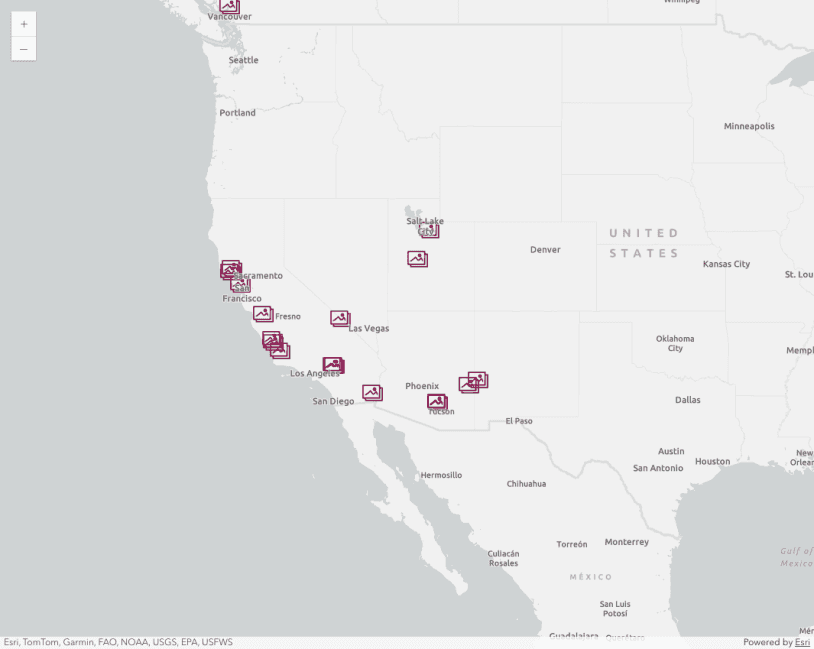
MediaLayer with animated gif

MediaLayer with control points
MediaLayer with images

MediaLayer with interactive georeferencing

MediaLayer with video

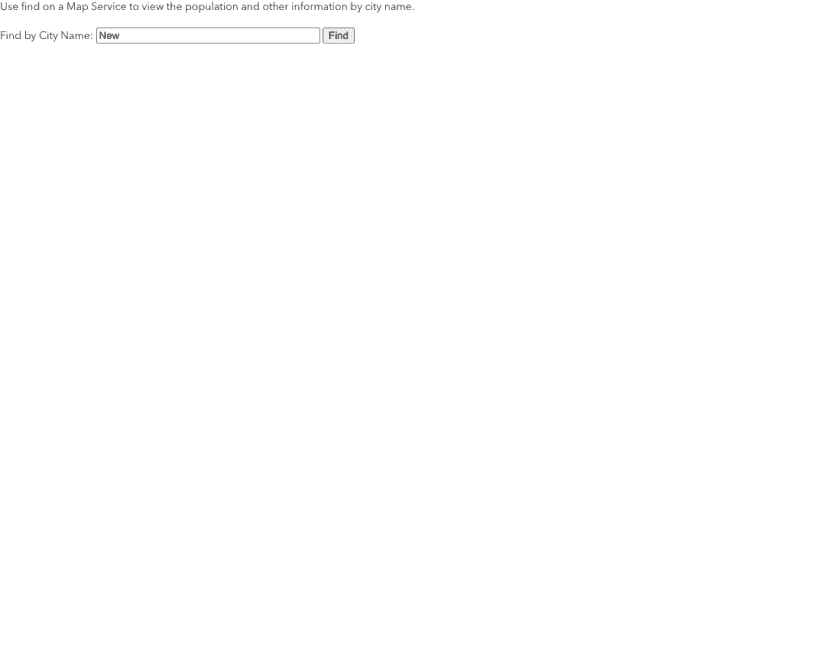
Intro to MapImageLayer


Set definition expressions on sublayers
MapImageLayer - Set definition expressions on sublayers


Dynamic data layer with table join
MapImageLayer - dynamic data layer with table join

Dynamic data layer with query table
MapImageLayer - dynamic data layer with query table
MapImageLayer - Explore data from a dynamic workspace

KMLLayer

OGCFeatureLayer
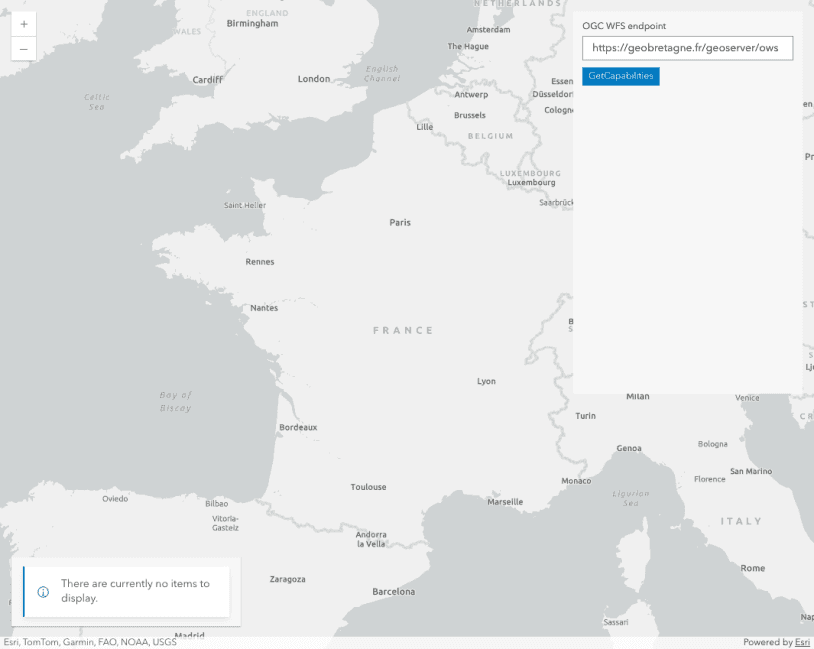
WFSLayer

WMSLayer

WMTSLayer
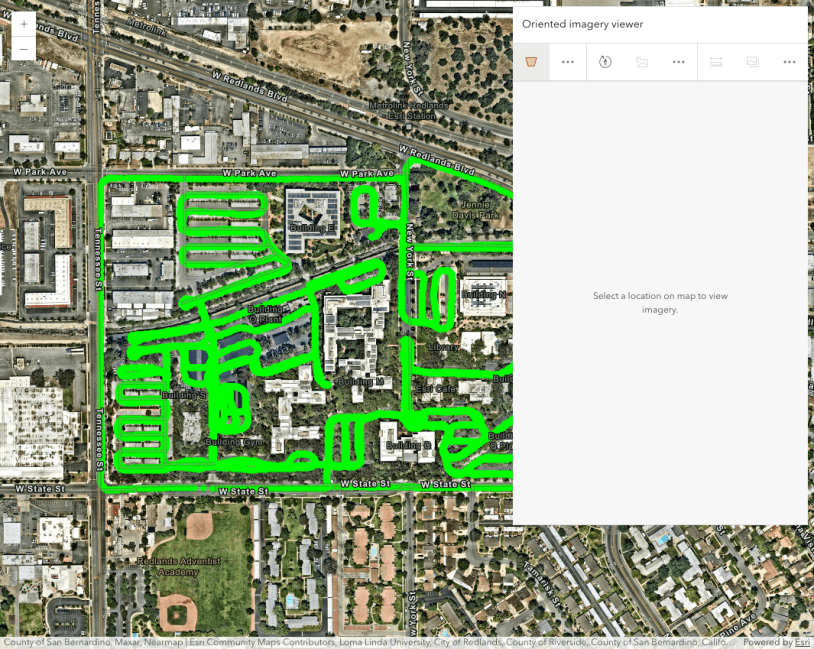
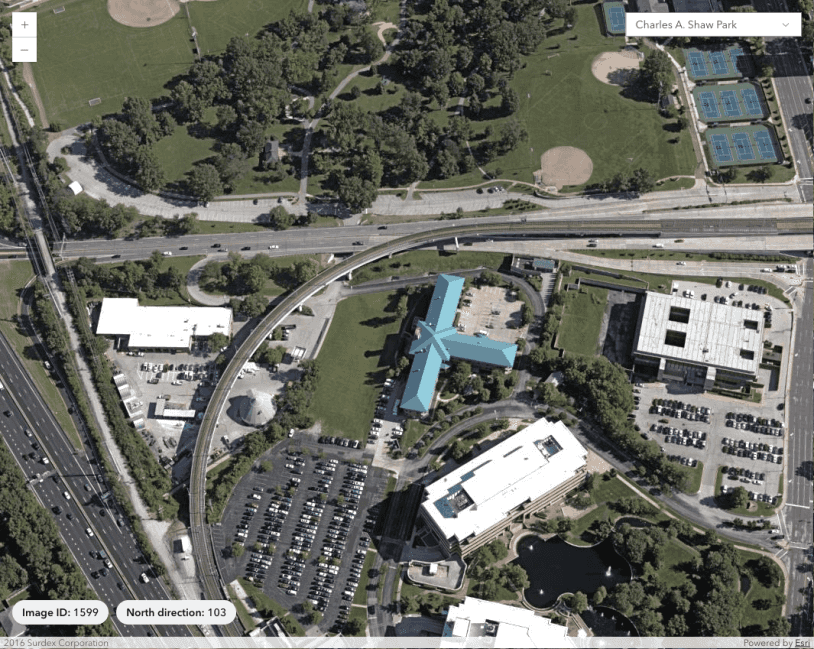
Intro to OrientedImageryLayer
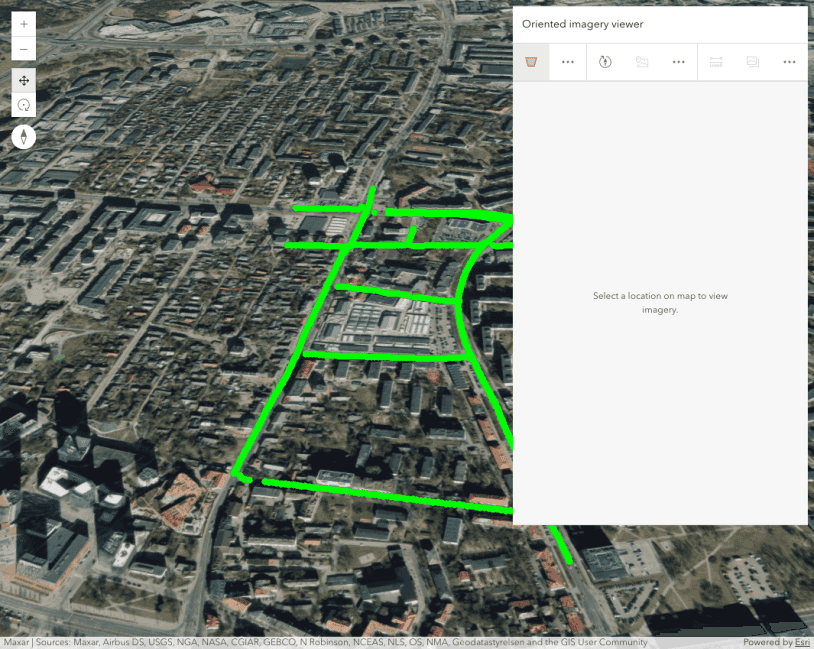
OrientedImageryLayer in SceneView

Data Capture in OrientedImageryViewer
Data Capture in Oriented Imagery Viewer

Intro to PointCloudLayer
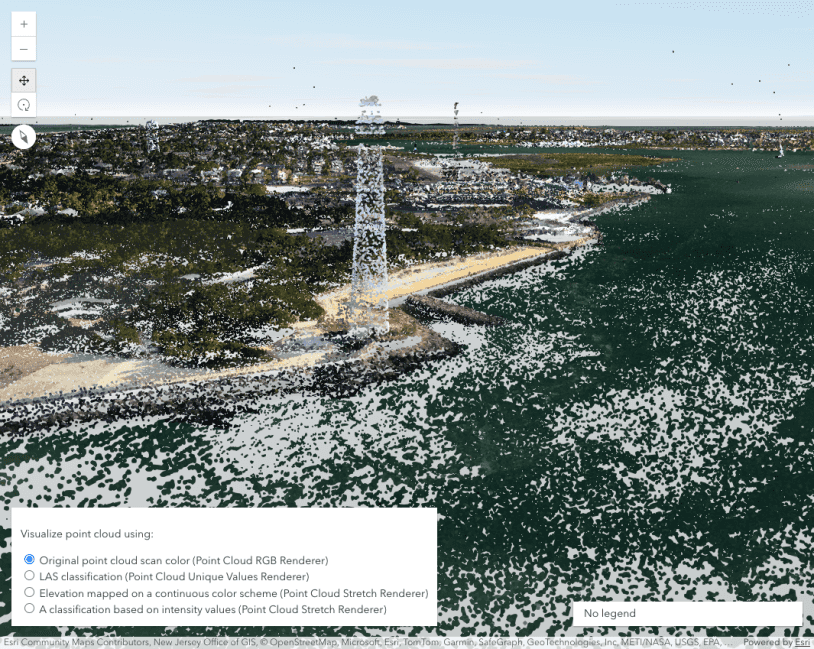


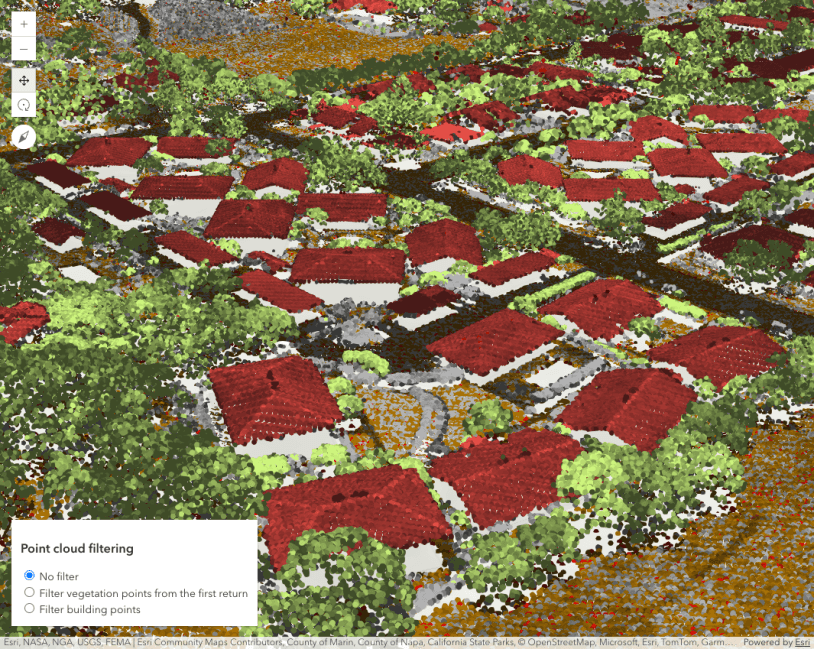
Filter points in a PointCloudLayer
VectorTileLayer
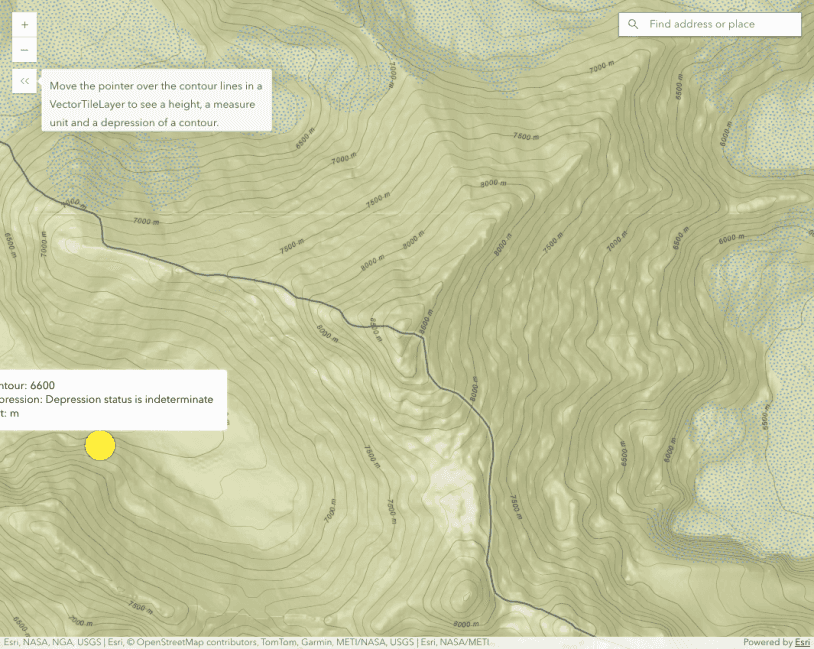
VectorTileLayer hitTest


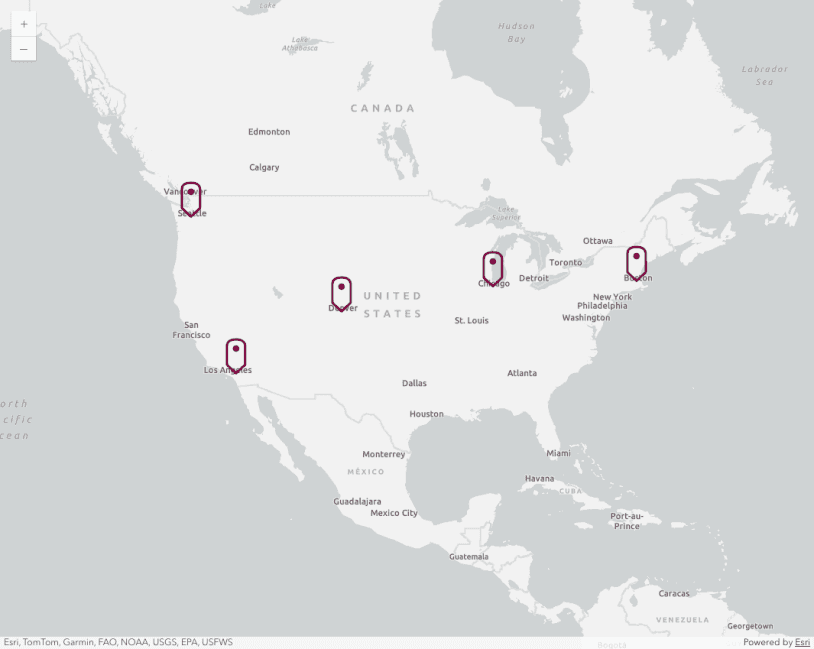
Intro to RouteLayer
Intro to SubtypeGroupLayer

Intro to TileLayer

Custom TileLayer
Custom DynamicLayer
Custom LERC Layer

Custom BlendLayer
Custom ElevationLayer - Exaggerating elevation
Custom ElevationLayer - Thematic data as elevation

Animated lines with WebGL
Tessellation helpers for custom WebGL layer views
Tiling support for custom WebGL layer views
Masking effect using a custom layer view
WebTileLayer

OpenStreetMapLayer

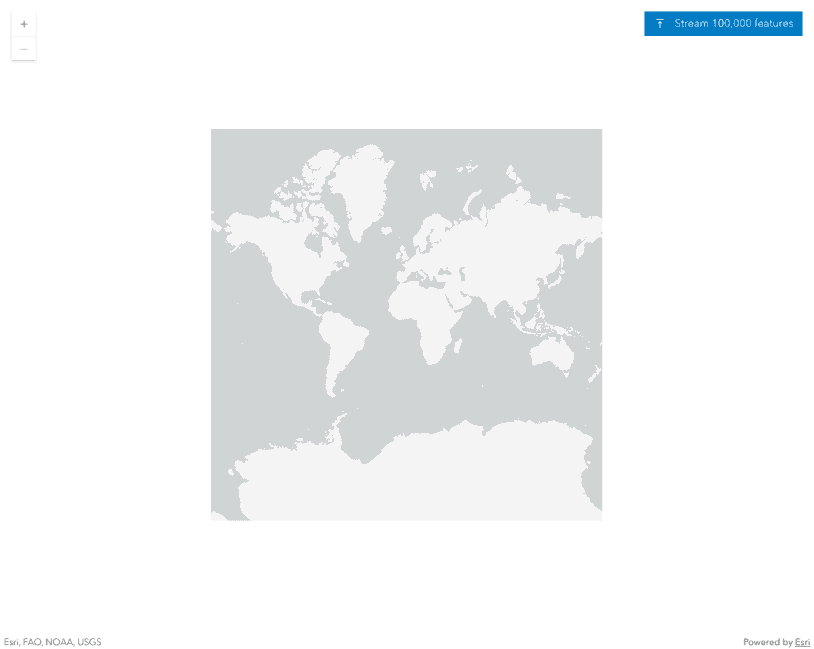
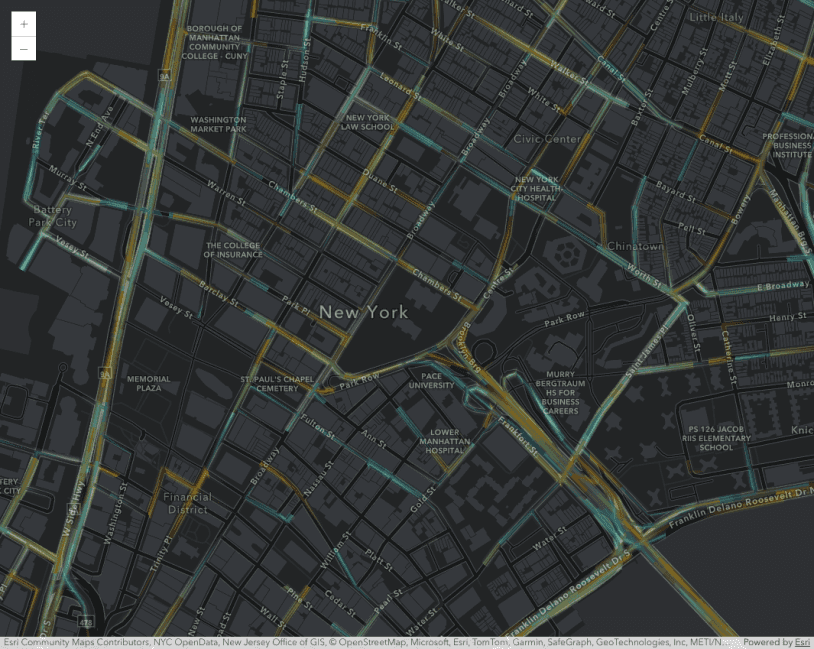
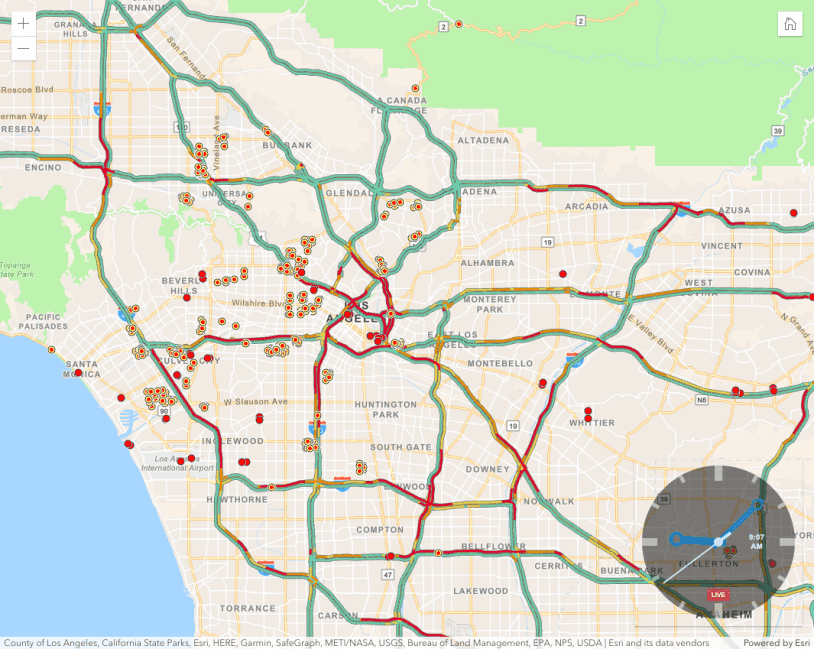
StreamLayer

Client-side StreamLayer

GeoRSSLayer

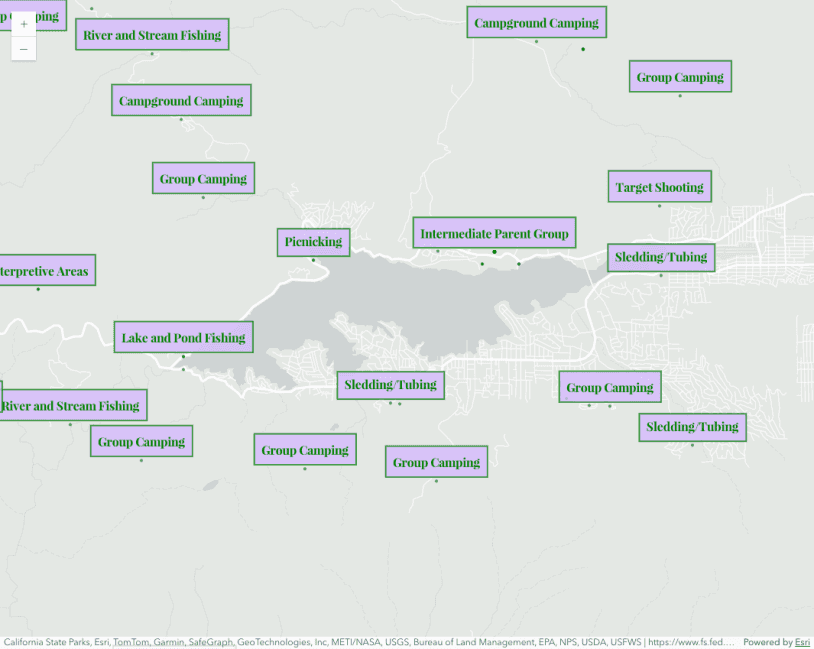
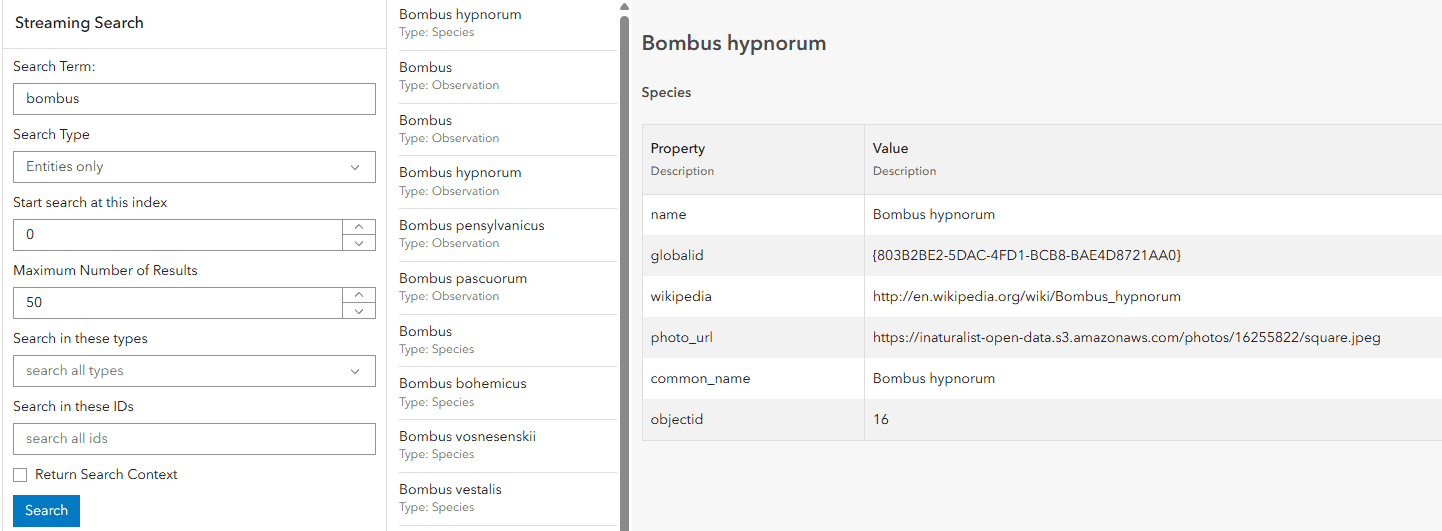
KnowledgeGraphLayer
Working with KnowledgeGraphLayer
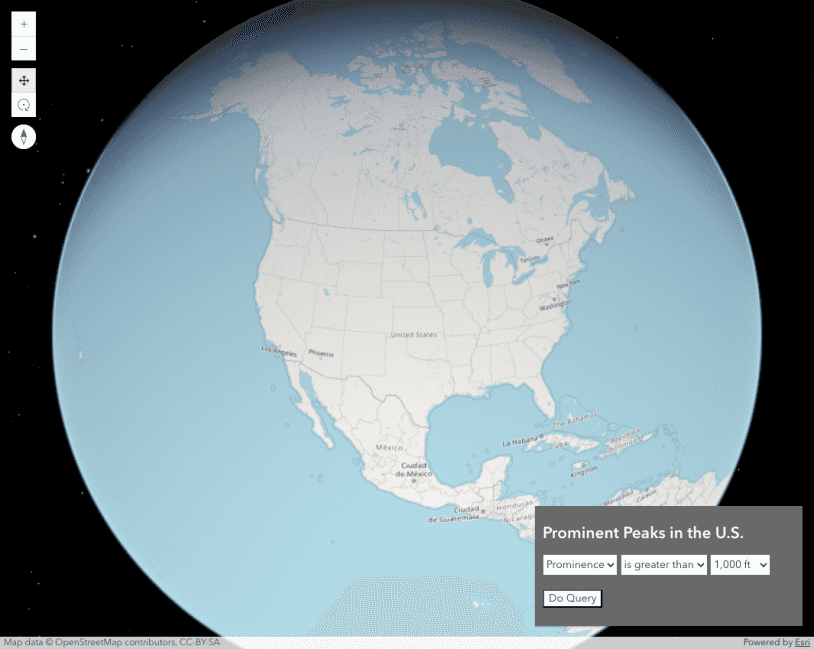
Query
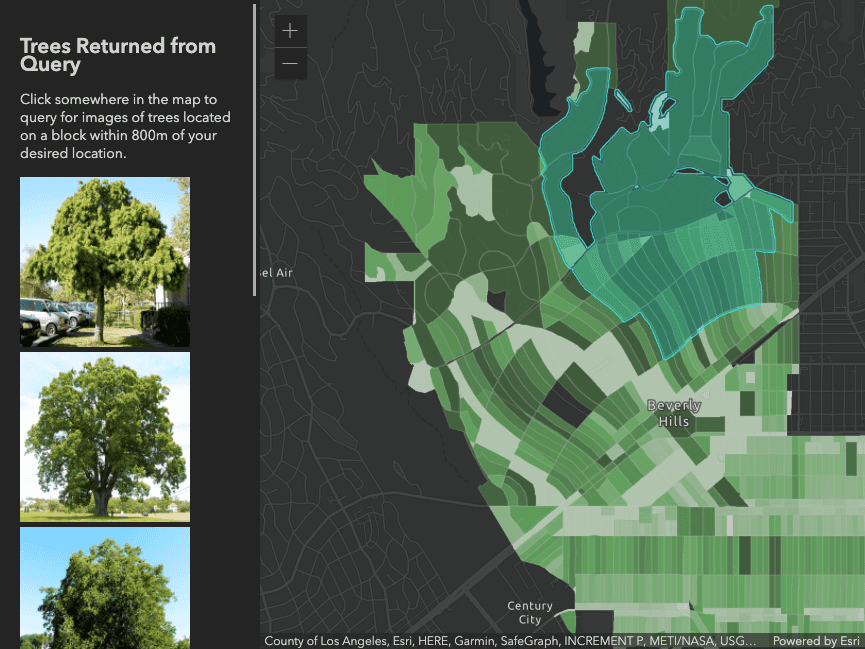
Query FeatureLayer

Query attachments
Query related features

Timestamp-offset field
Attribute bins query
Apply a scale-dependent display filter to a feature layer
Query statistics client-side by distance
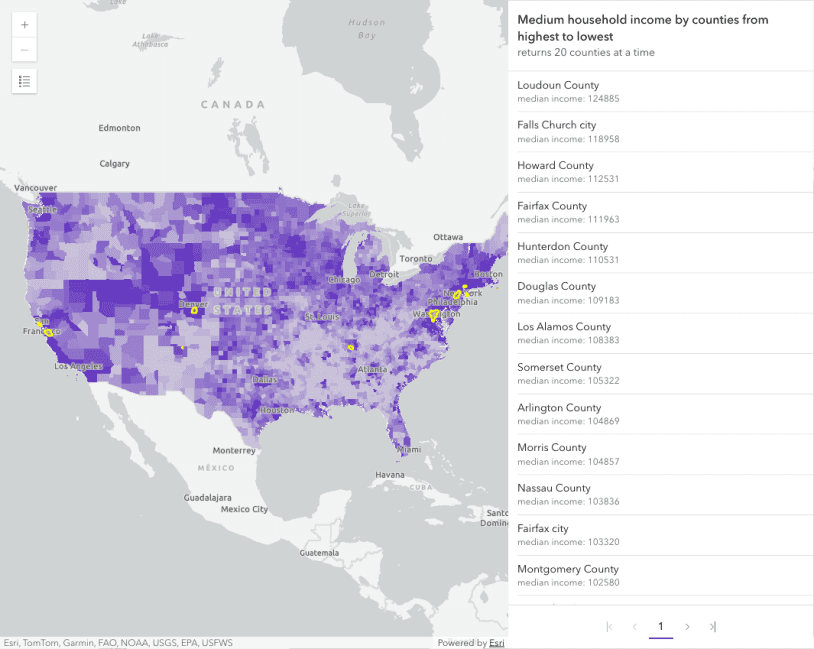
Client-side statistics and ArcGIS Pie Chart
Client-Side Statistics with queryFeatures and ArcGIS Pie Chart

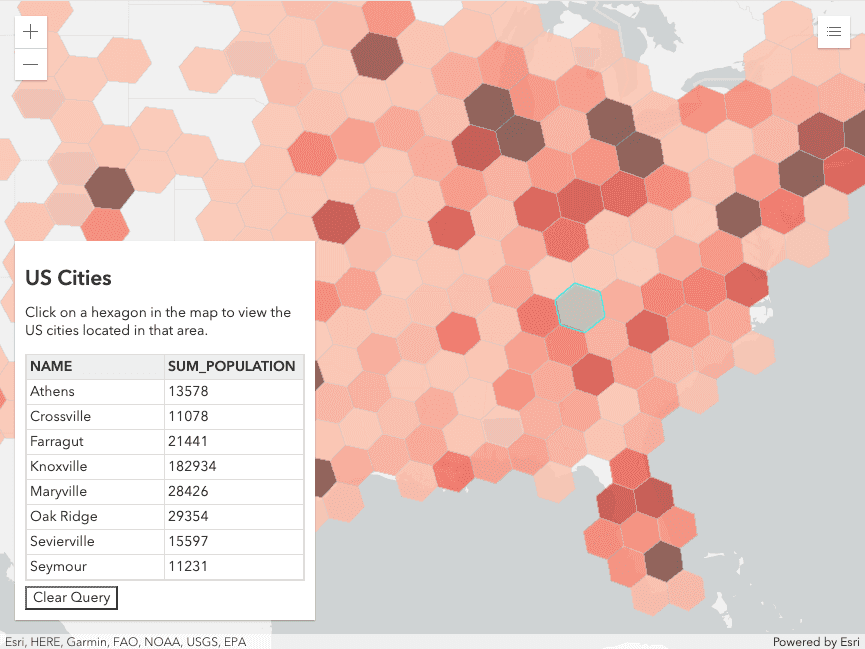
FeatureLayerView - query statistics by geometry
SceneLayerView - query statistics by geometry
Select features by rectangle

Query a knowledge graph
Query Knowledge Graphs
Version Management
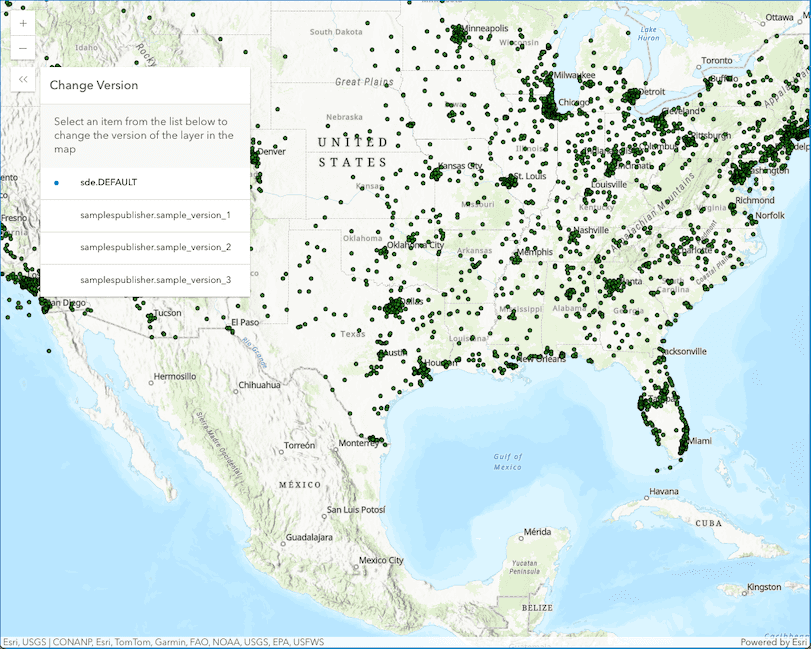
Changing Versions with the VersionManagementService
Editing

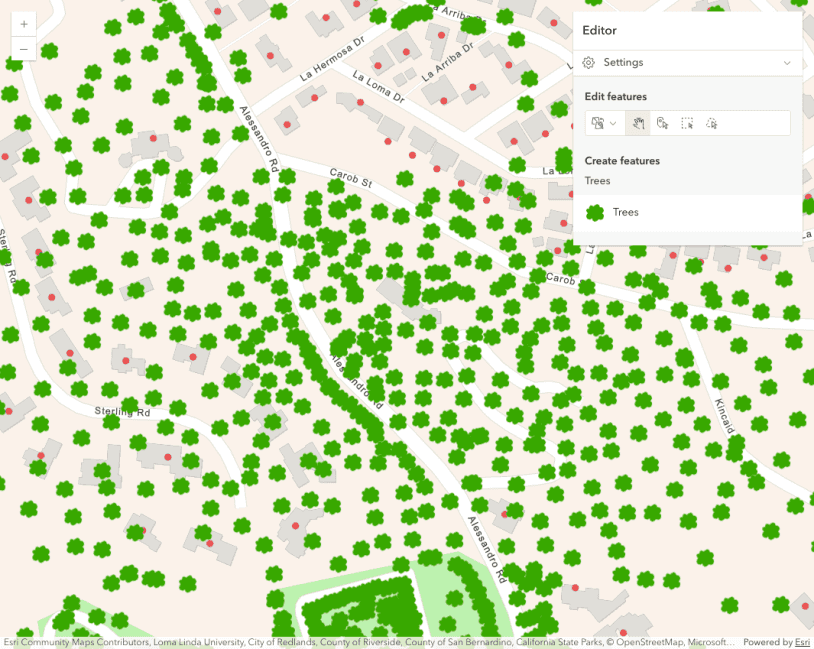
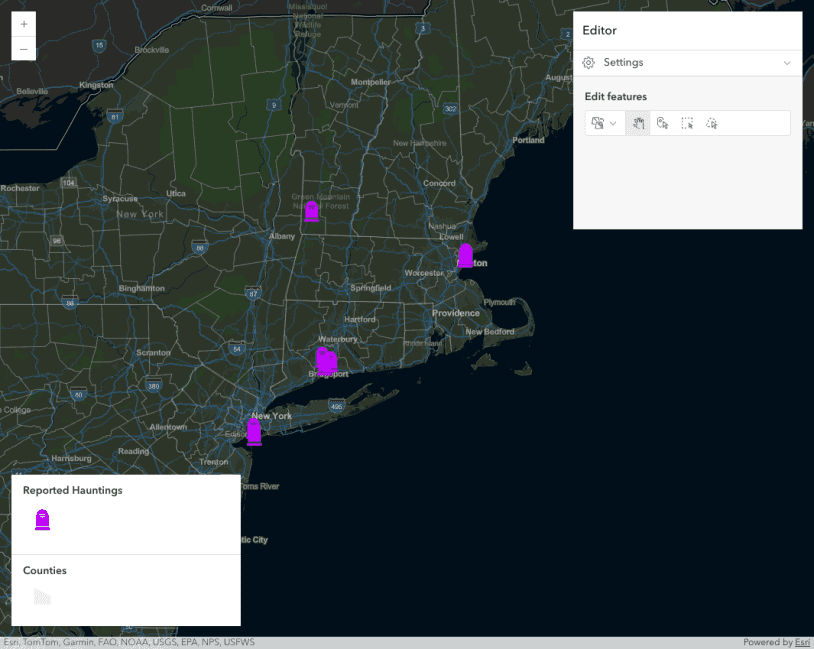
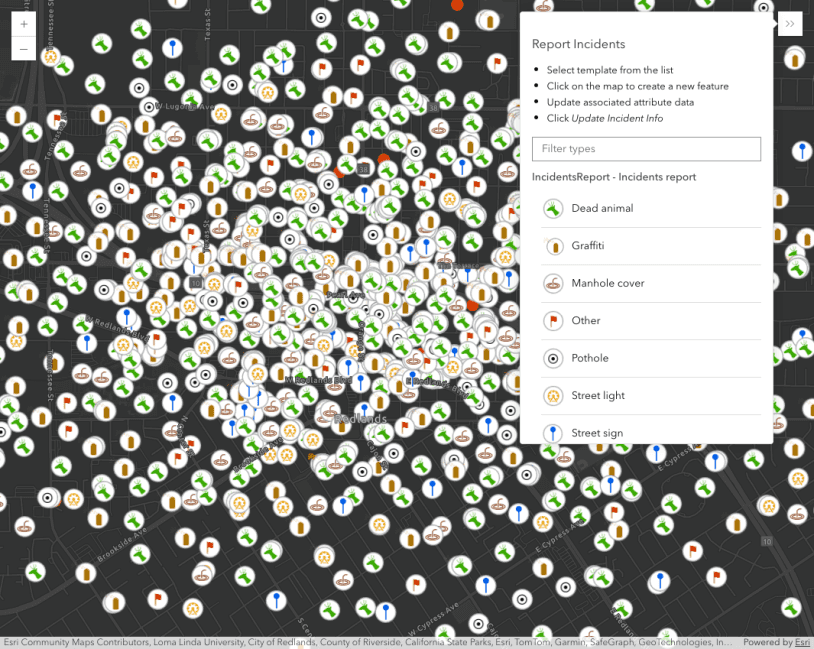
Edit features with the Editor component

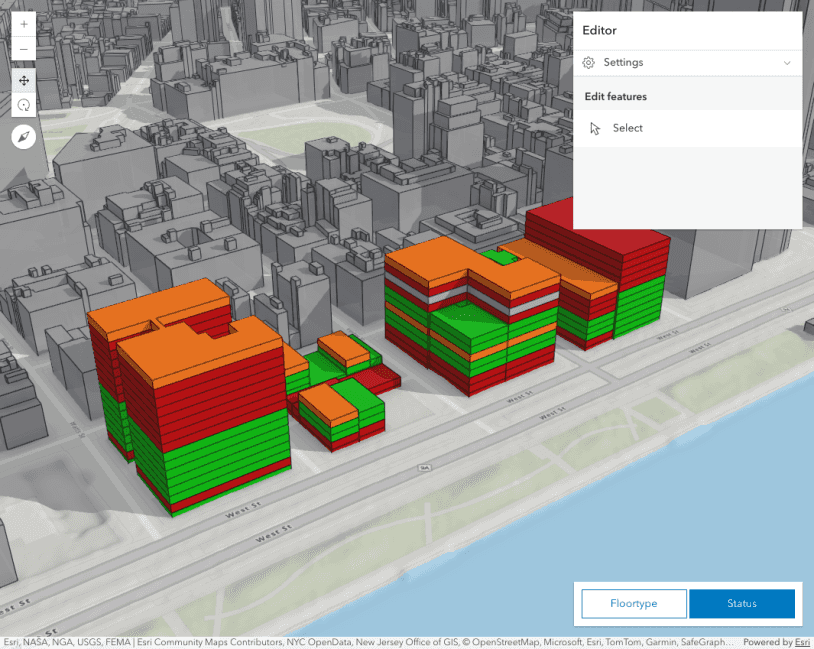
Edit features in 3D with the Editor component

Editor widget with configurations
Editing with calculated field expressions
This sample provides an example of working with advanced field calculations within the Editor widget

Edit FeatureLayers with form elements

Editing related data with calculated expressions
Update feature attributes

Advanced attribute editing
FeatureTable with editing
FeatureTable with editing and attachments enabled

FeatureTable with related records
FeatureLayer applyEdits
Update FeatureLayer using applyEdits()
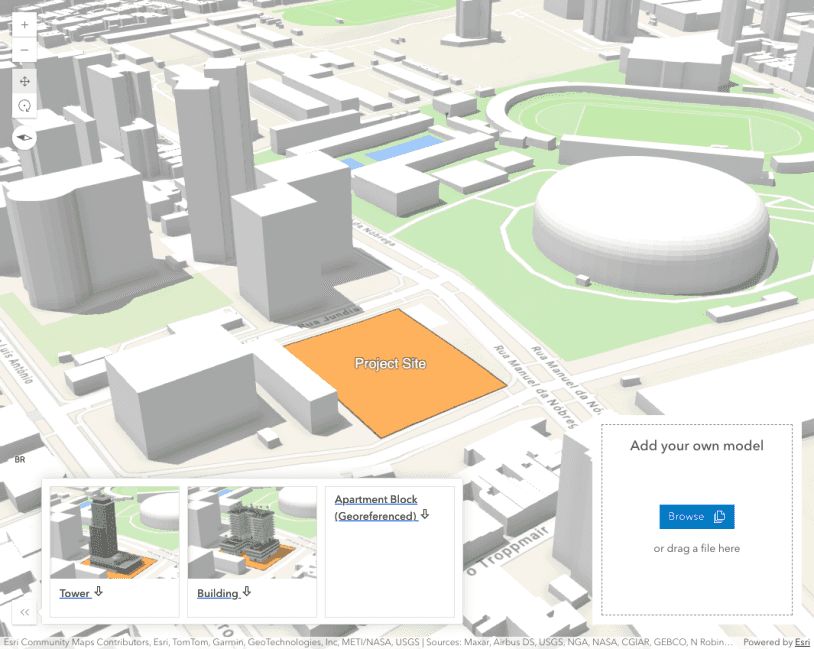
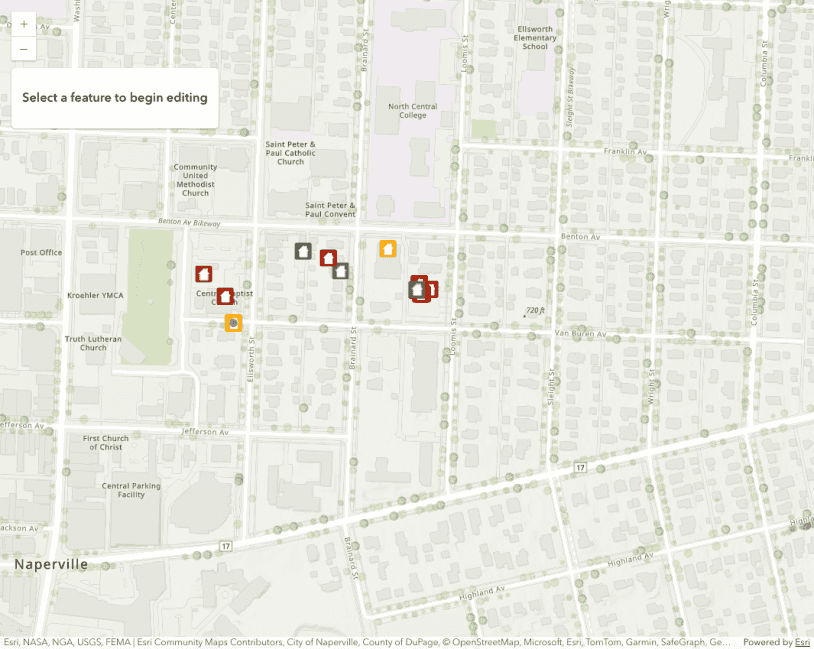
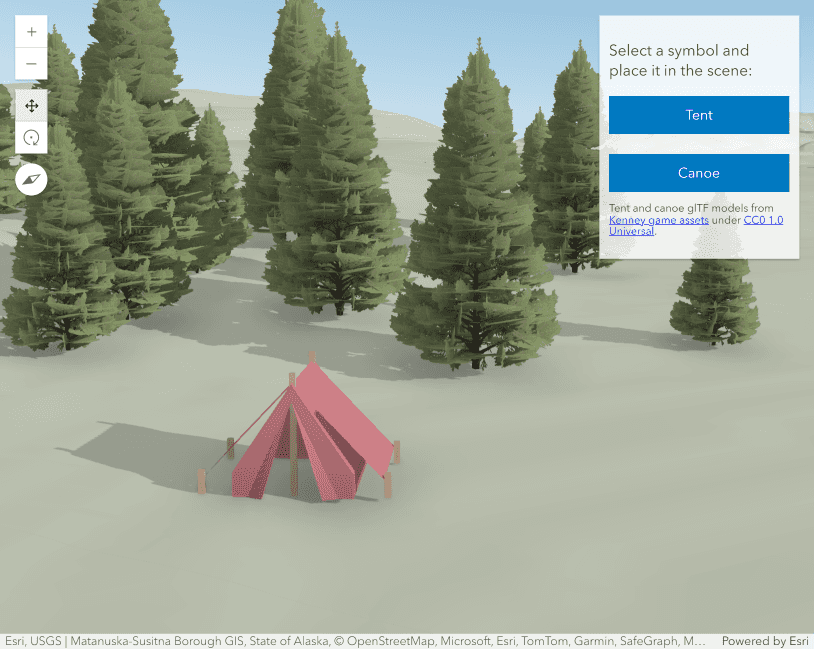
SceneLayer upload 3D models and applyEdits
Upload and place 3D Models
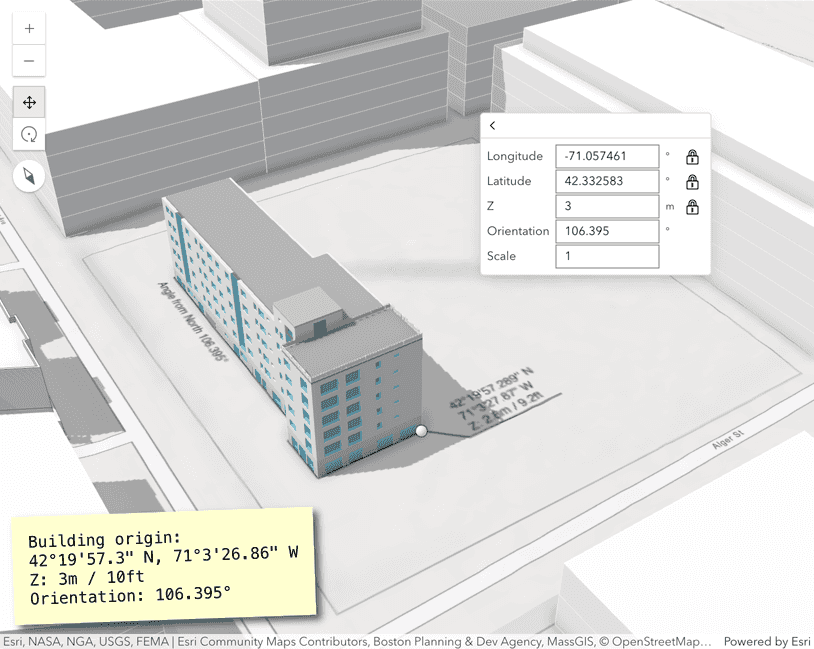
Editing with coordinate inputs
3D model georeferencing with coordinate inputs


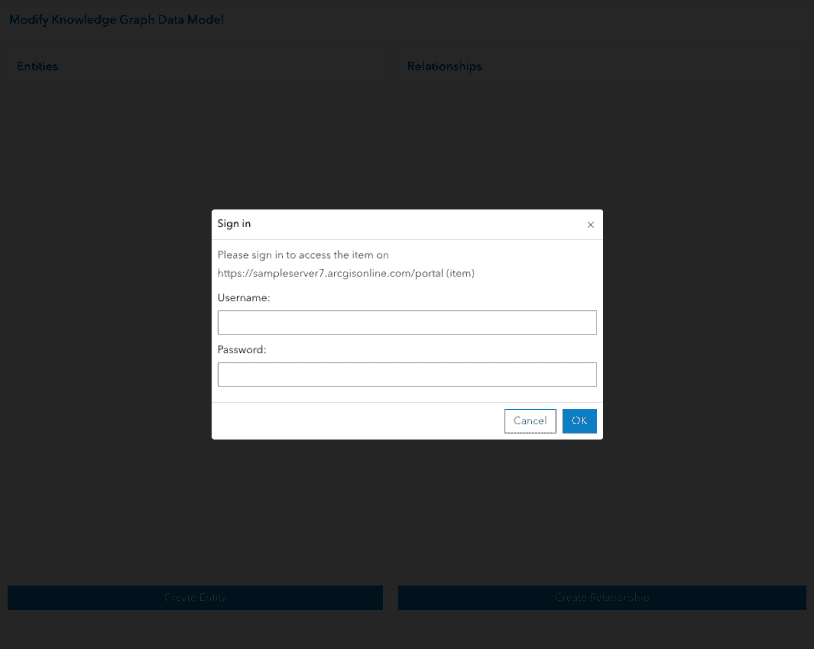
Edit knowledge graph data model
Edit a knowledge graph data model
Labels
Draw


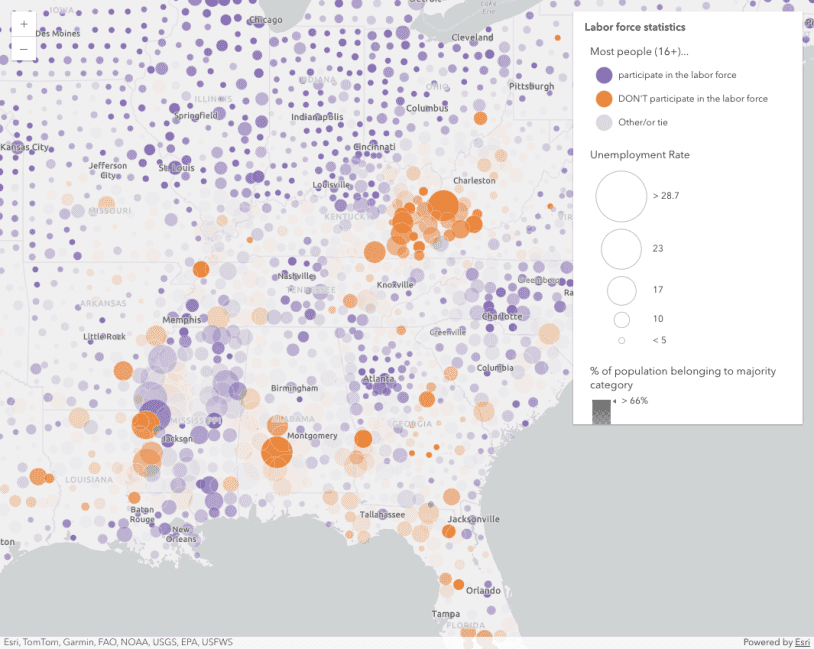
Visualization
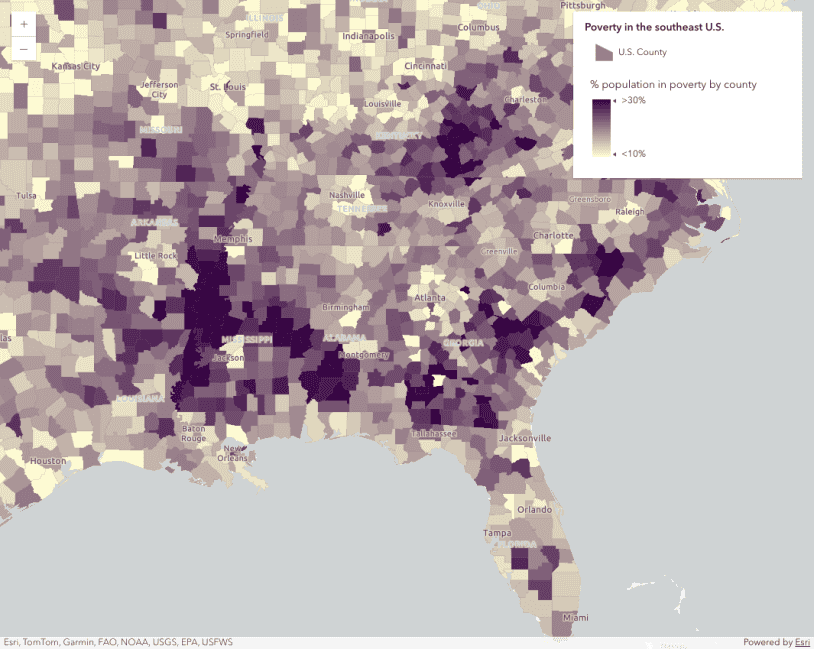

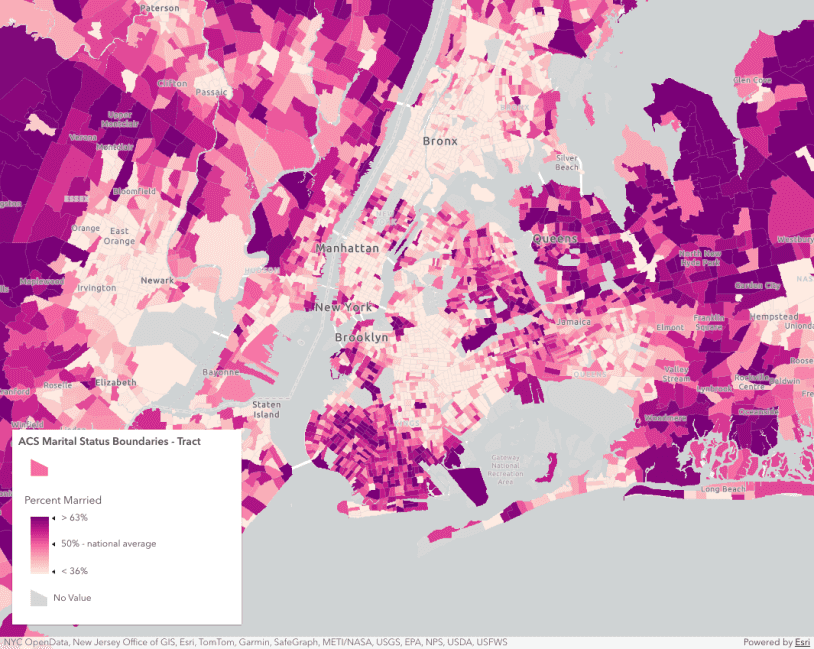
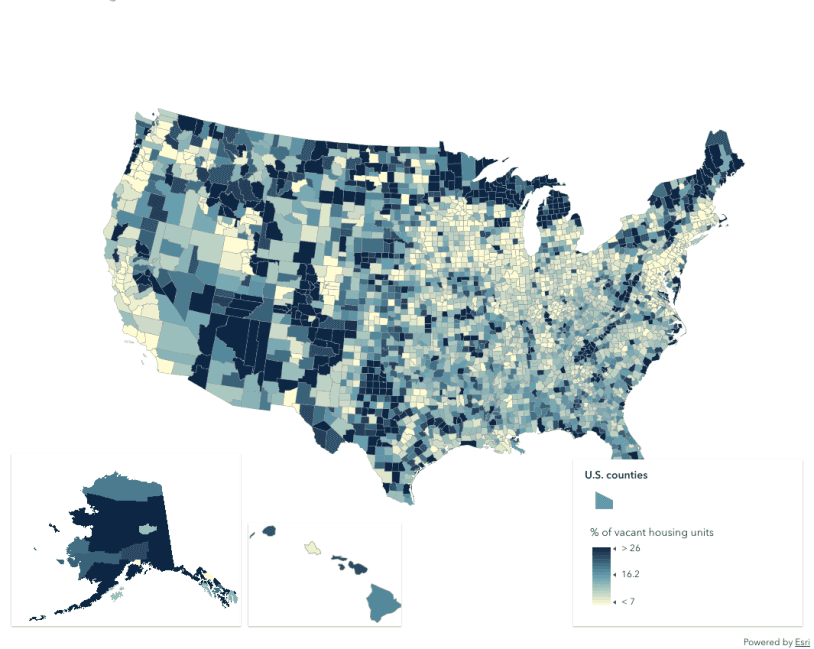
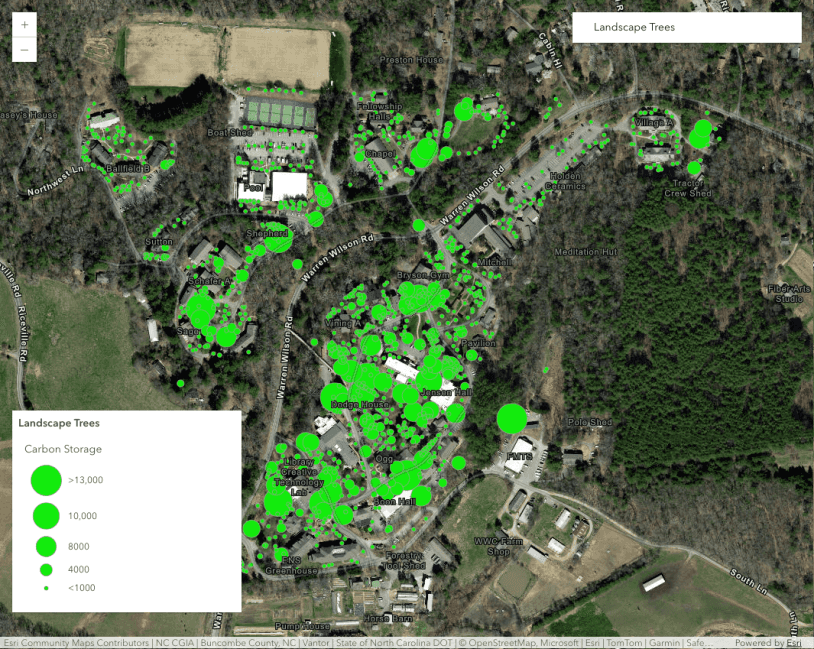
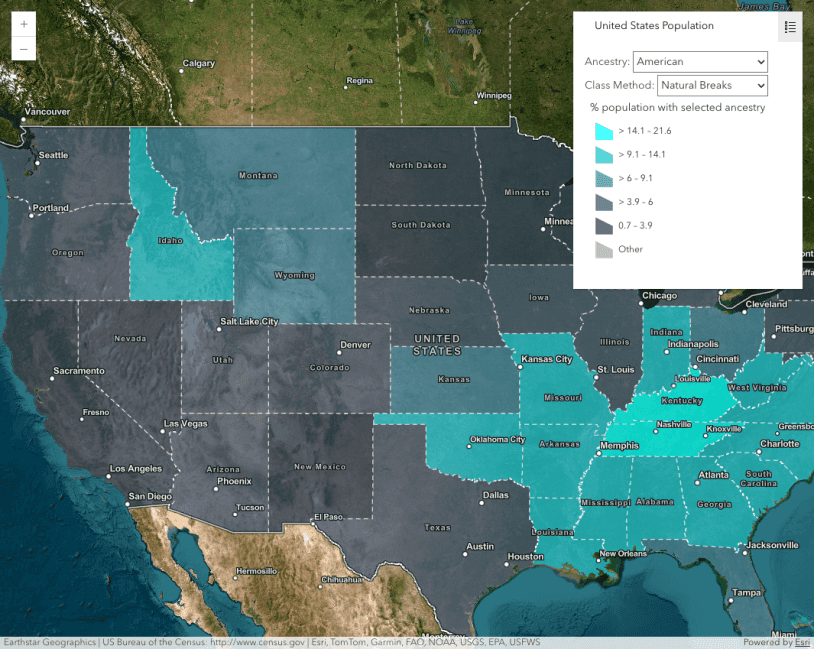
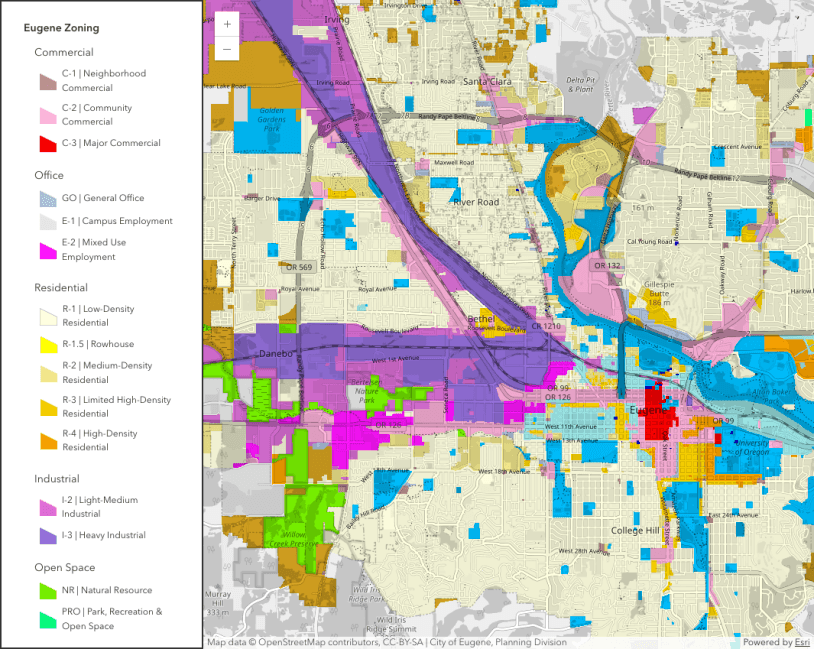
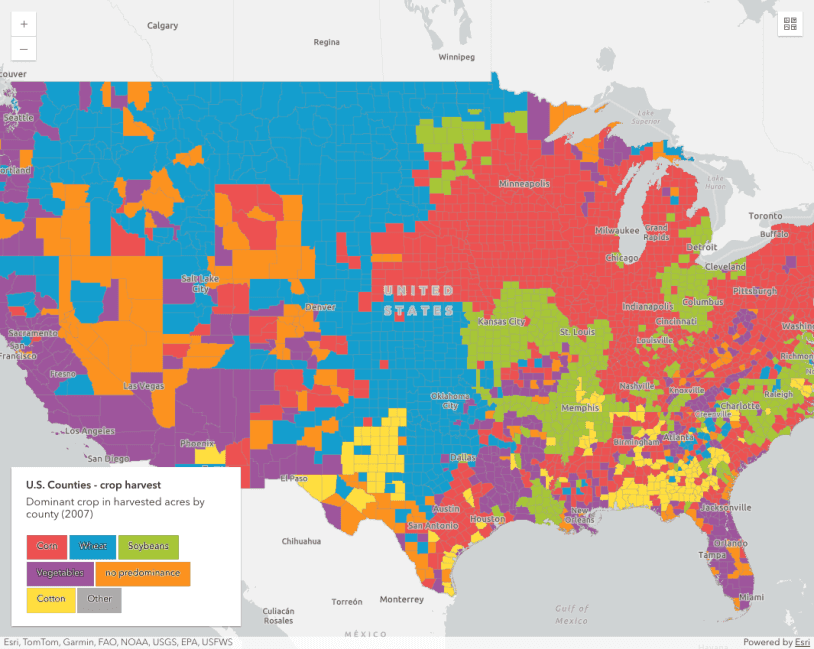
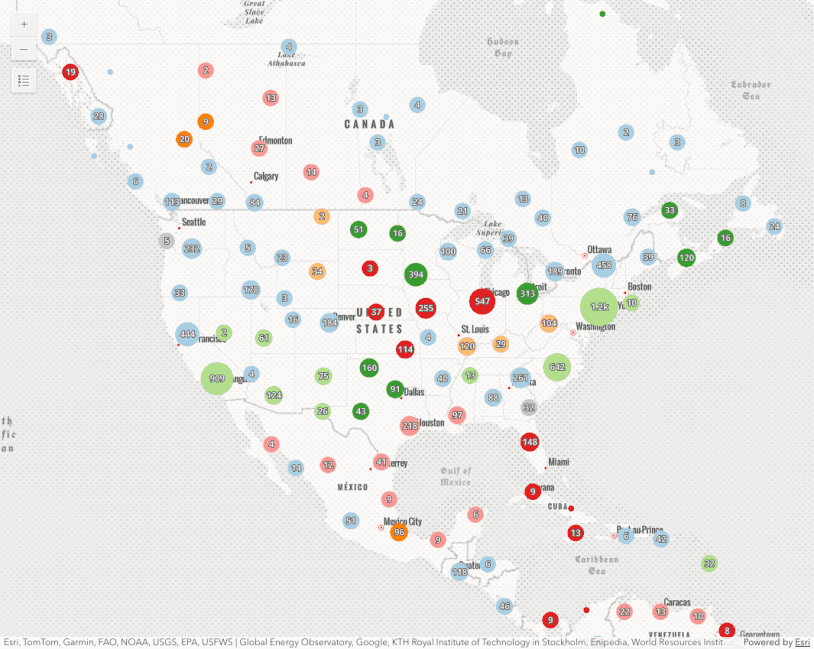
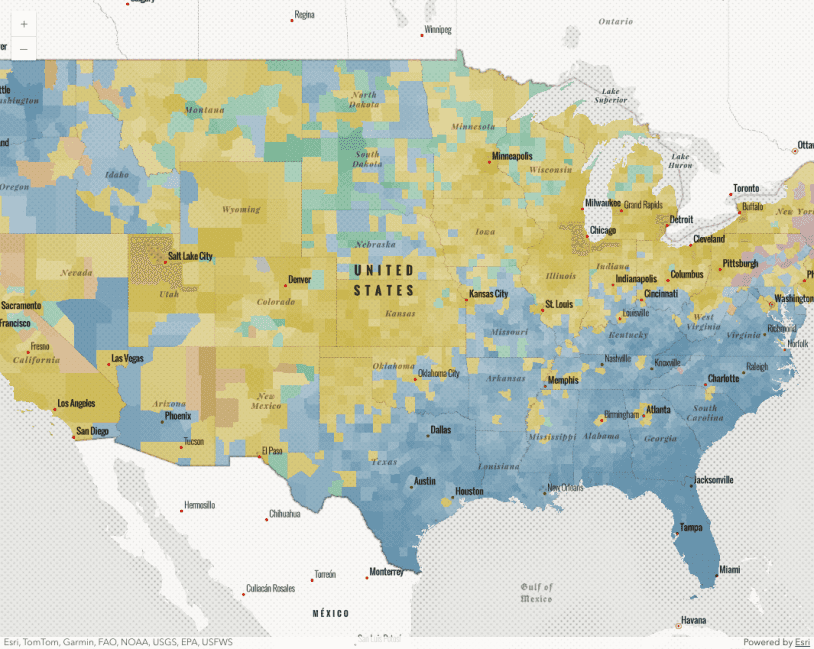
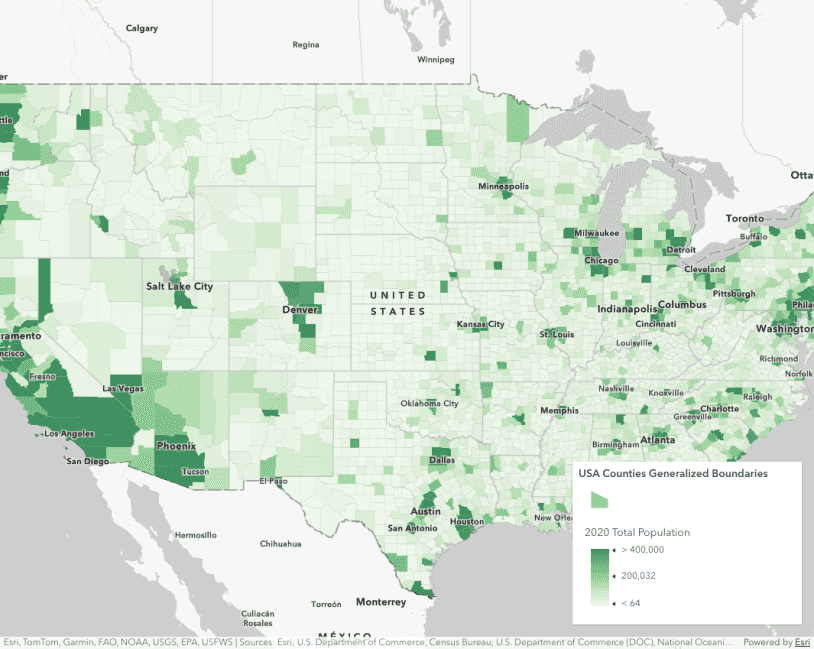
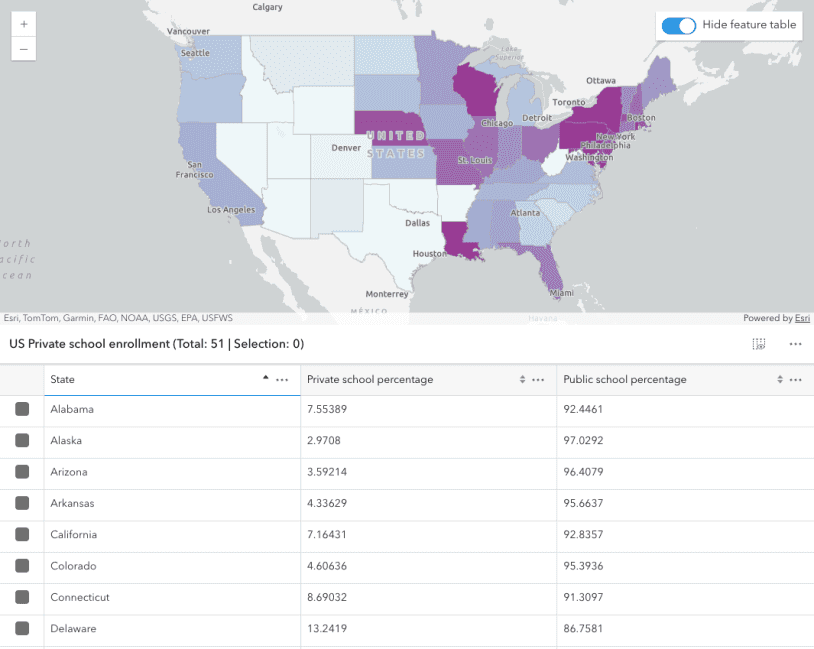
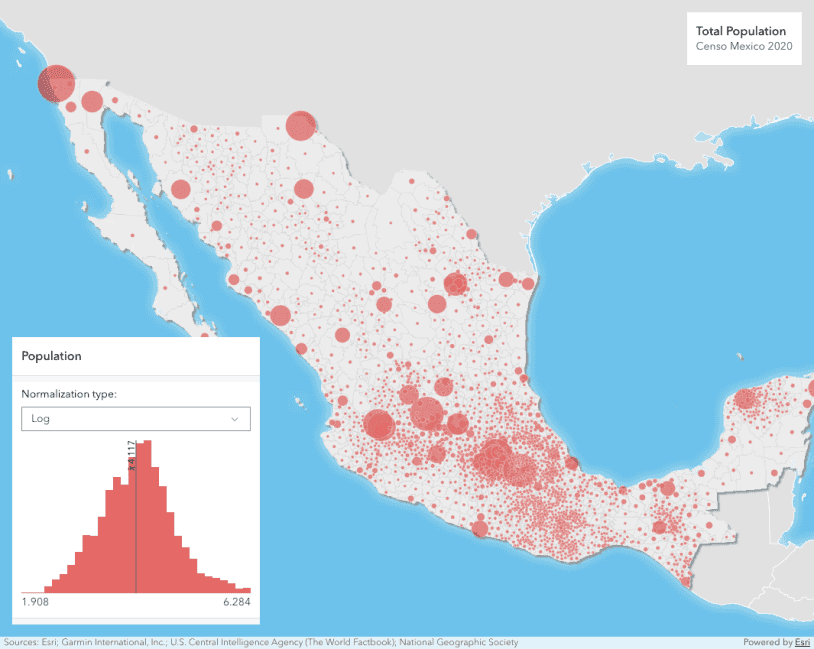
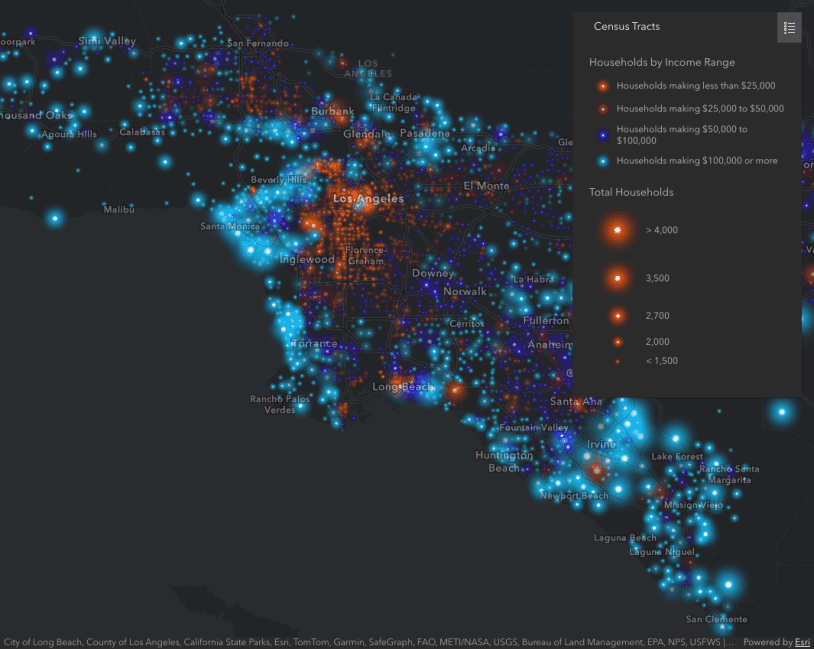
Dot density

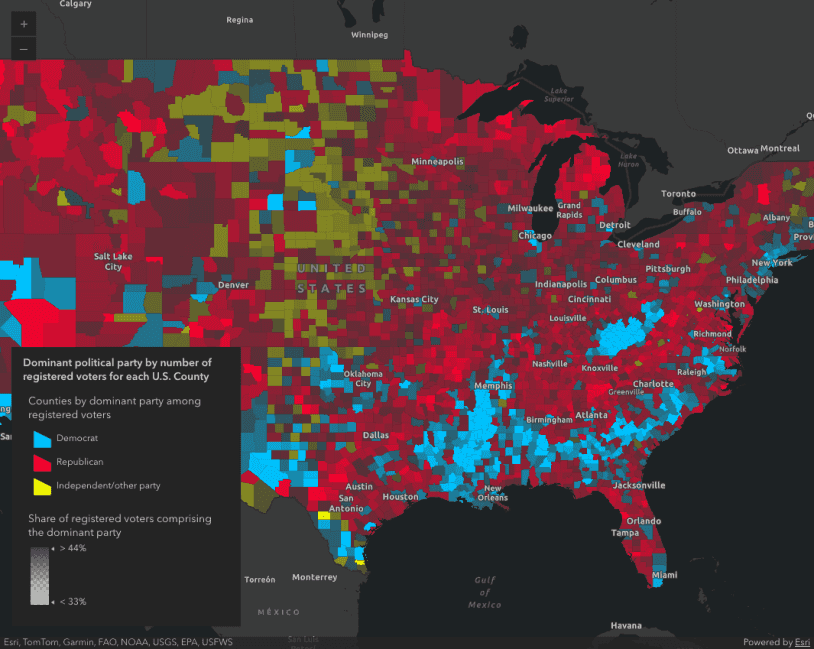
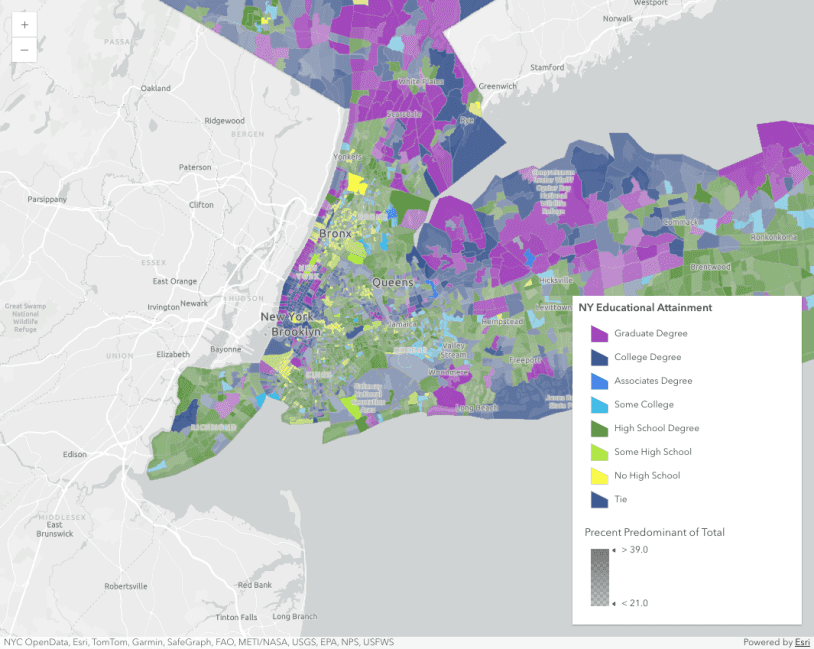
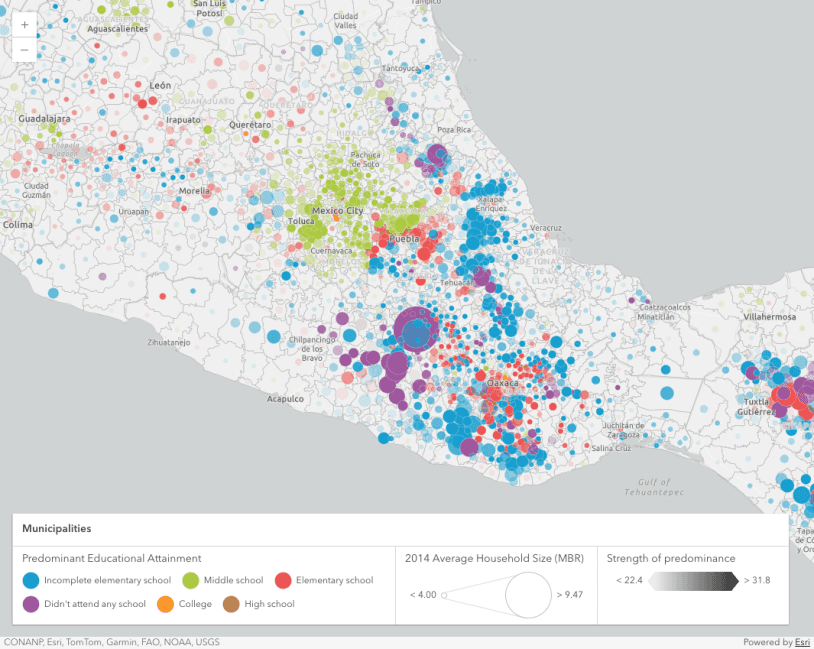
Unique value groups
This sample demonstrates how to categorize unique values into groups with headings.

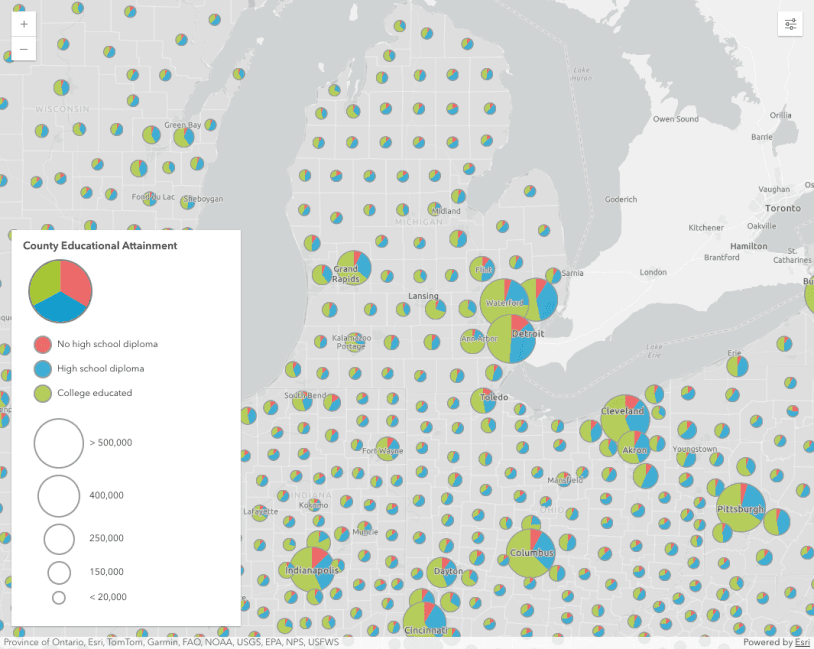
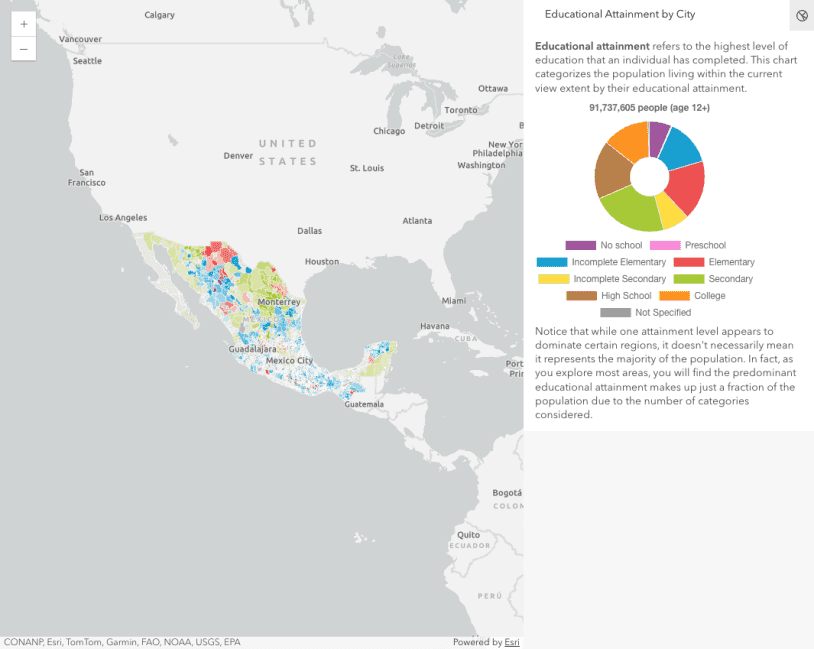
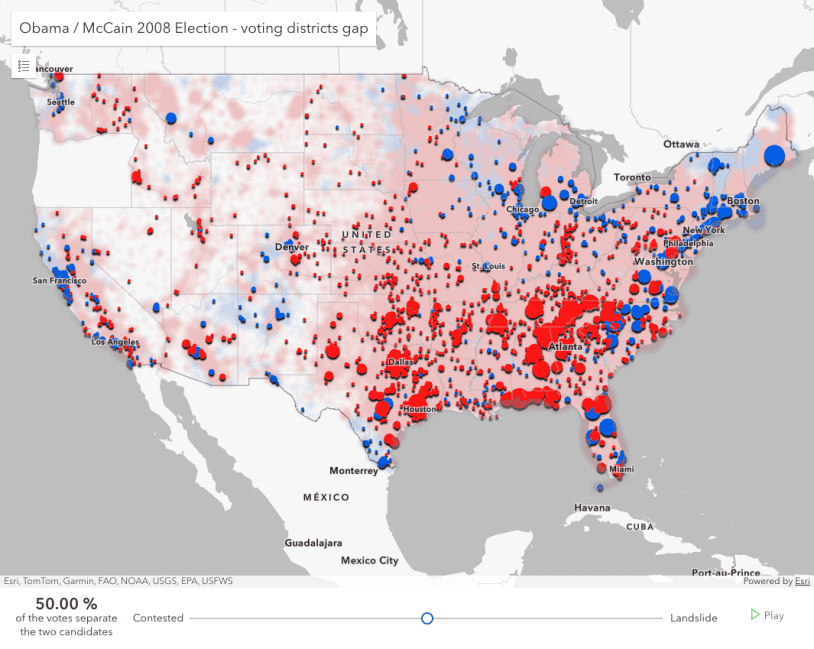
Pie charts
Create a custom visualization using Arcade

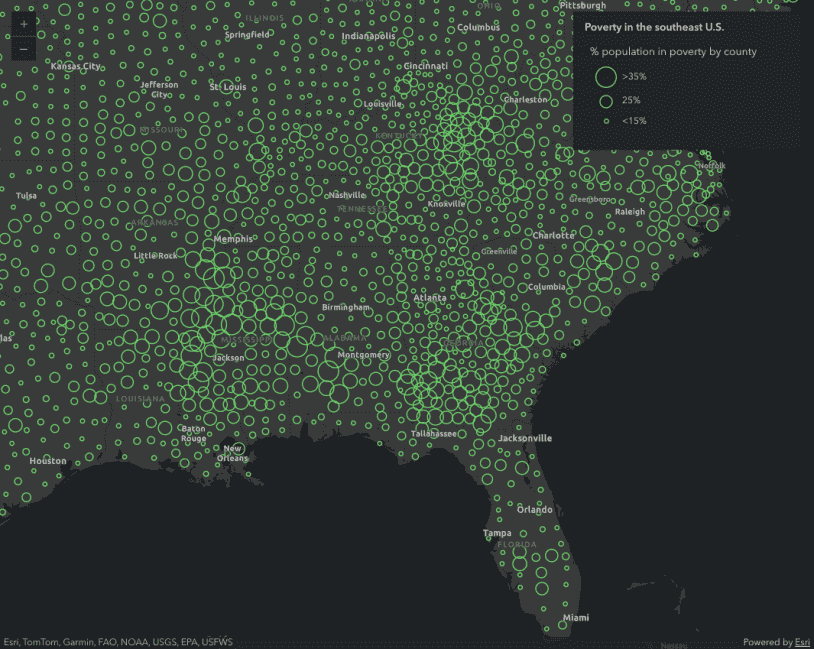
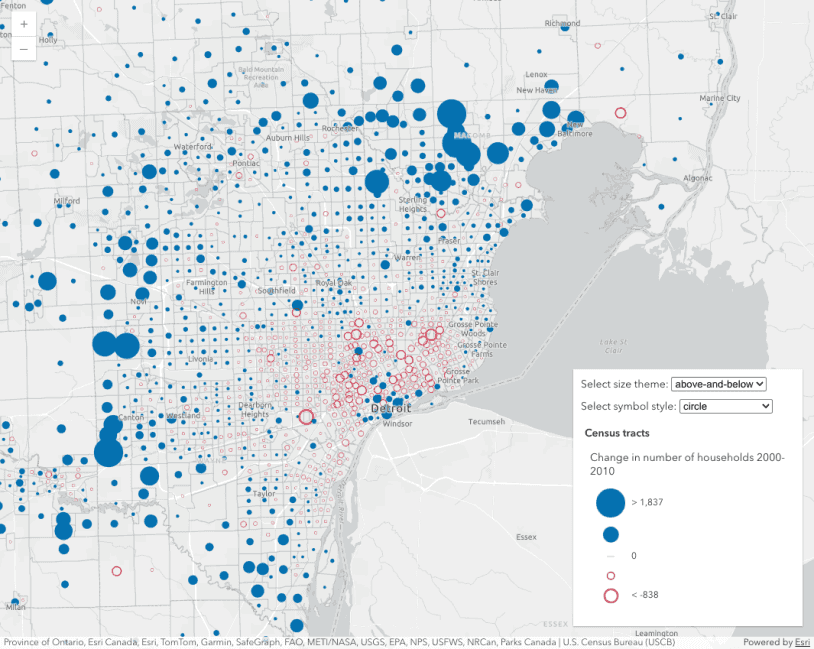
Create a reference size visualization
Create a reference size visualization in a gridded dataset using the reference-size theme.
Vary point sizes by scale


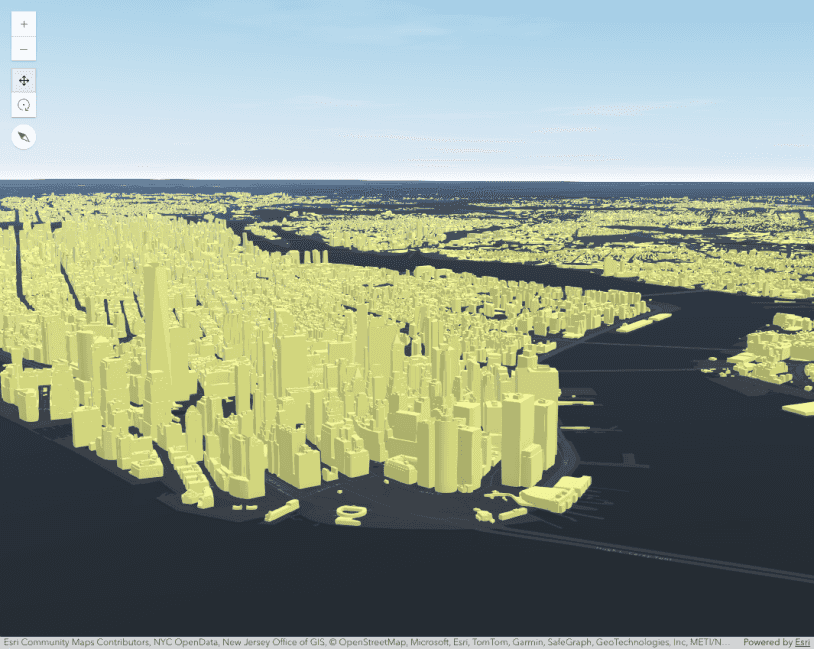
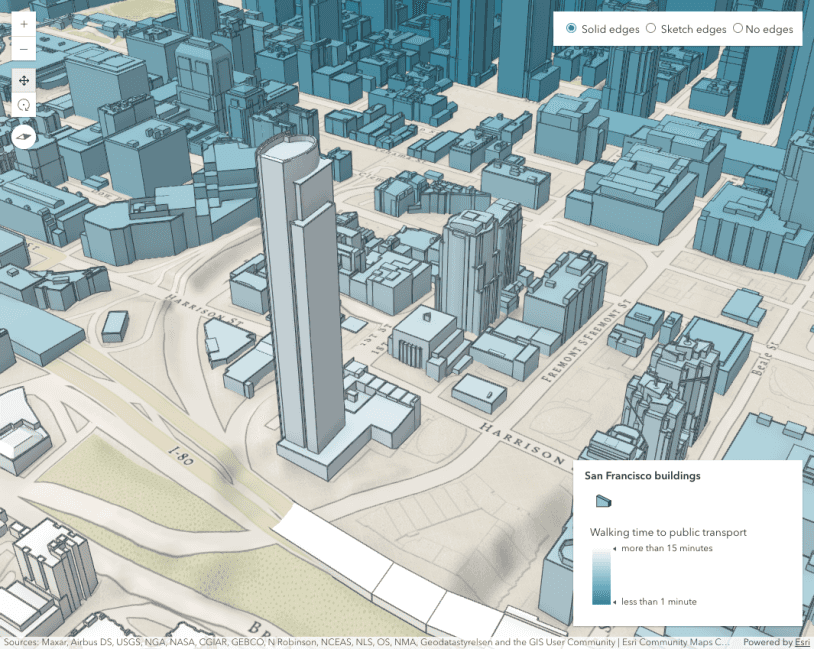
Continuous color for 3D buildings
Generate continuous color visualization for 3D buildings


Customize ColorSlider Histogram

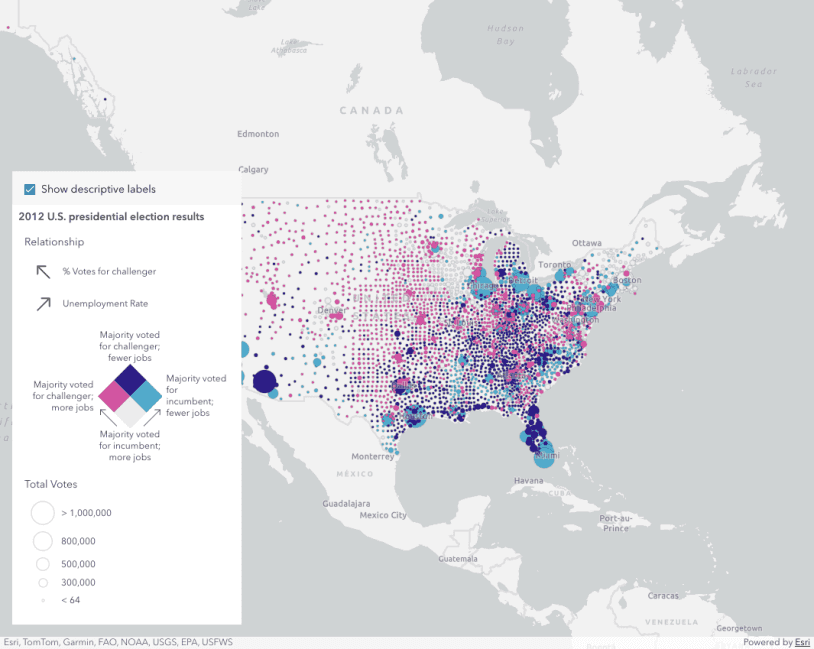
Multivariate data exploration


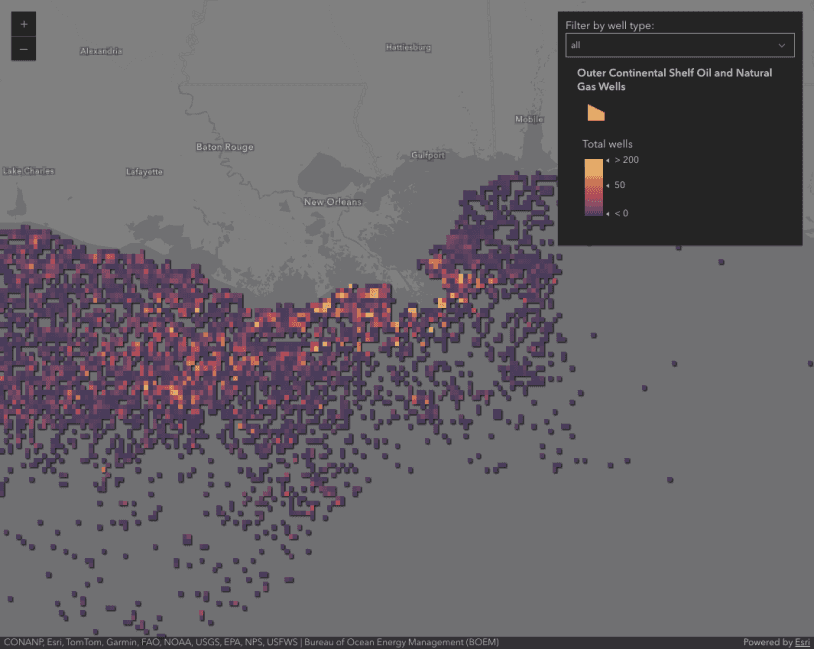
Binning with aggregate fields
This sample demonstrates how to define aggregate fields that can be used in the popup, labels, and renderer of a binned layer.

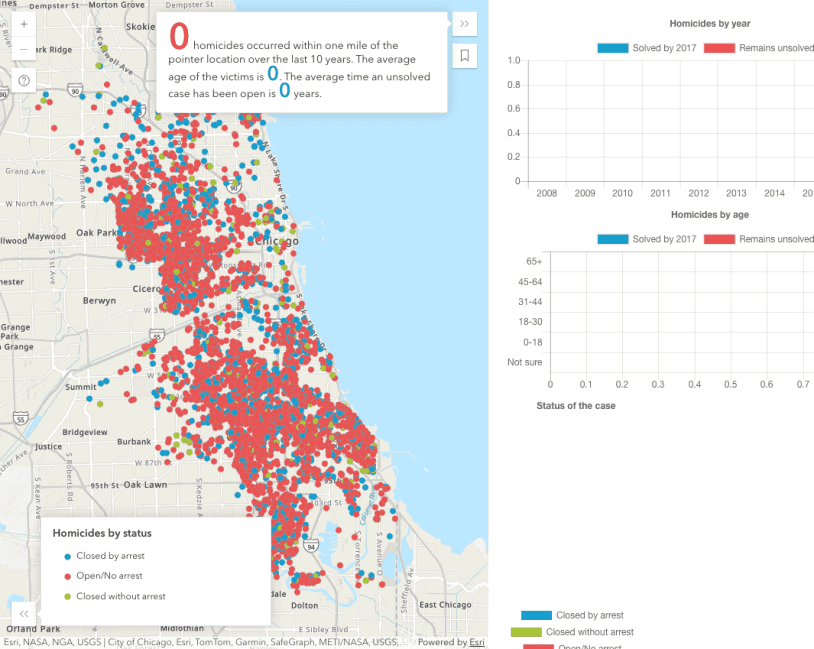
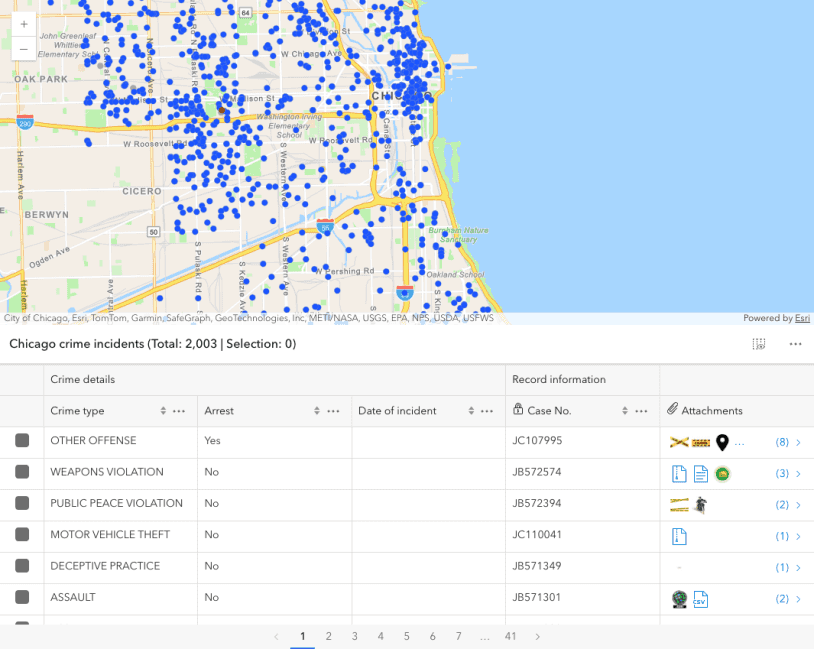
Summarize binned data using Arcade
Use Arcade in popups to summarize binned crimes by type

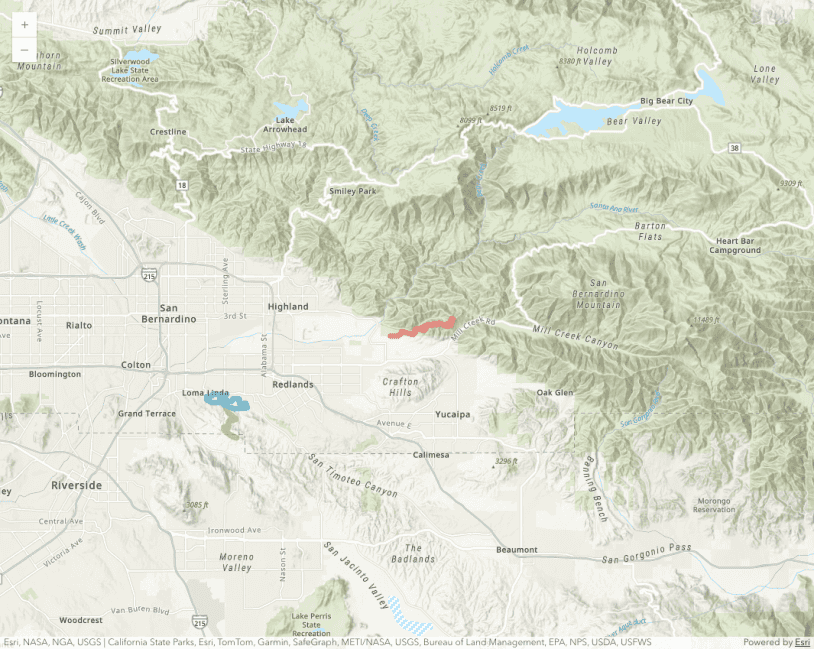
Binning polylines
Aggregate polylines to bins to visualize the density of features.
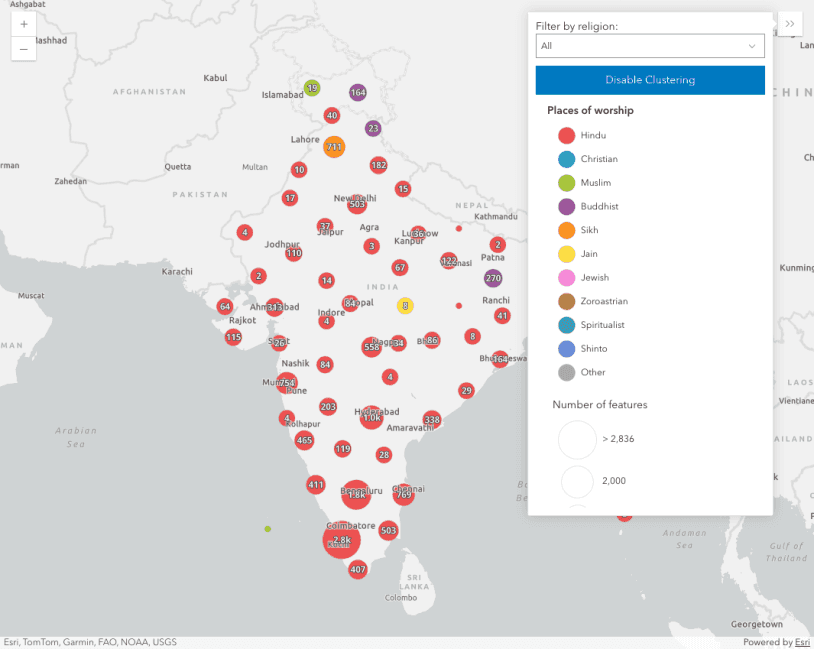
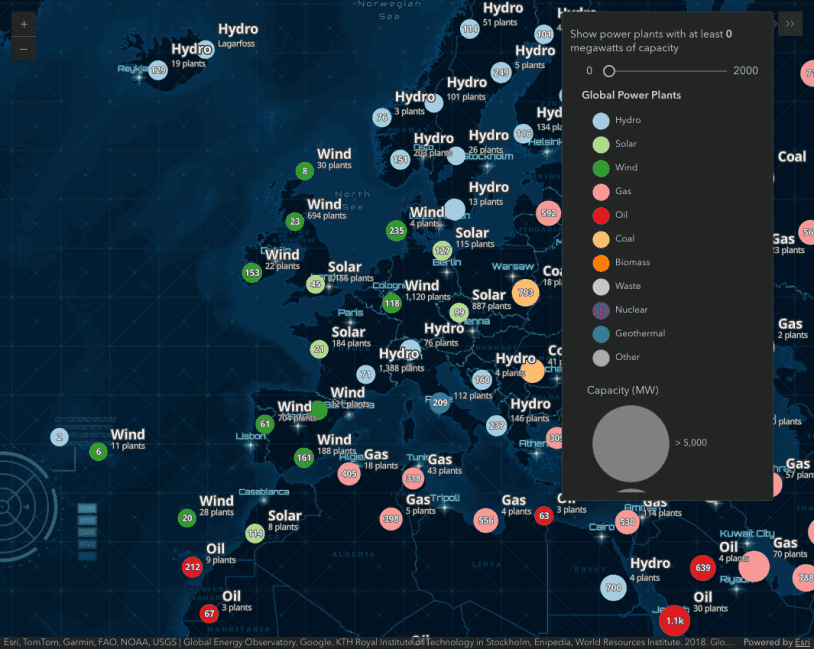
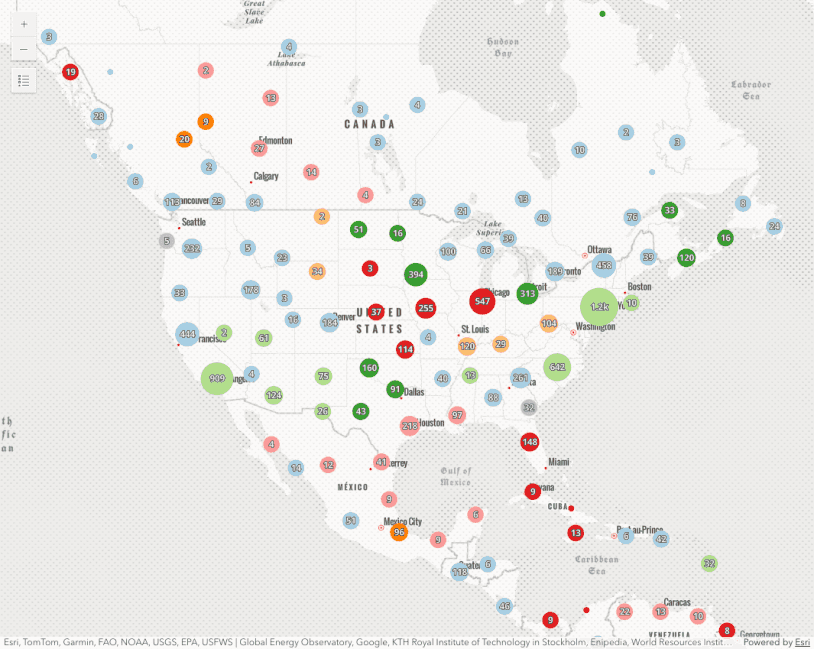
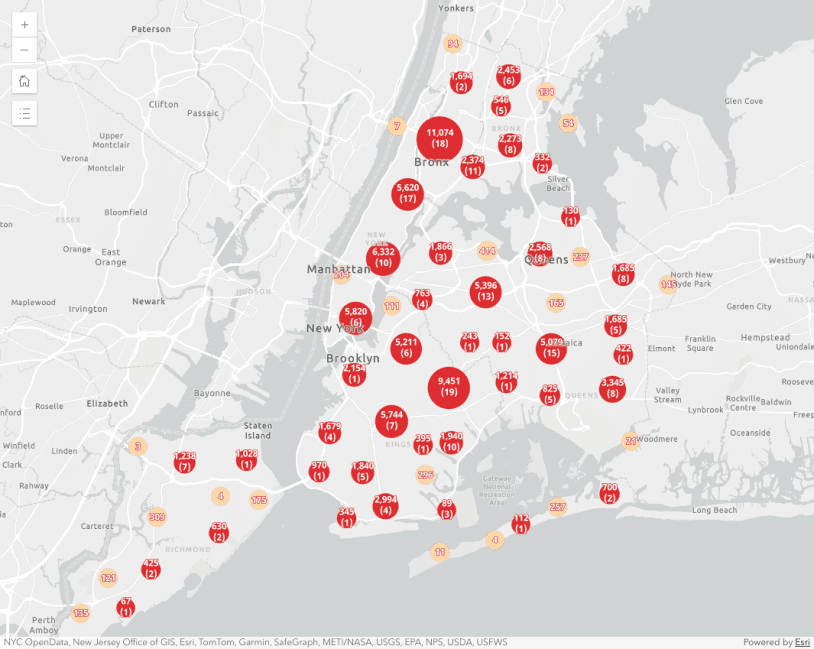
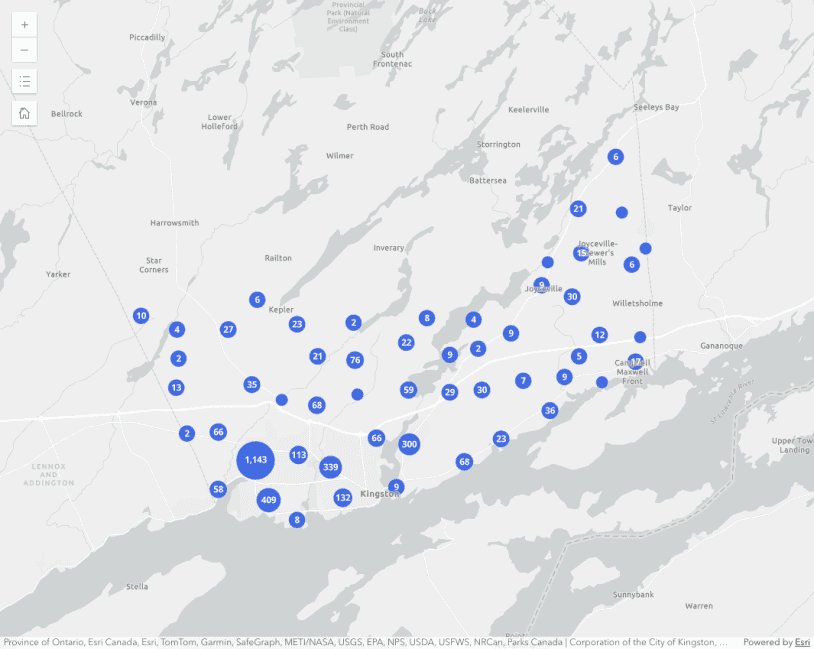
Intro to clustering
Generate suggested configuration
Clustering - generate suggested configuration
Override cluster symbol

Clusters as pie charts

Filter popup features
This sample demonstrates how to filter clustered features within a cluster's popup.
Popup charts for clusters
This sample demonstrates how to summarize clustered features using charts within a cluster's popup.
Clustering with visual variables
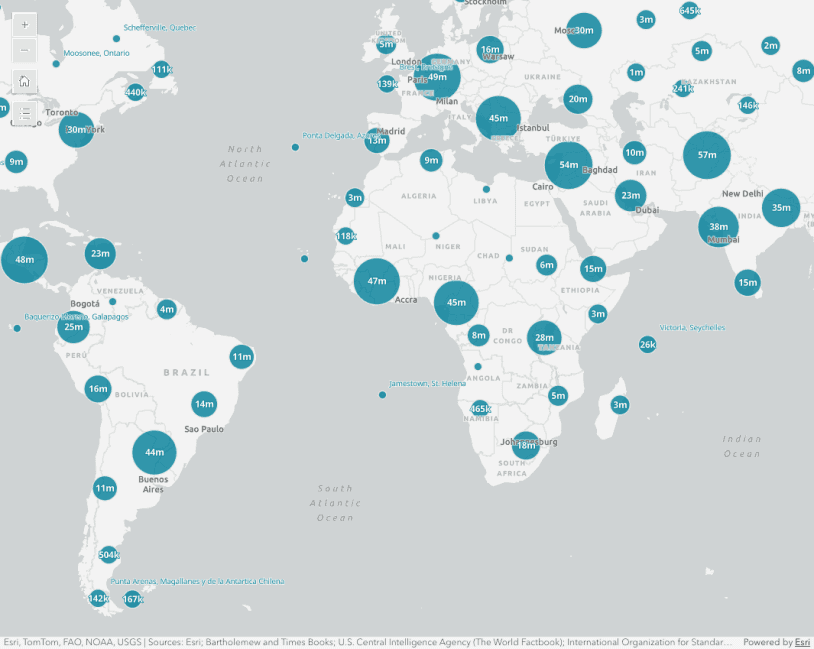
Cluster size based on the sum of a field
Clustering with aggregate fields
Clustered polygons
This sample demonstrates how to aggregate polygon features to clusters.


Intro to CIMSymbol
Learn the basics about CIMSymbol and how to use a primitiveOverride on the text
CIMSymbol lines and polygons
Learn how to create CIM line and polygon symbols.

Arrows along a line
Use a CIMSymbol to draw a line with arrow markers at a fixed distance

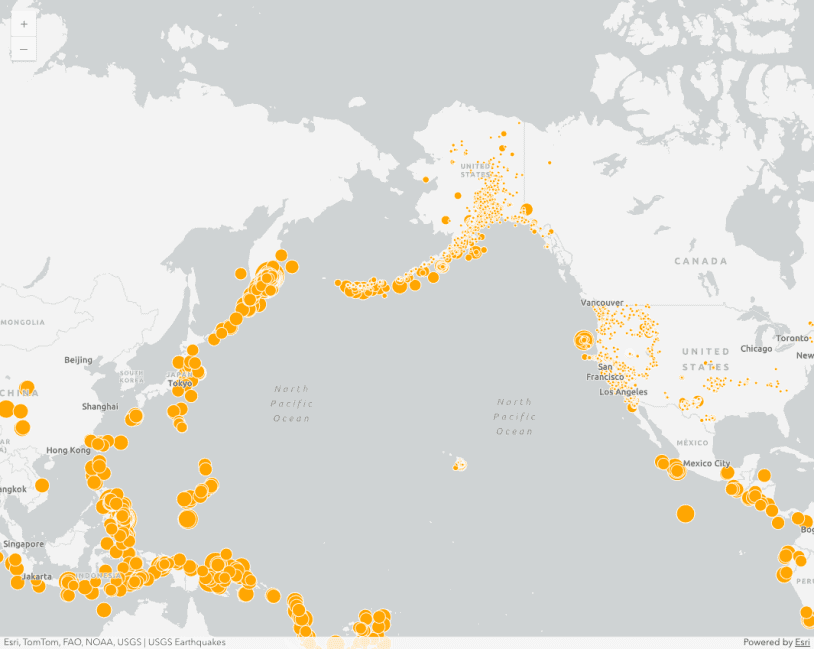
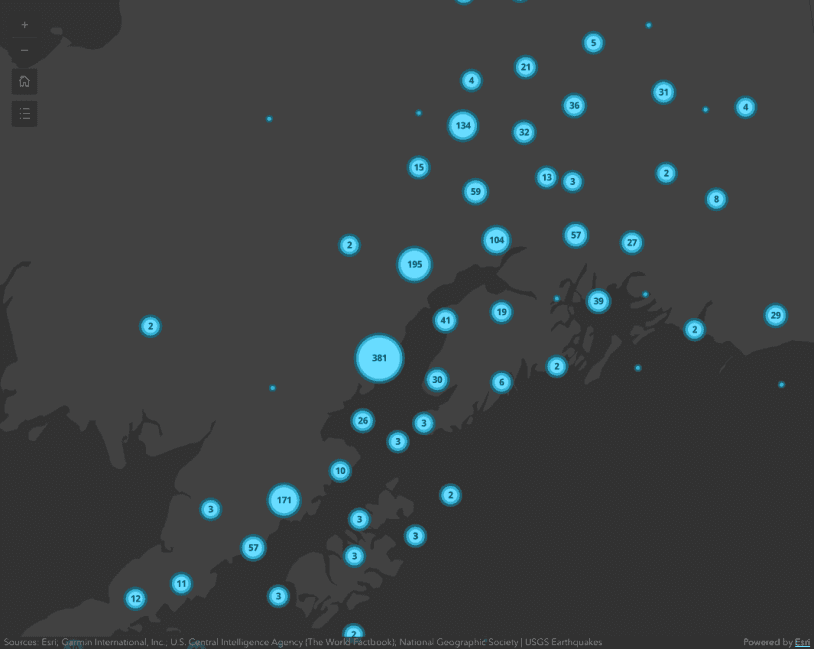
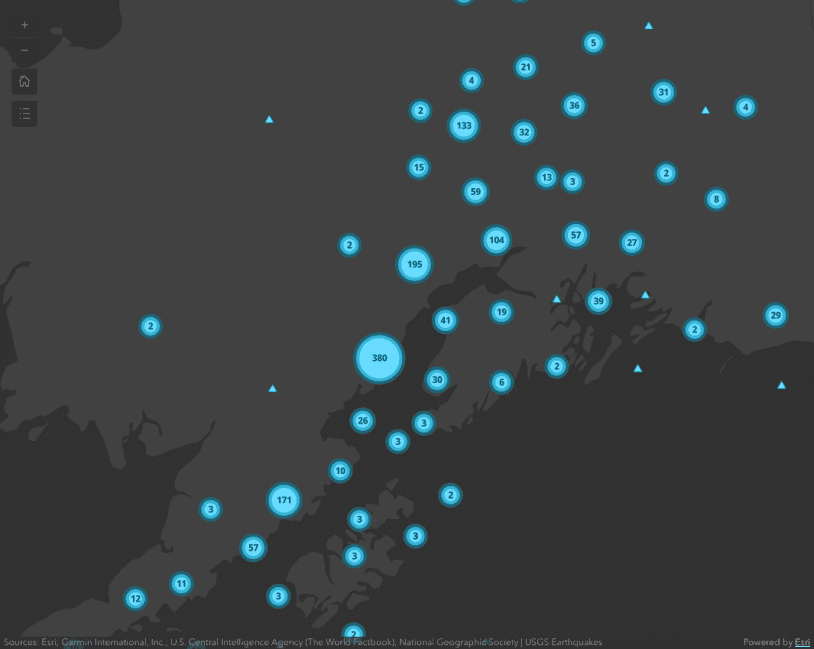
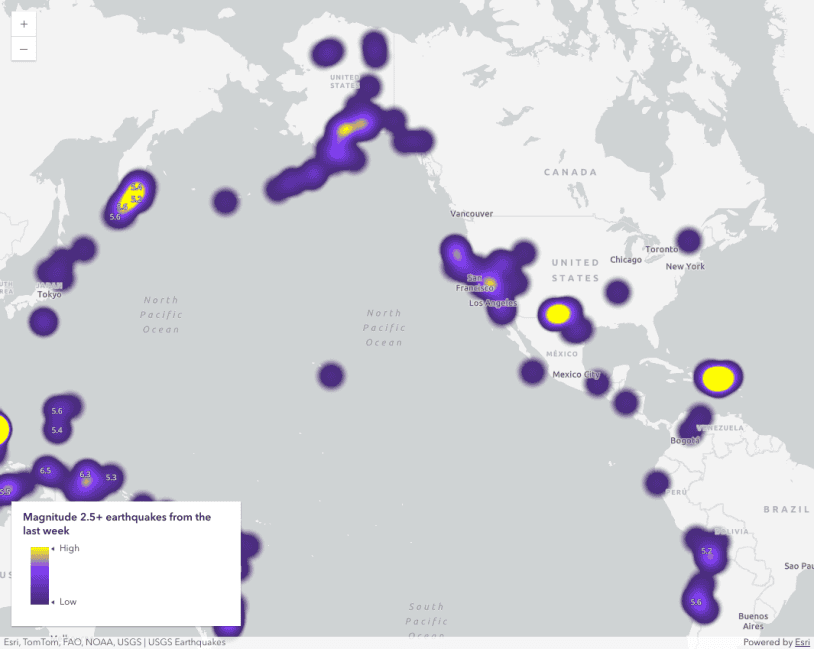
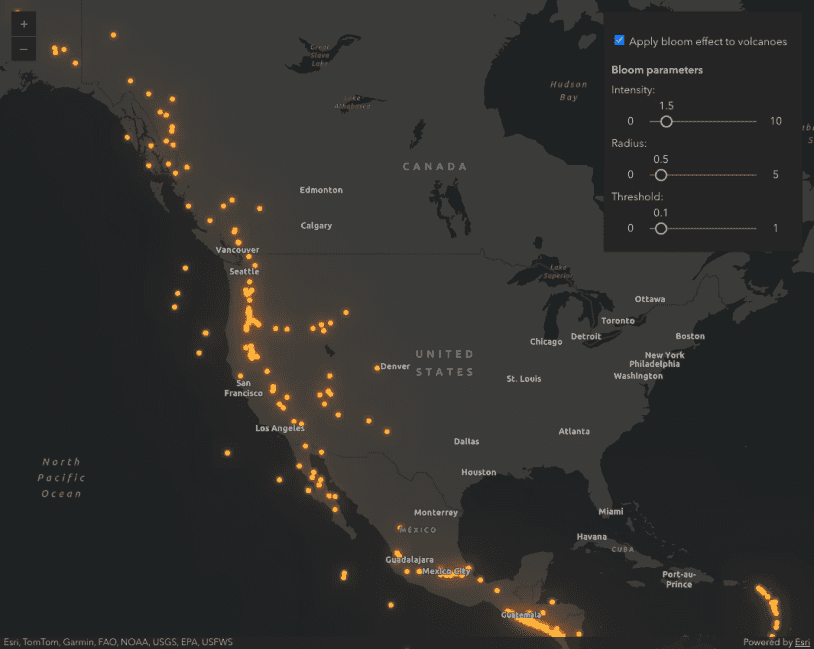
Animated symbols
Use an animated CIMSymbol to draw attention to recent earthquakes
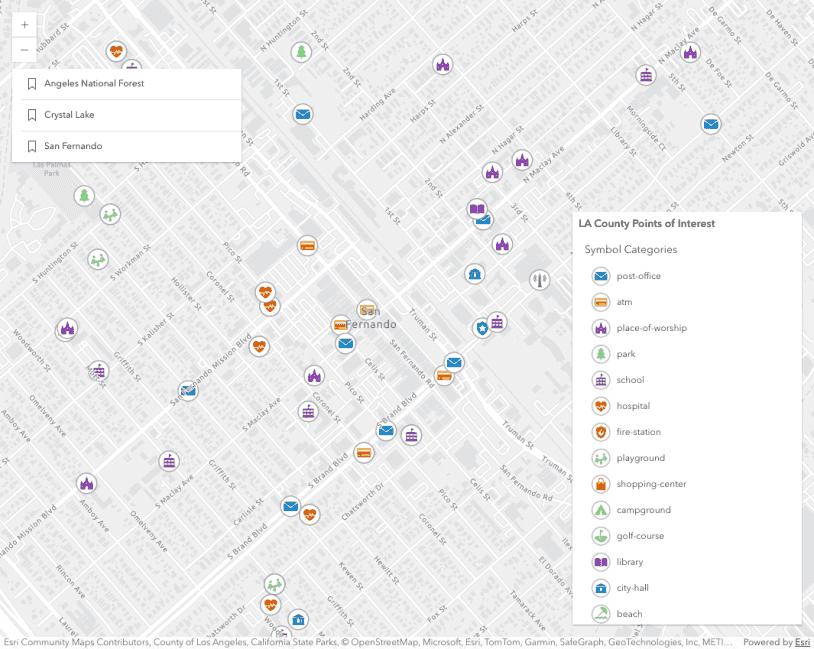
WebStyleSymbol (2D)
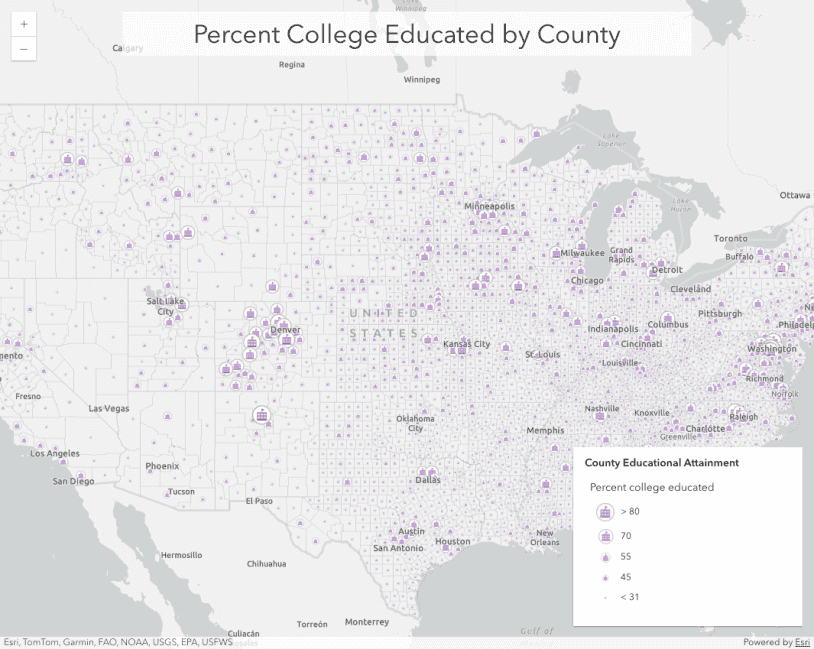
WebStyleSymbol - continuous size (2D)
Proportionally-sized WebStyleSymbols (2D)
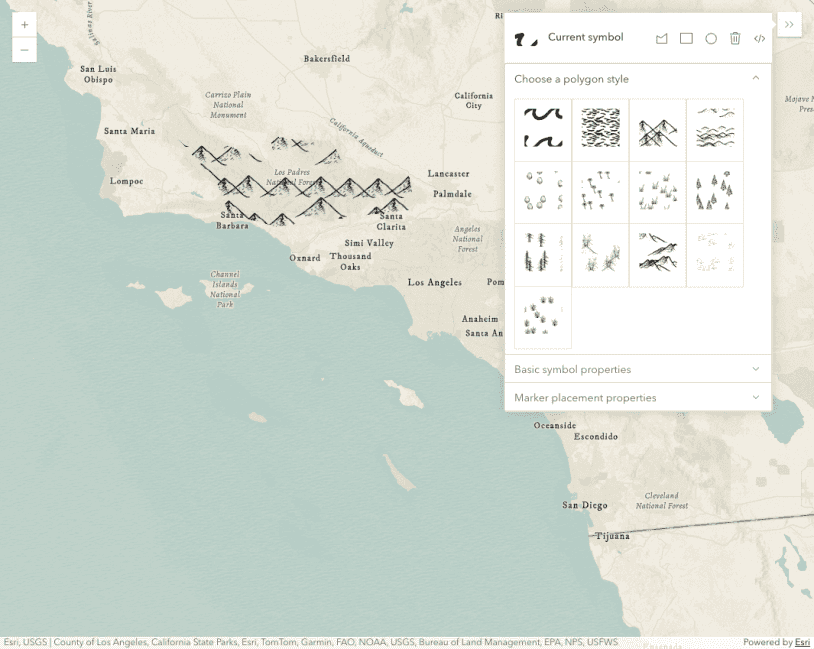
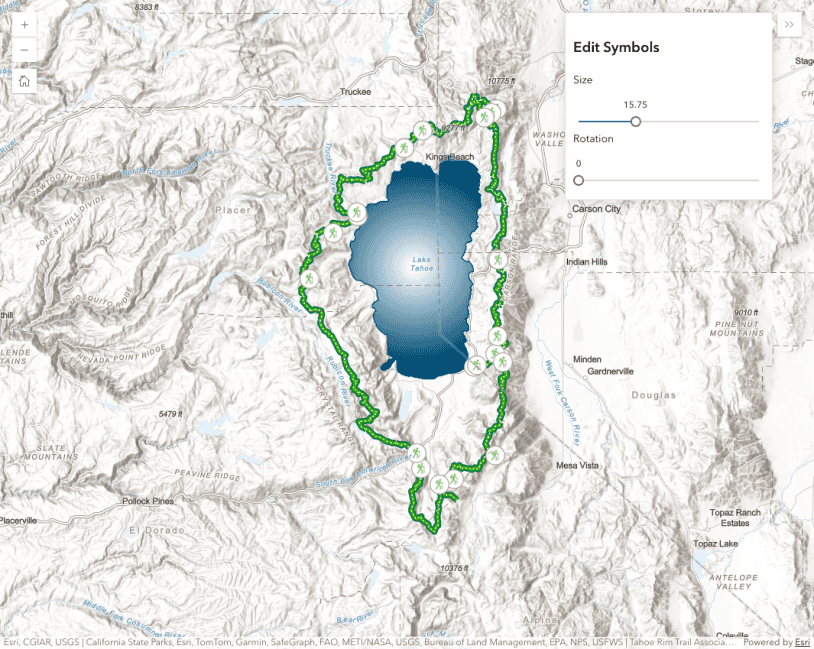
Polygon marker placement
Draw symbols in a map and adjust the CIMSymbol properties such as color, size, and marker placement.
Data-driven extrusion
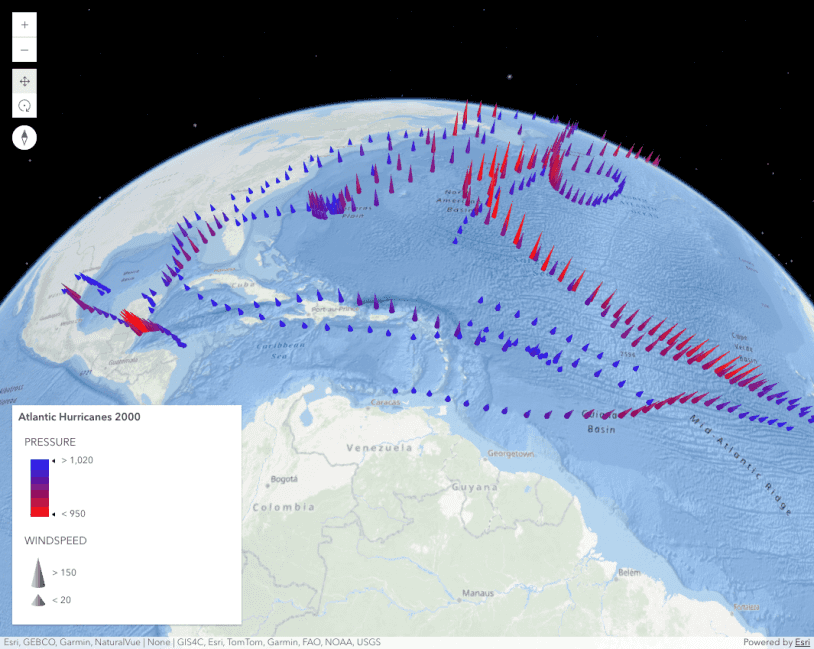
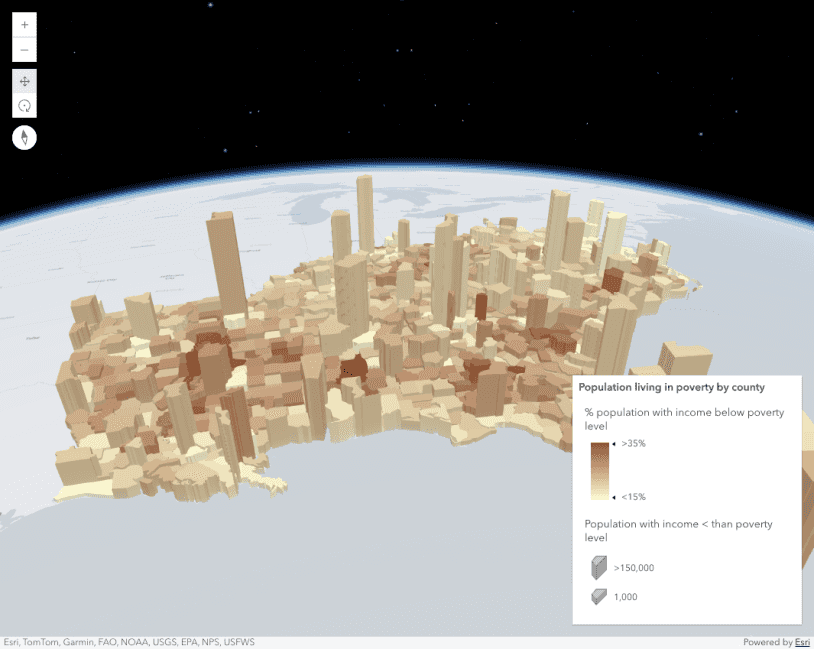
Multivariate visualizations (3D)
Thematic multivariate visualization (3D)
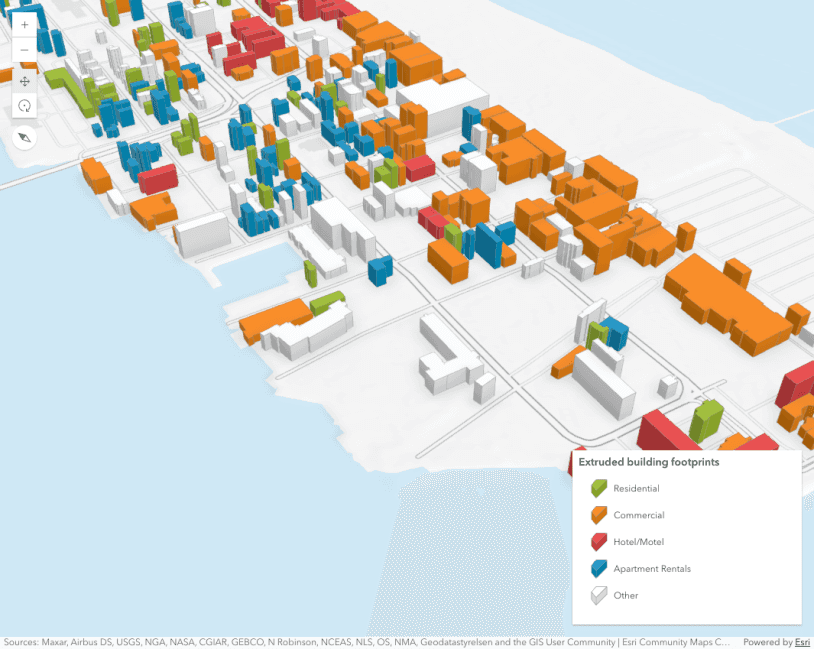
Extrude buildings footprints based on real world heights
Extrude building footprints based on real world heights
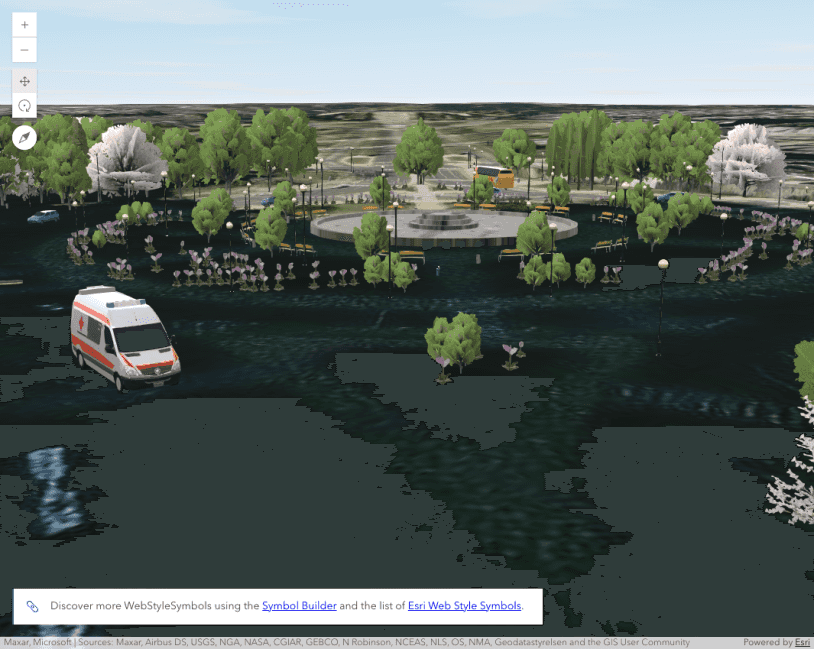
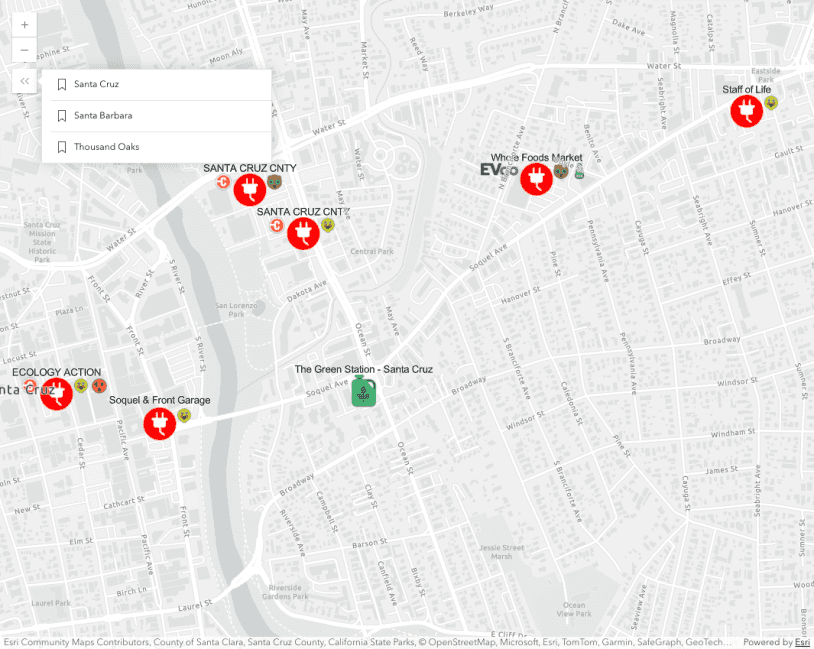
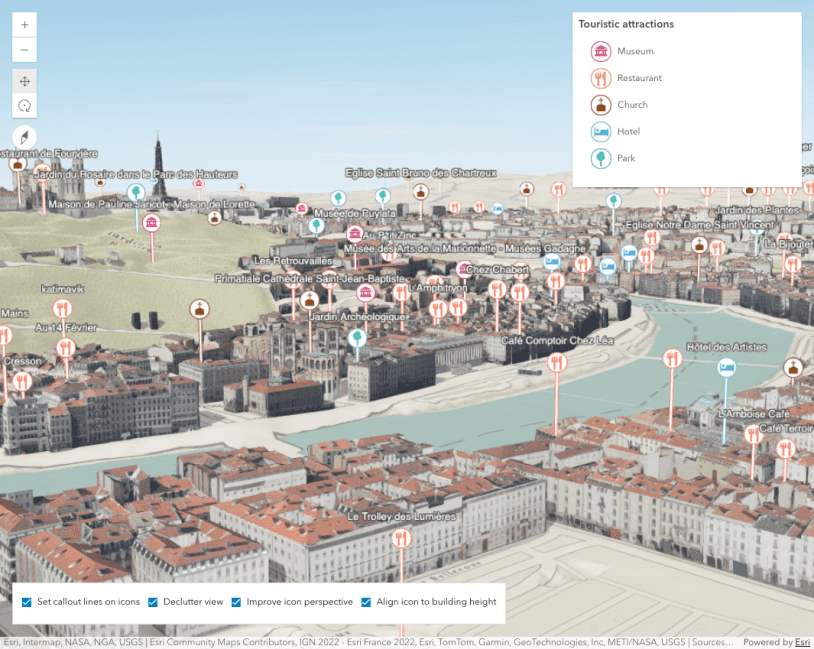
Realistic WebStyleSymbols
Visualize features with realistic WebStyleSymbols


3D icon rotation
Point styles for cities

Urban visualizations with polygon patterns

Visualize data on Mars
Custom background for SceneView
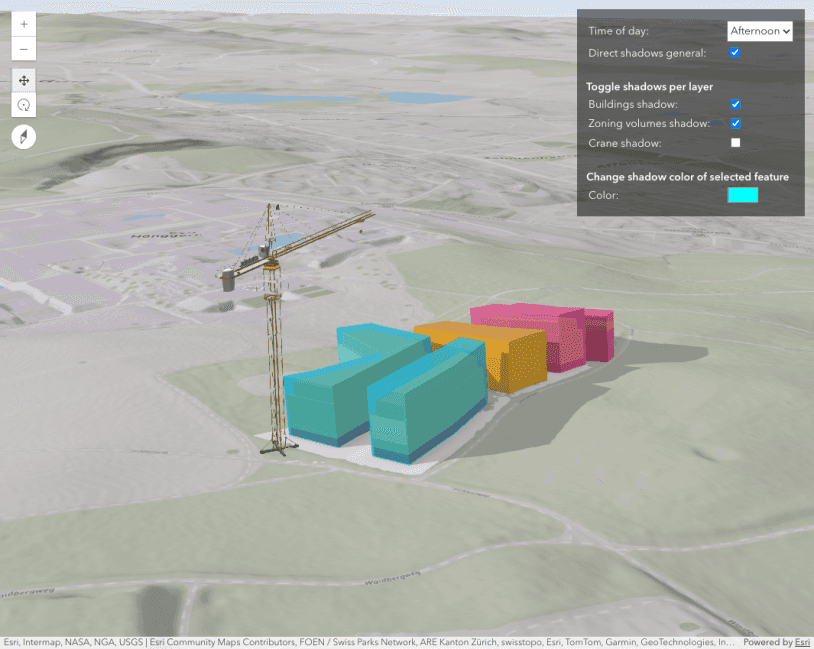
SceneView - shadow and lighting
SceneView - shadow and lighting settings

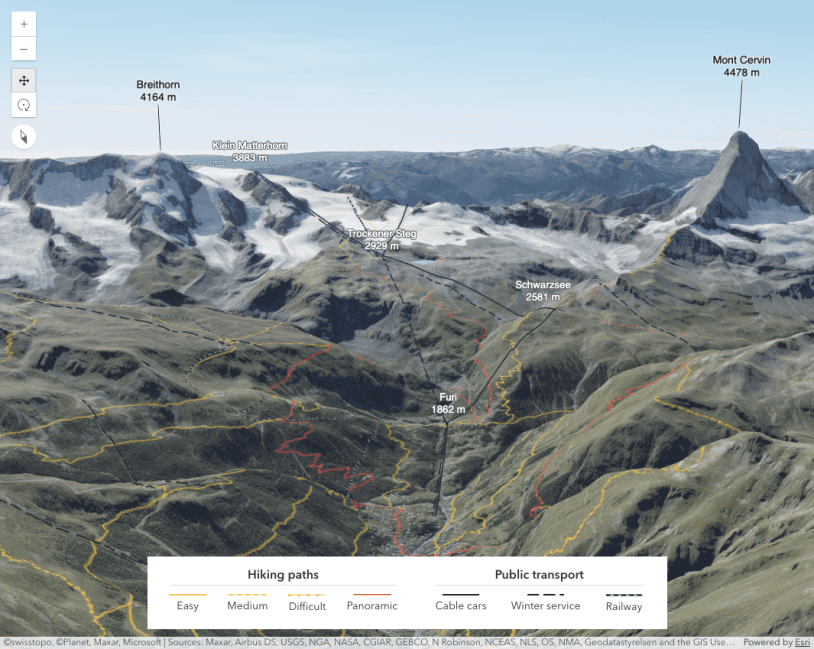
3D hiking map with line patterns

Scene - follow mode

Line markers and label placement

Blend modes in 3D
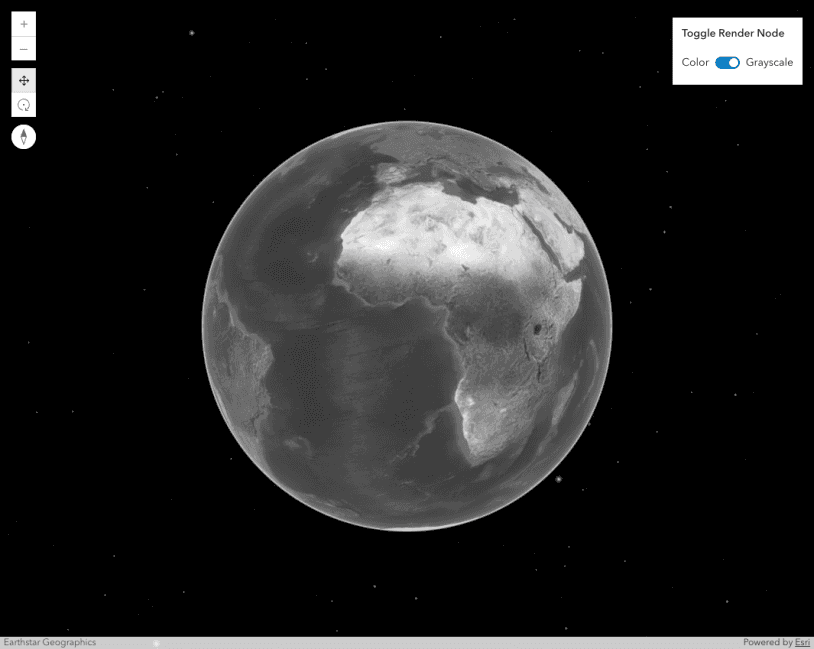
Custom RenderNode - Color modification

Custom RenderNode - Depth of field
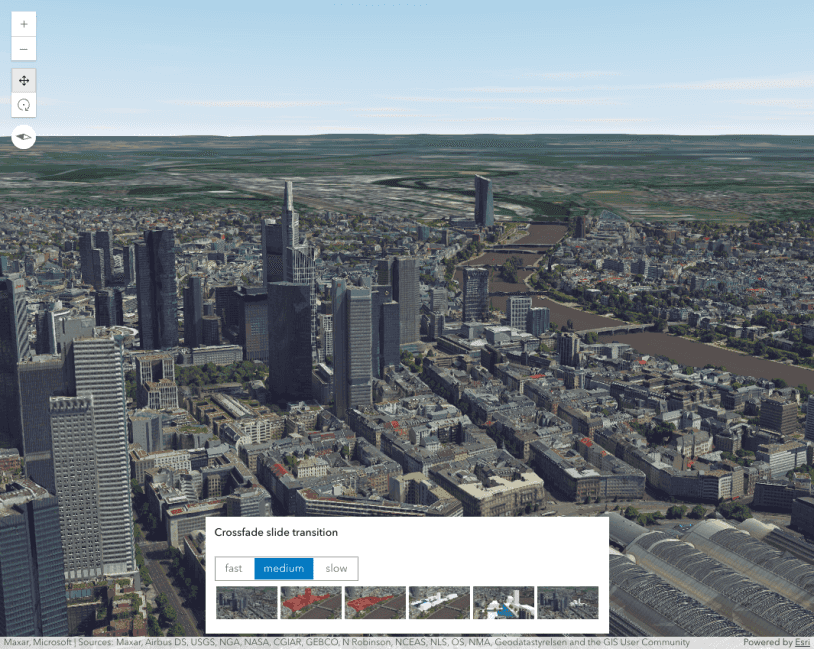
Custom RenderNode - Crossfade slide transition
Custom RenderNode - Cross-fade slide transition

Custom RenderNode - Animated Windmills
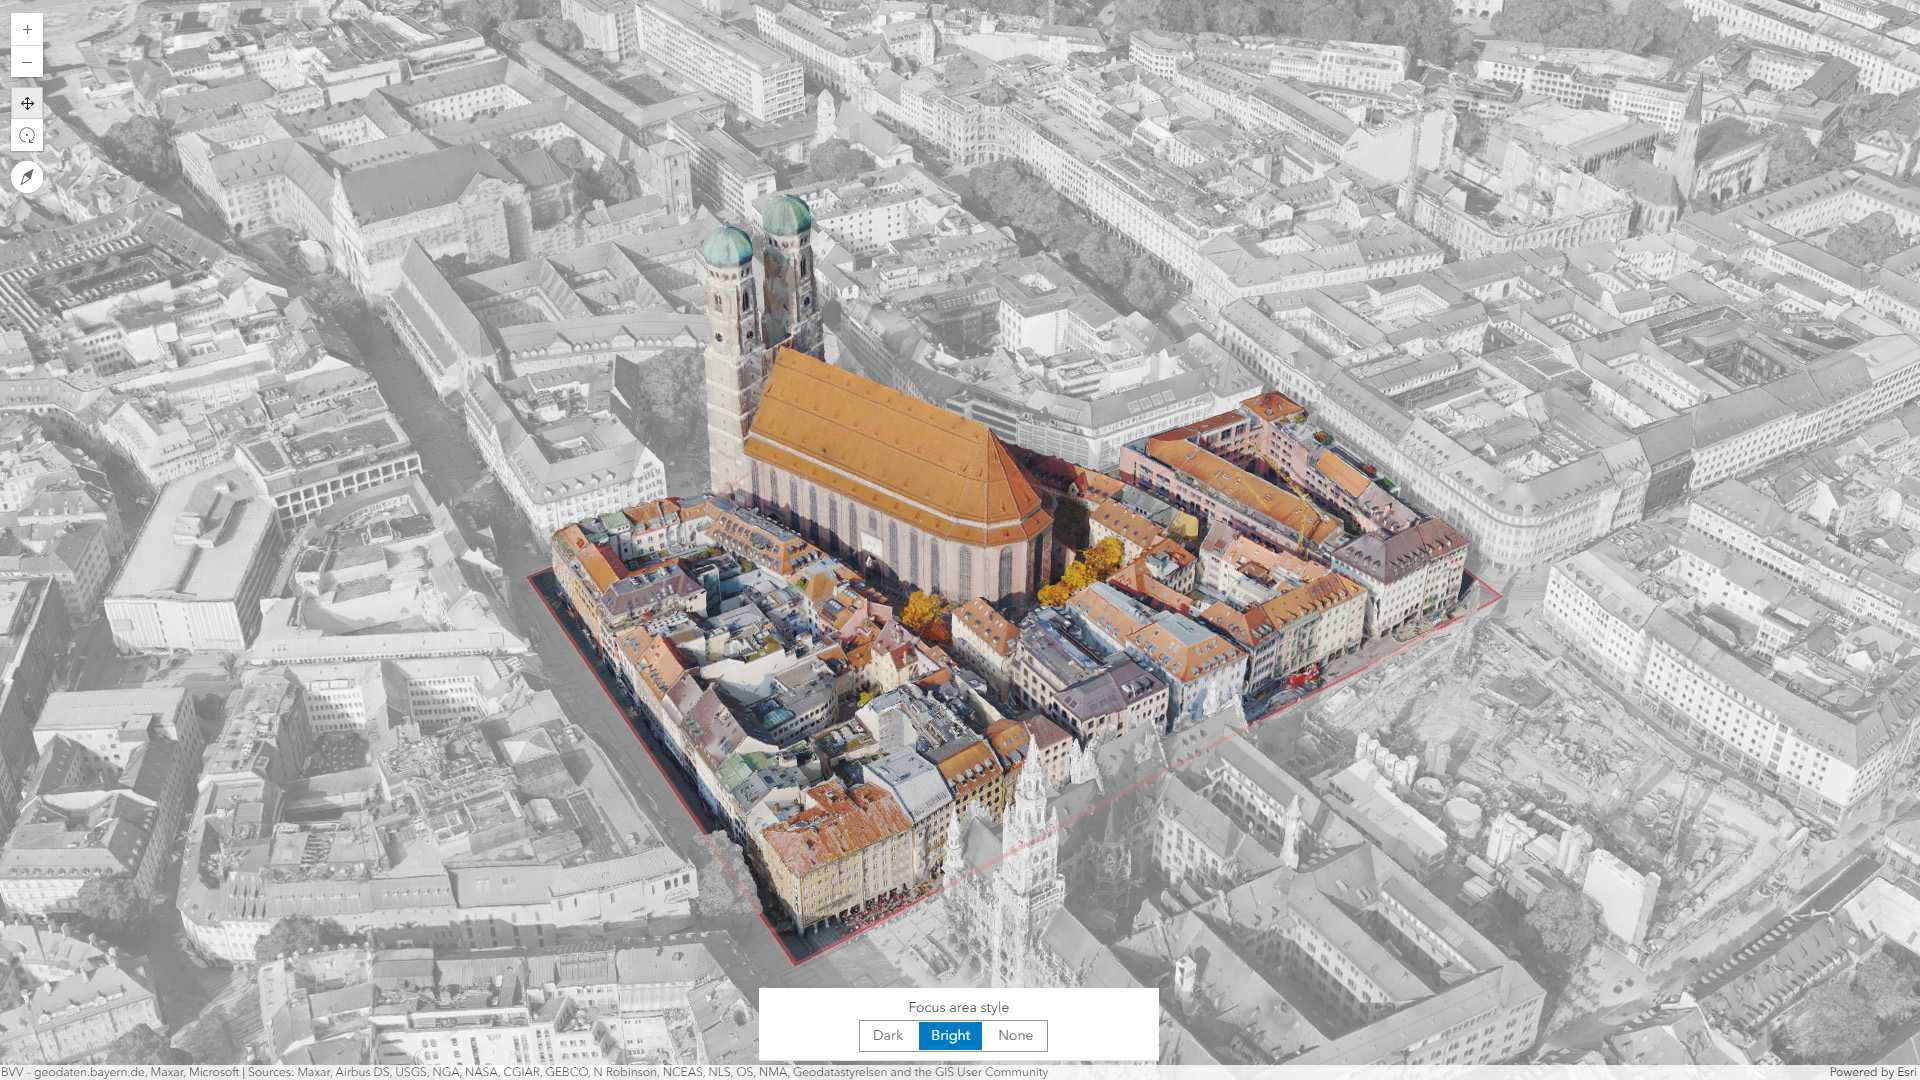
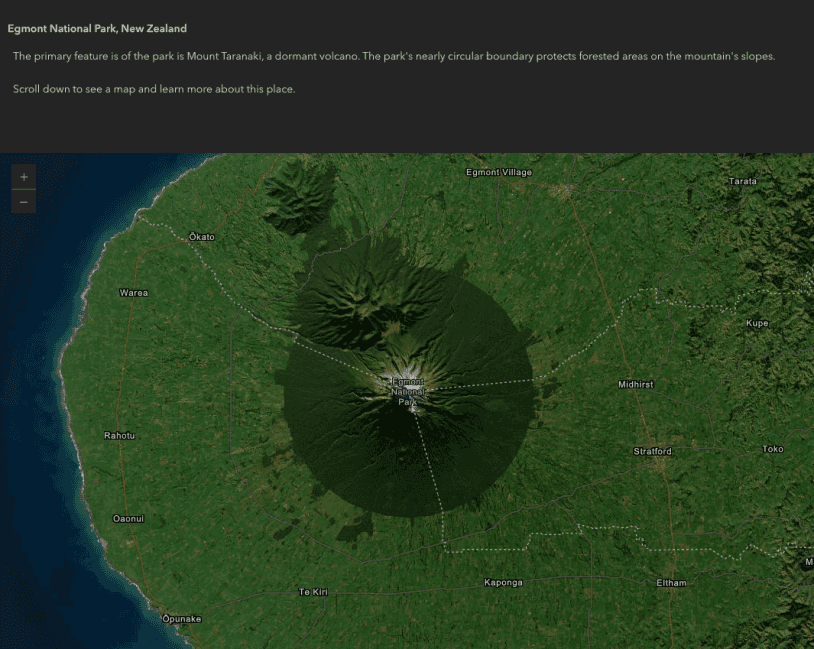
Focus Area

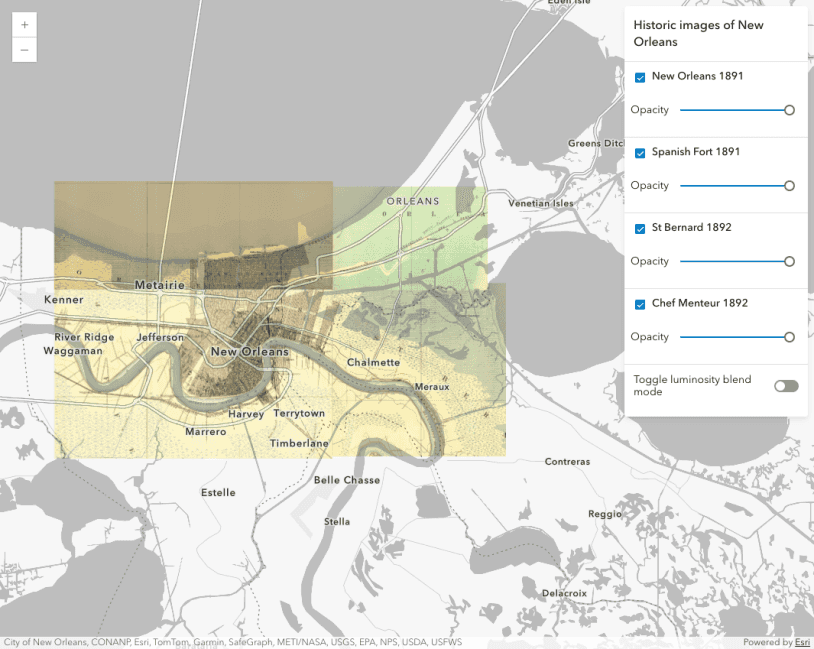
Intro to layer blending
Multiply blendMode

Composite blending
FeatureLayerView - query statistics by geometry
Intro to layer effect

Intro to feature effect
Apply featureEffect to FeatureLayer

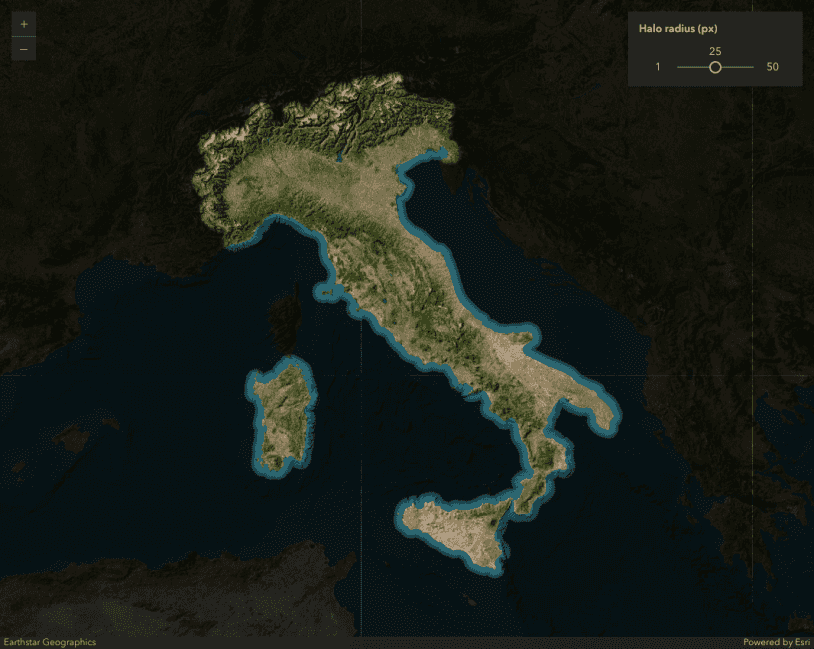
Highlight feature with drop-shadow
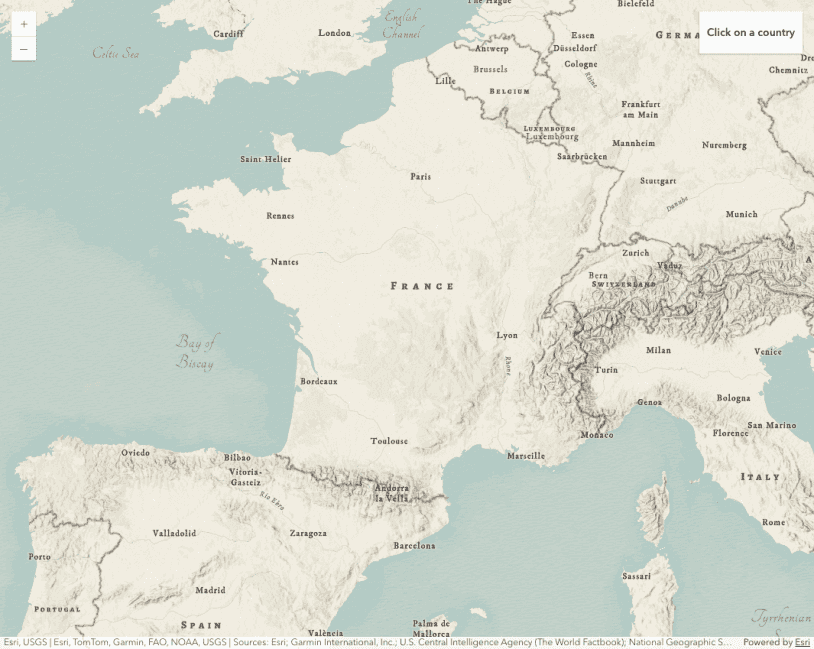
Highlight a country with an effect
Apply effects to features

FeatureEffect - multiple effects
Highlight areas intersecting borough boundaries

FeatureEffect - drop-shadow
Apply drop-shadow effects to layerview
Select features by rectangle
Highlight feature with effects and blending

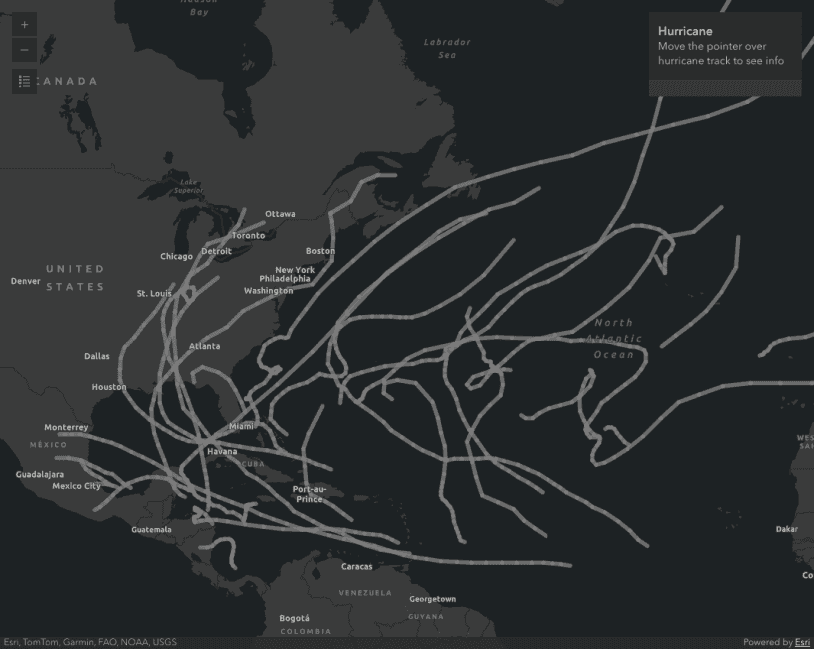
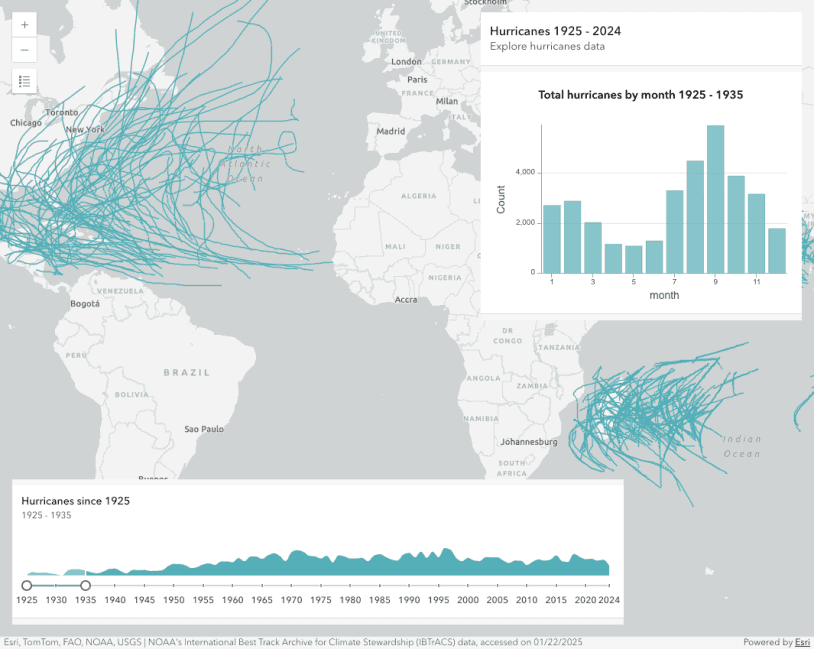
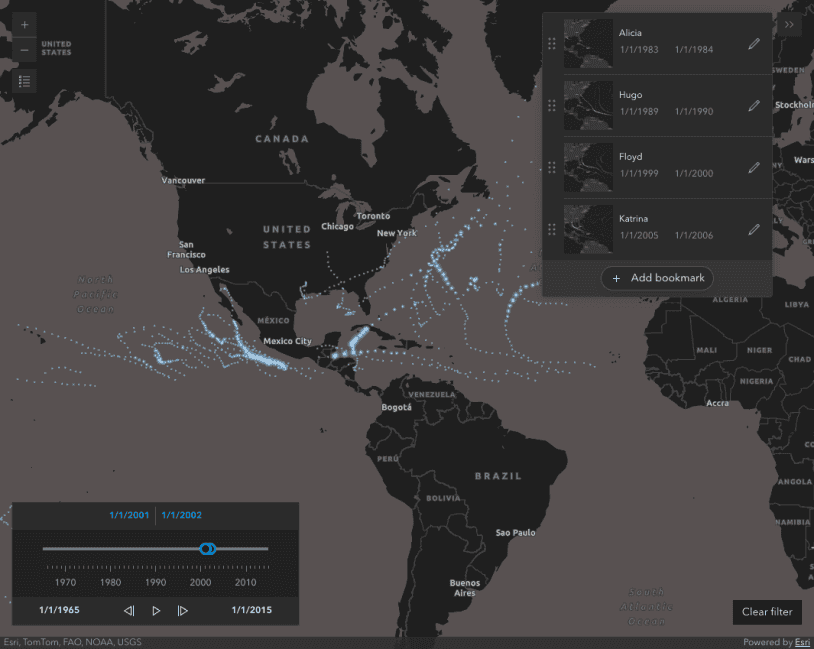
Visualize historical track data
This sample demonstrates how to visualize hurricane data in a GeoJSONLayer as historical tracks.

Animate color visual variable
Animate layer view effect
Update a renderer's attribute
Scene - follow mode

Configure feature sort order
Learn how to configure the drawing order of features in a layer

Sort features by legend order
Control the draw order of features to match the order of unique values defined in a UniqueValueRenderer

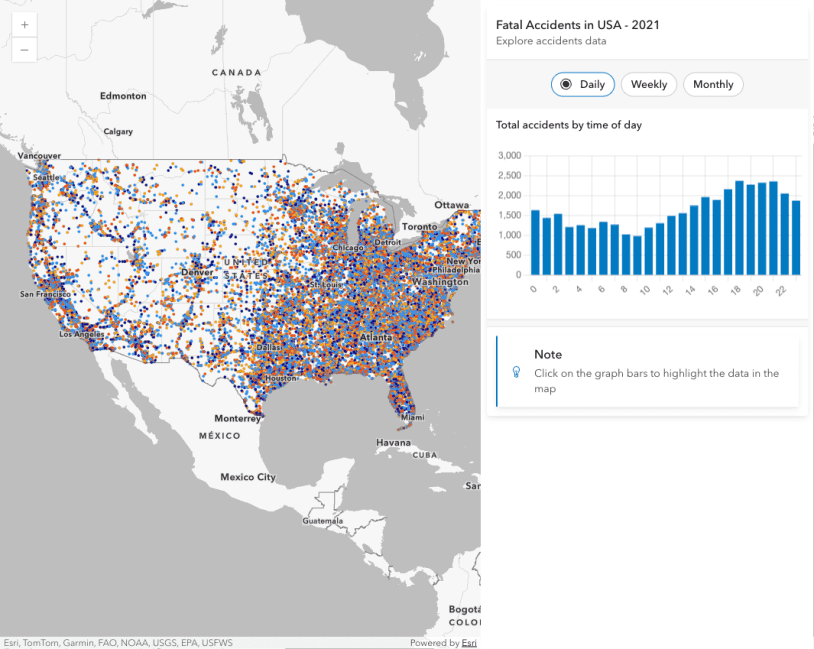
Execute Arcade for a custom chart
Execute an Arcade expression defined in a webmap to create a custom chart
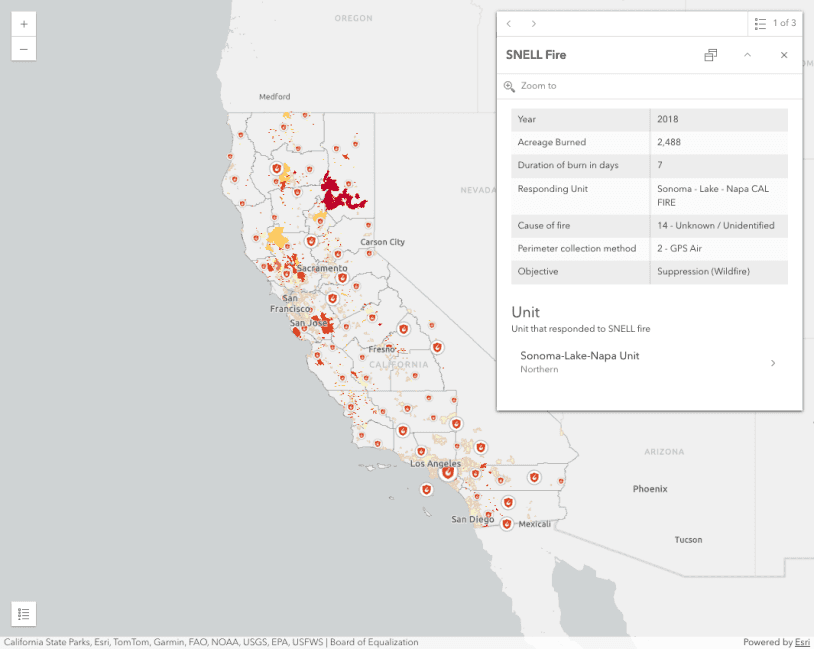
Popups
Intro to popup component
A step-by-step guide about adding popup components to your app.

Dock positions
Popup dock positions


Create popup charts from Arcade expressions
This sample demonstrates how to dynamically create popup content elements using Arcade expressions.

PopupTemplate with functions
PopupTemplate - use functions to set content
Custom popup actions per feature
Custom popup actions per feature attribute
FeatureTable widget with popup interaction
FeatureTable with popup interaction
Graphics


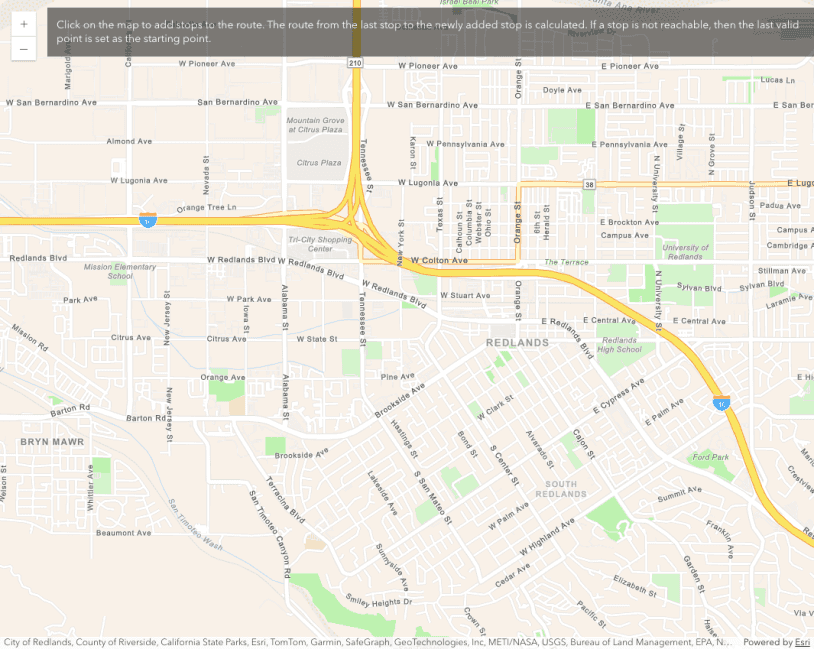
Routing
Search

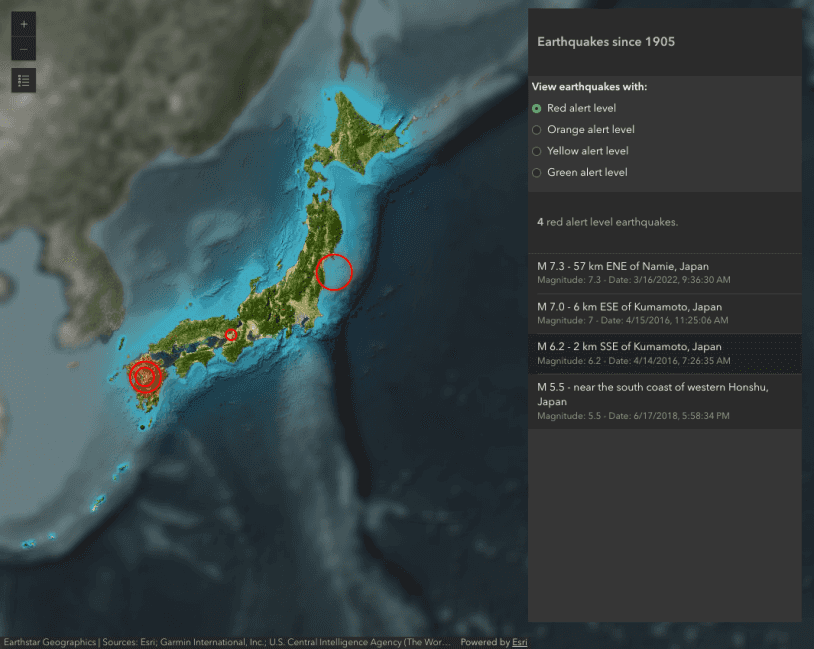
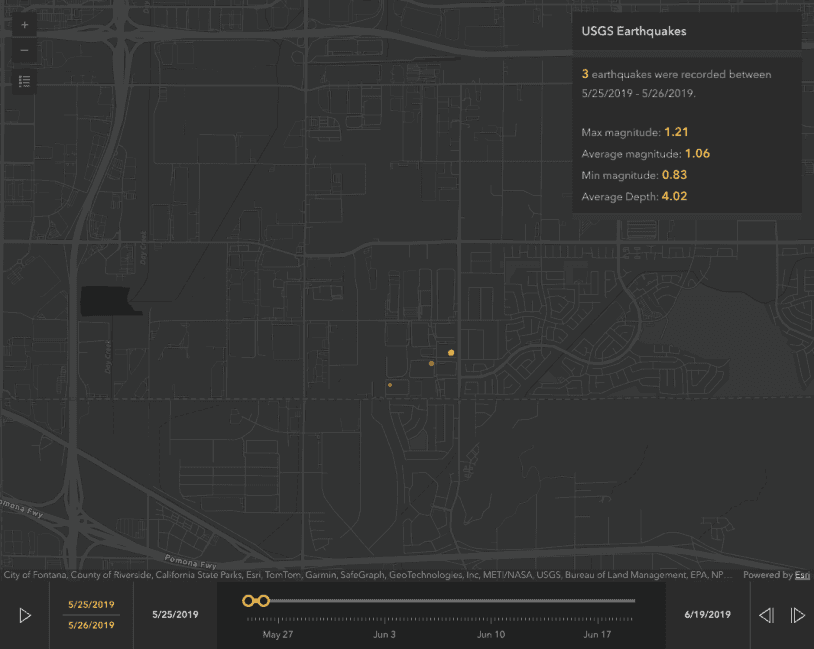
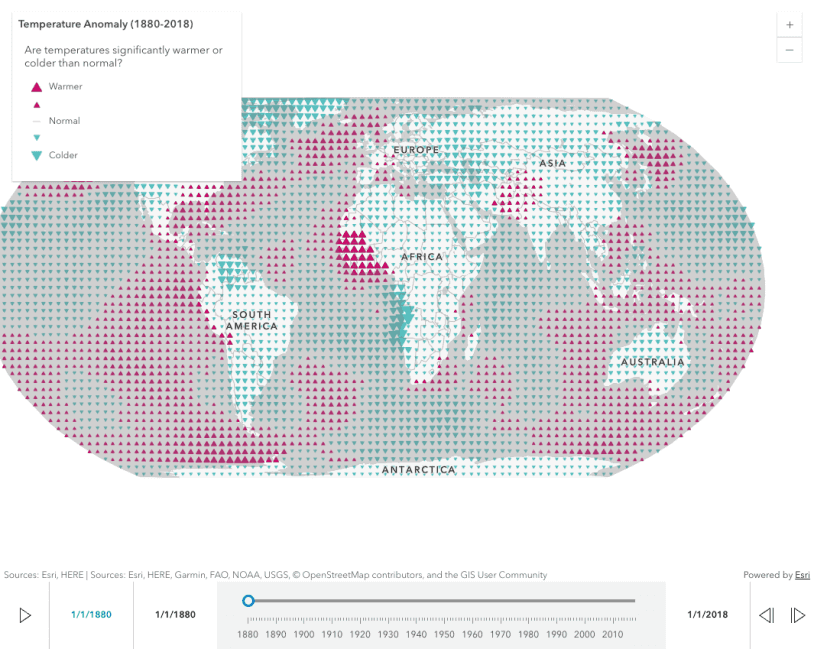
Time
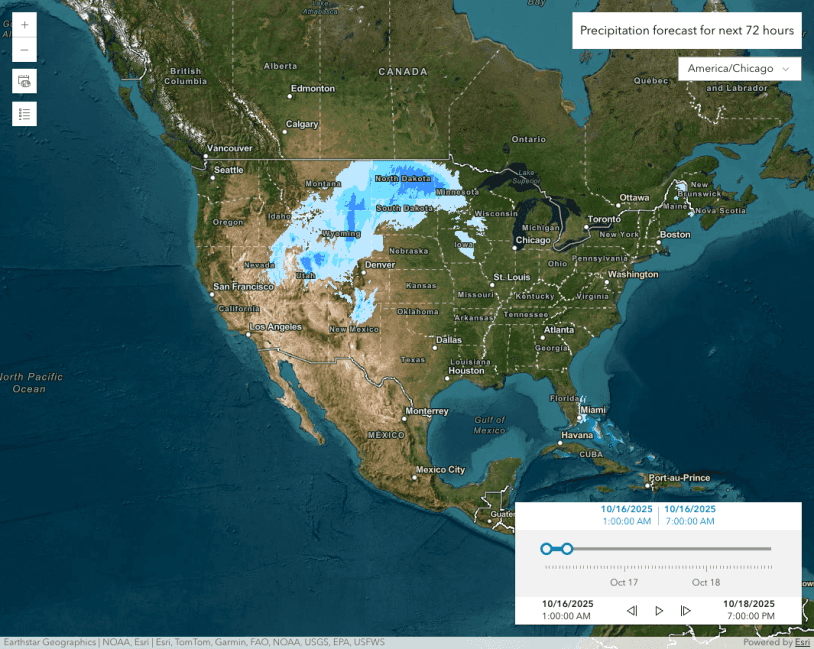
TimeSlider
TimeSlider component and time zone

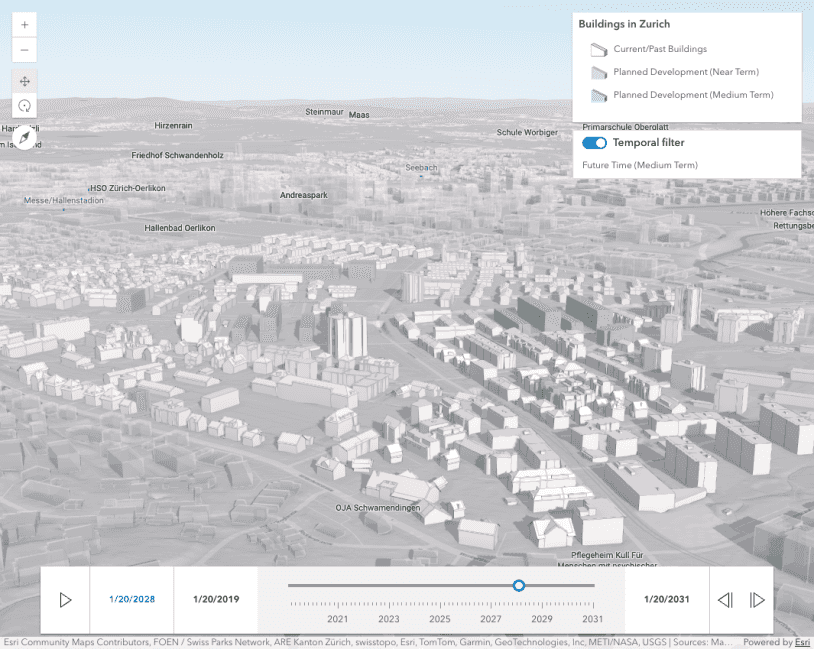
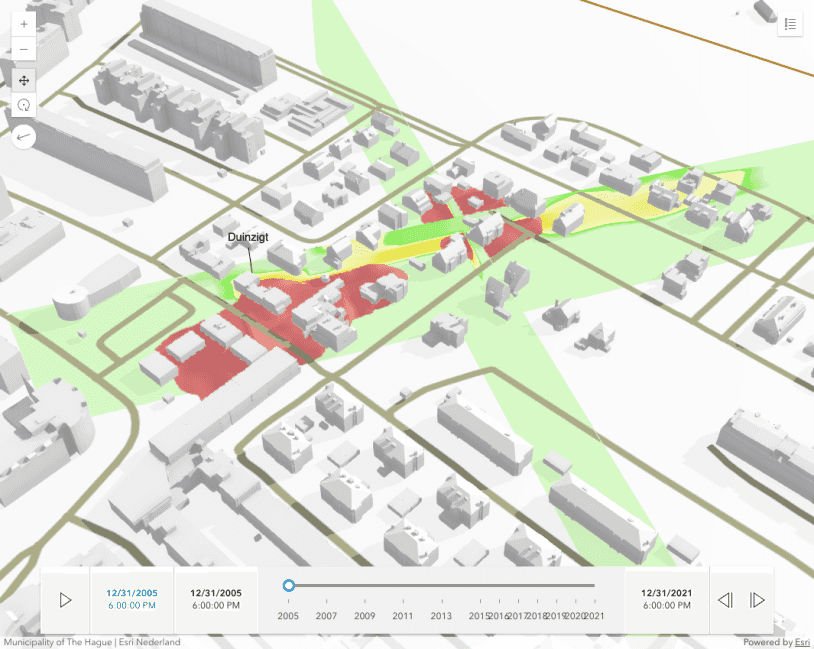
Filter SceneLayer with Time
SceneLayer with time filter
VoxelLayer and time
VoxelLayer Time
Analysis

Geometry operator - centroid
Geometry operator - centroid analysis

Geometry operator - offset visualizer
Geometry operator - offset analysis


Components and widgets
Bookmarks
Bookmarks component


Coordinate Conversion - Custom Formats
Coordinate Conversion component - Custom Formats
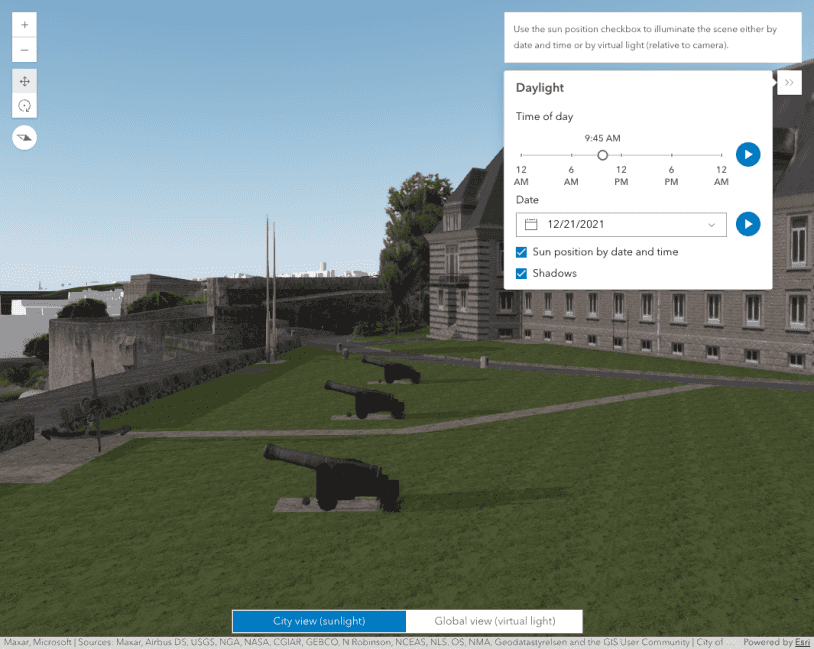
Daylight
Daylight component
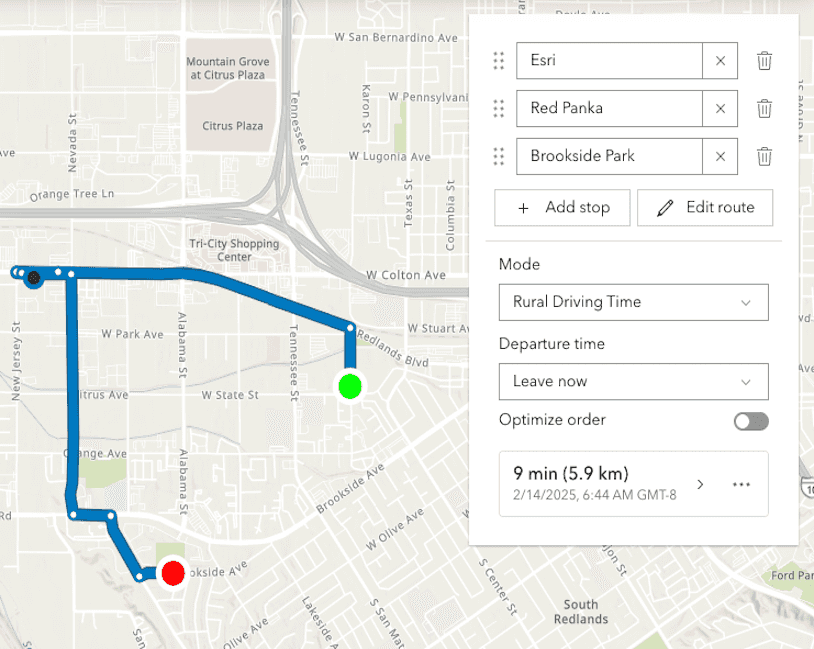
Directions
Directions component with RouteLayer
Edit features with the Editor component
Edit features in 3D with the Editor widget
Edit features in 3D with the Editor component
SceneLayer attribute editing (Editor widget)
SceneLayer attribute editing
Editor widget with configurations
Editing with calculated field expressions
This sample provides an example of working with advanced field calculations within the Editor widget
Edit FeatureLayers with form elements
Editing related data with calculated expressions

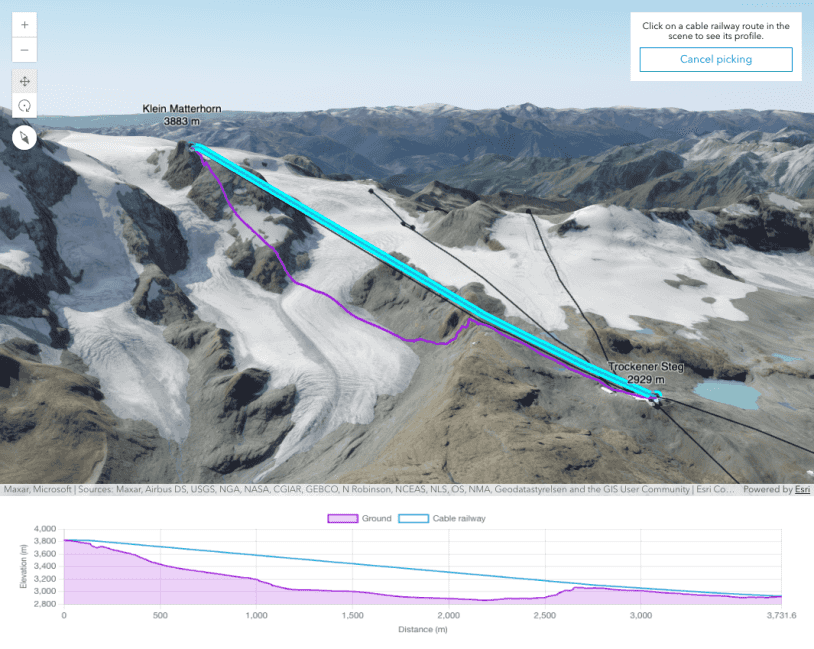
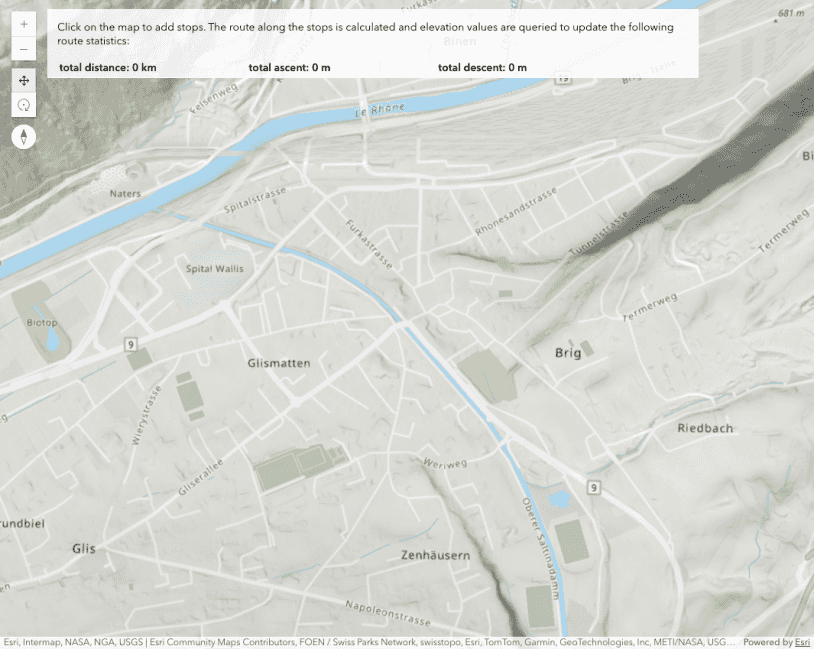
Elevation Profile
Elevation Profile component

Expand
Expand component

Feature component in a side panel

Feature component - Query graphics from multiple layers
Update Feature Attributes
Advanced attribute editing
Editing with calculated field expressions
This sample provides an example of working with advanced field calculations within the Editor widget

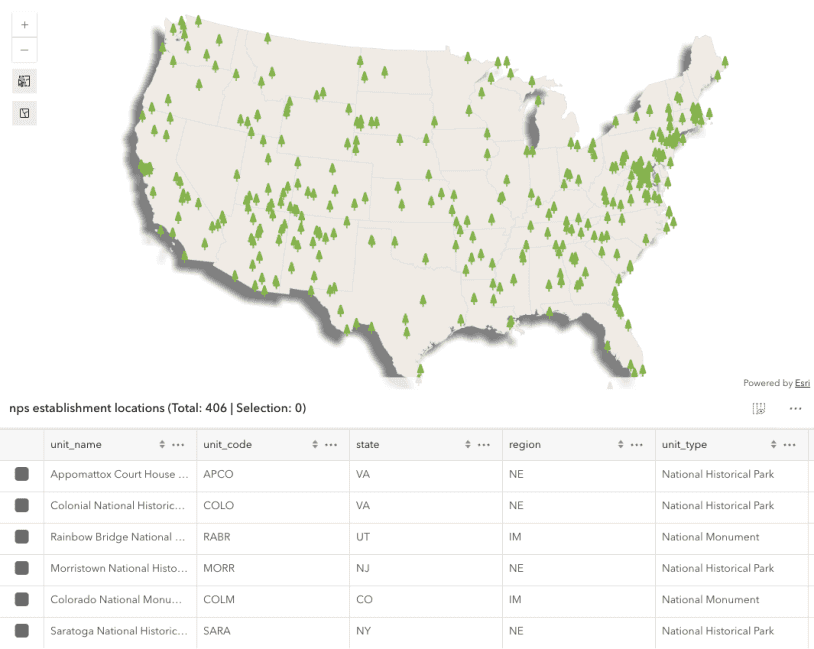
FeatureTable component
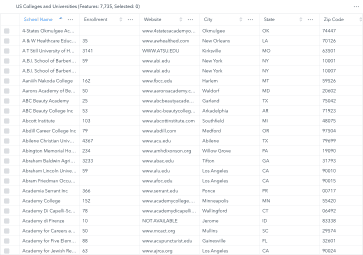
FeatureTable

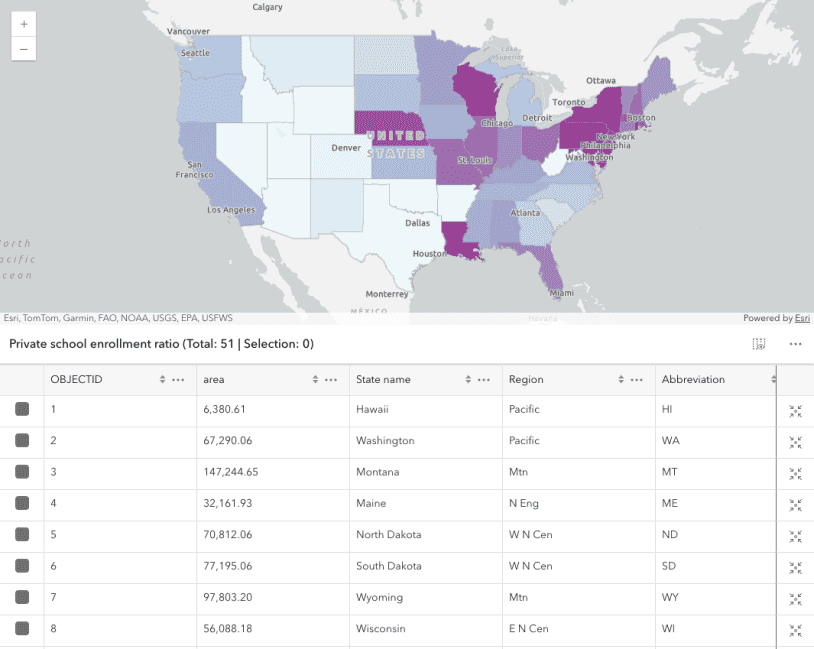
FeatureTable with a map
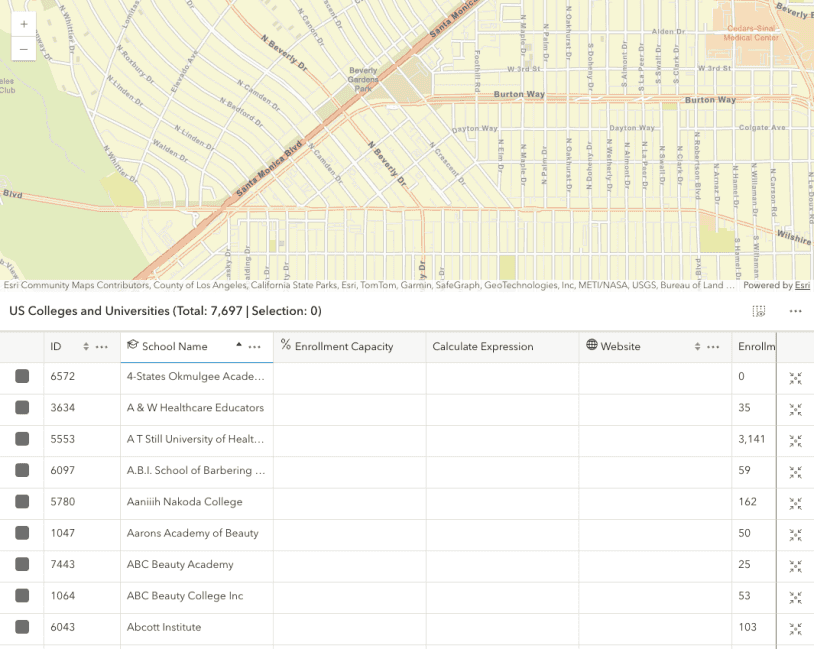
FeatureTable with editing enabled
FeatureTable with editing and attachments enabled
FeatureTable with popup interaction
FeatureTable with related records
Synchronize FeatureTable highlights and selection
FeatureTable with custom content
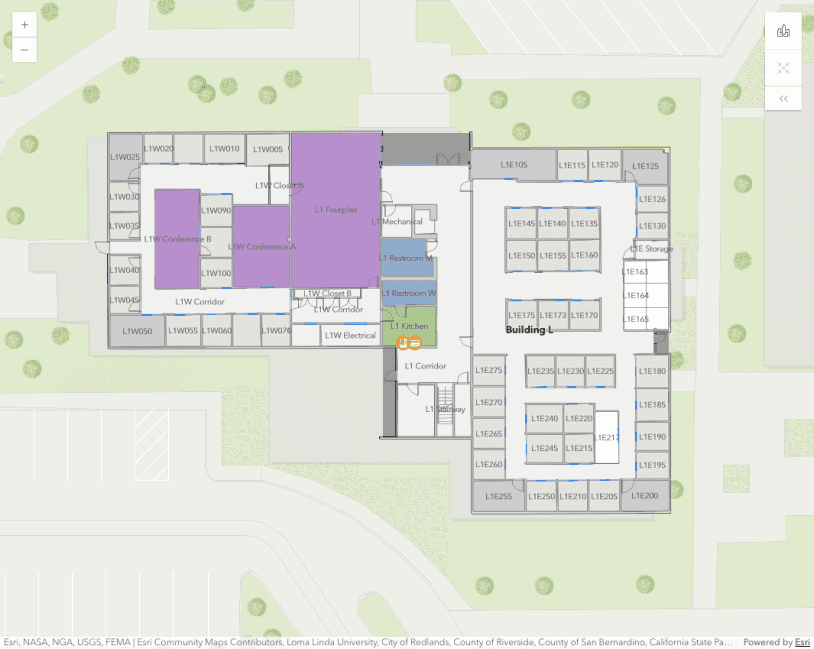
FloorFilter
FloorFilter component
Histogram
Histogram widget

Add a Legend to the LayerList
Update legend text

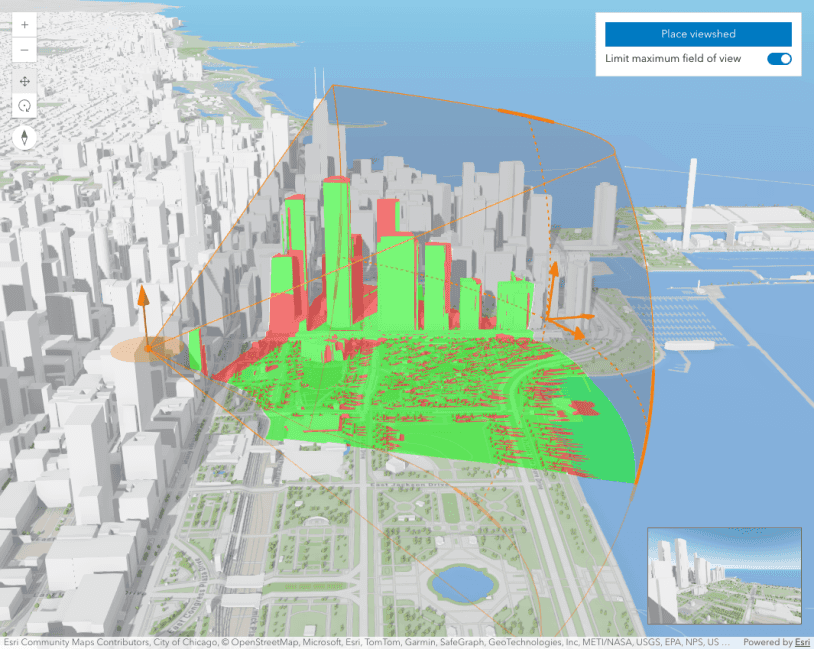
Line of Sight
Line of sight component
Locate
Locate component

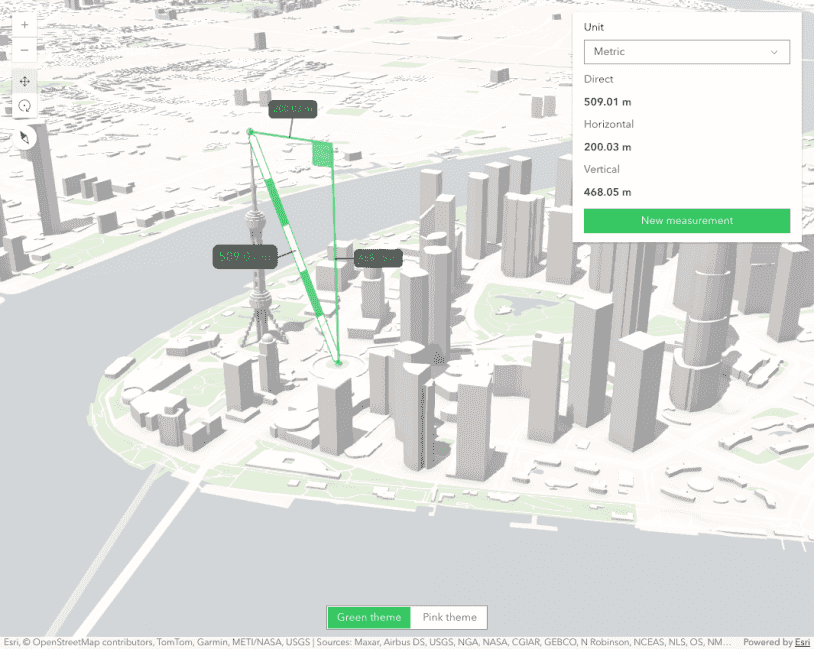
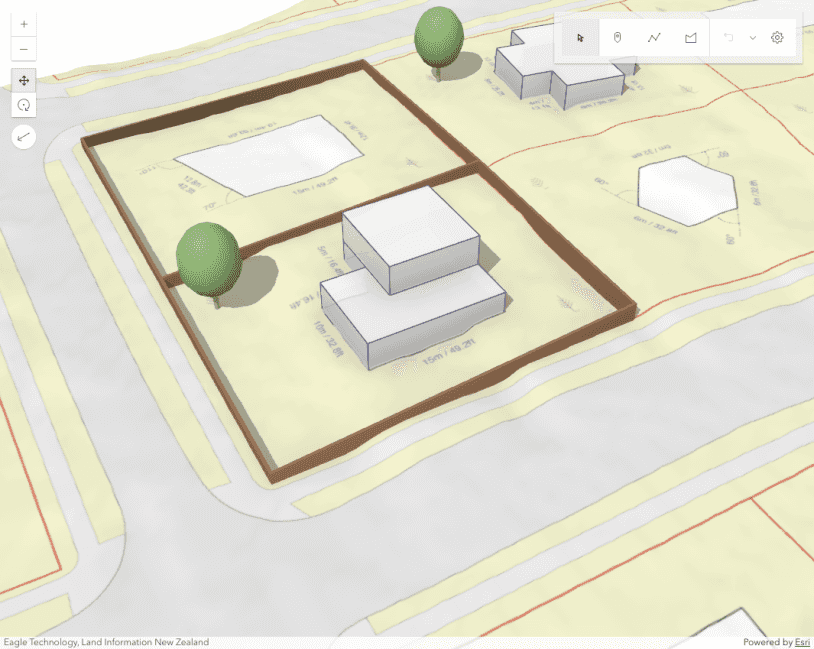
Measurement in 2D
Search component with multiple sources
Search component with custom source

Shadow Cast
Shadow Cast component

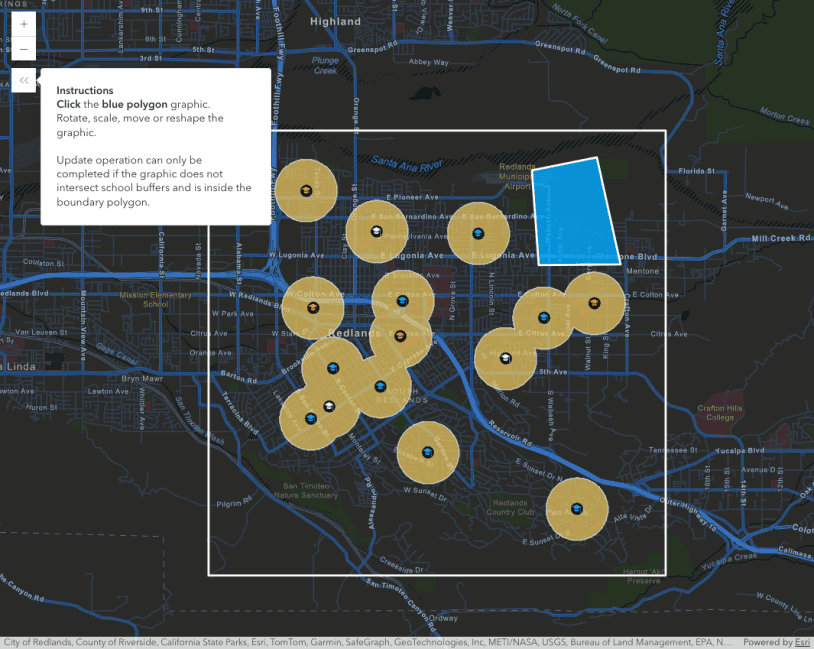
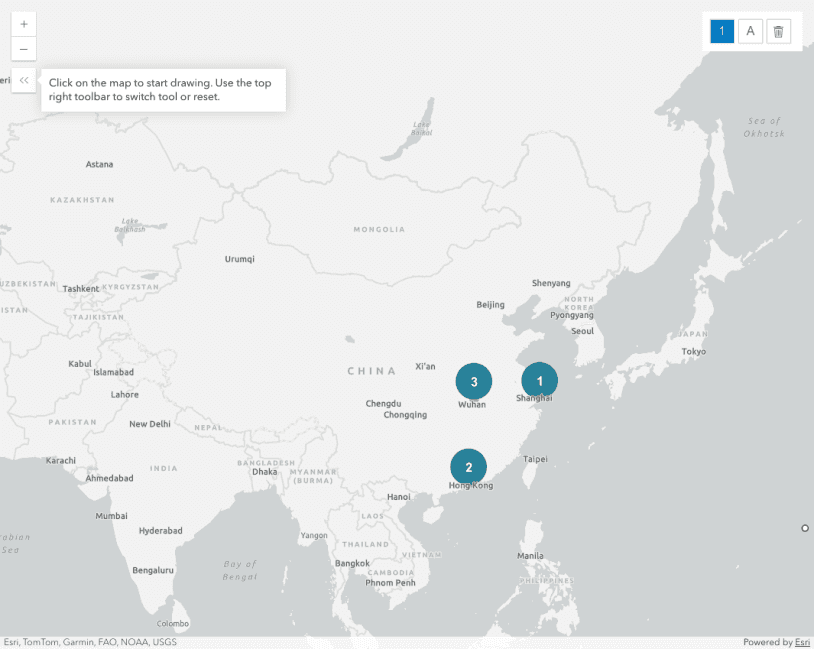
Sketch
Sketch component
Slice
BuildingSceneLayer with Slice component


TableList
TableList component
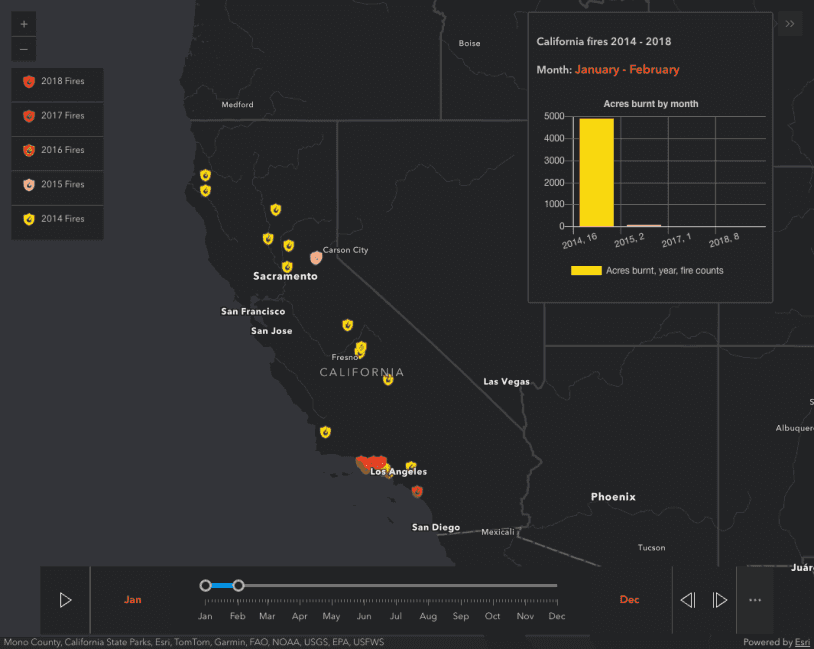
Filter features with TimeSlider component

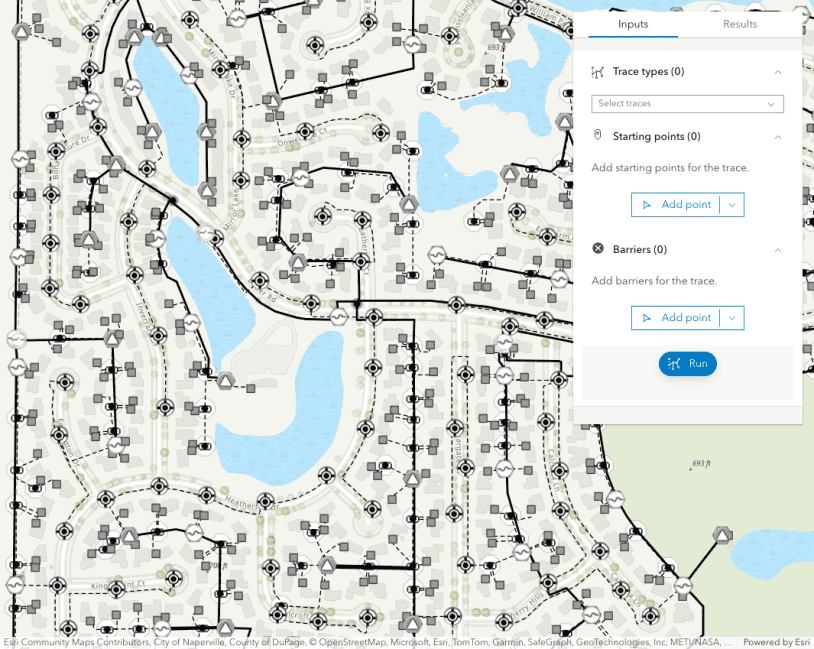
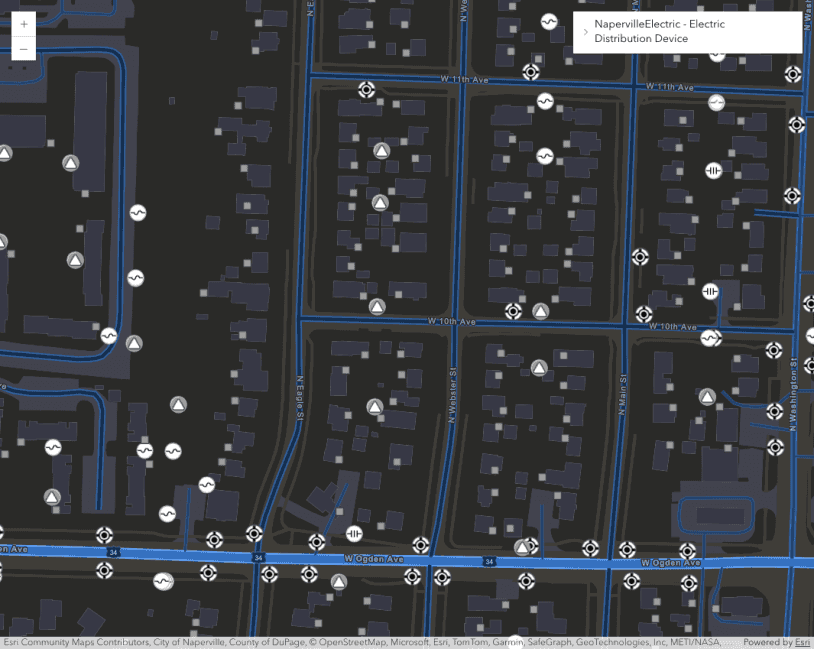
UtilityNetworkTrace
UtilityNetwork Trace component
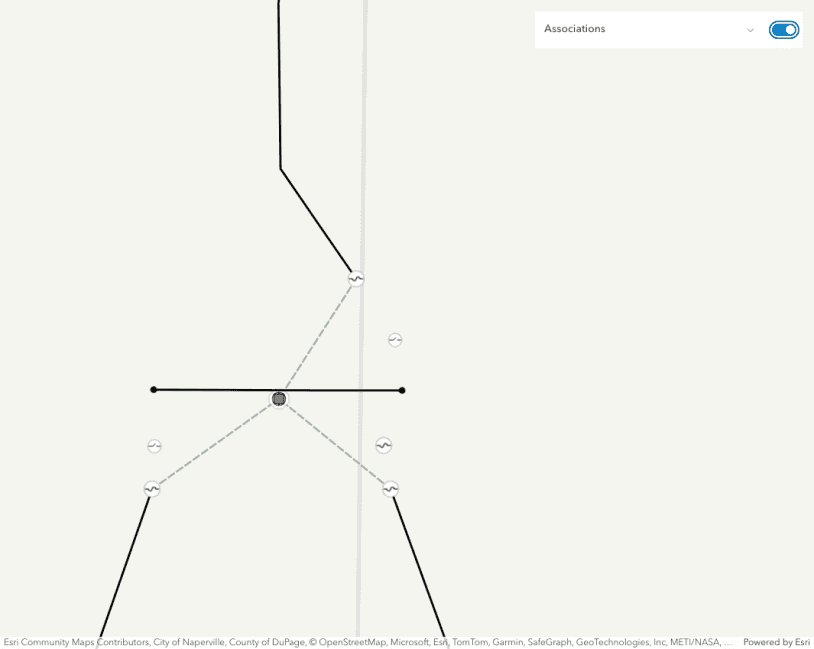
UtilityNetworkAssociations
UtilityNetwork Associations component
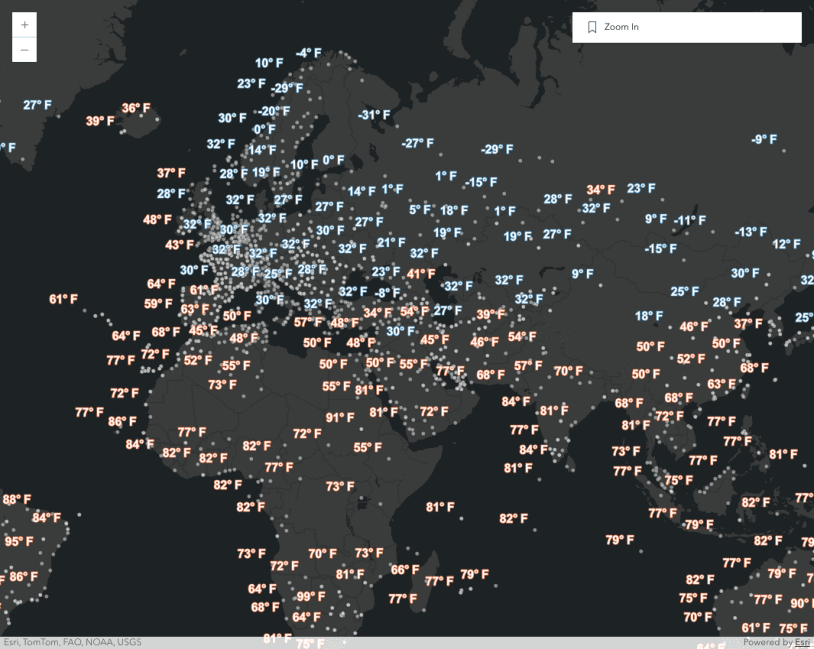
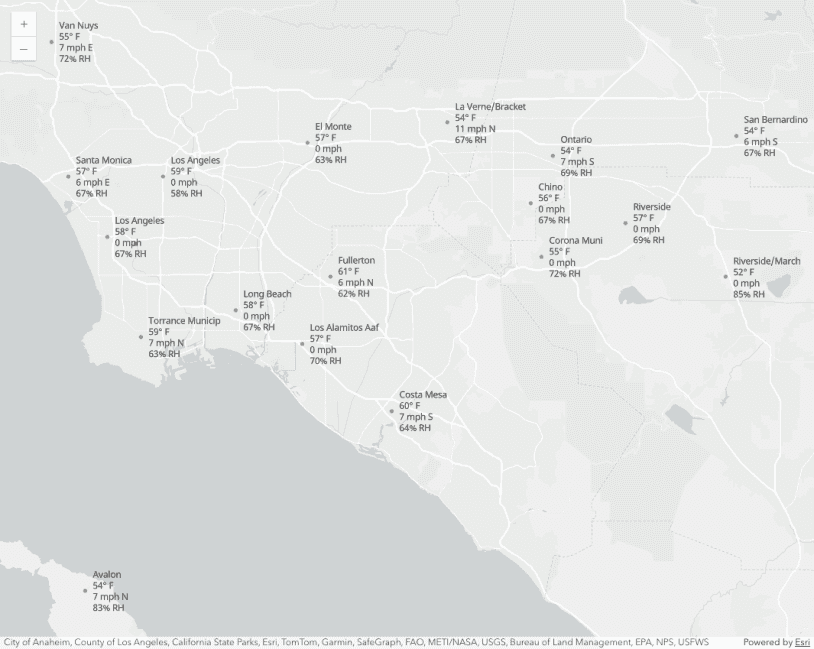
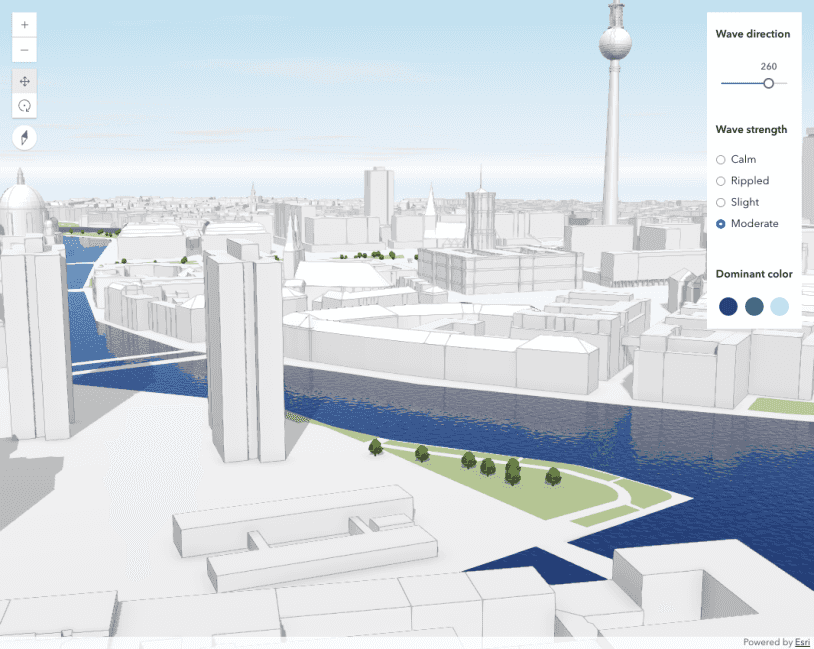
Weather
Weather component
Other
Access a secure webmap with OAuth
Access a secure webmap using OAuth 2.0

Access ArcGIS Online items via OAuth
Access ArcGIS Online items using OAuth 2.0

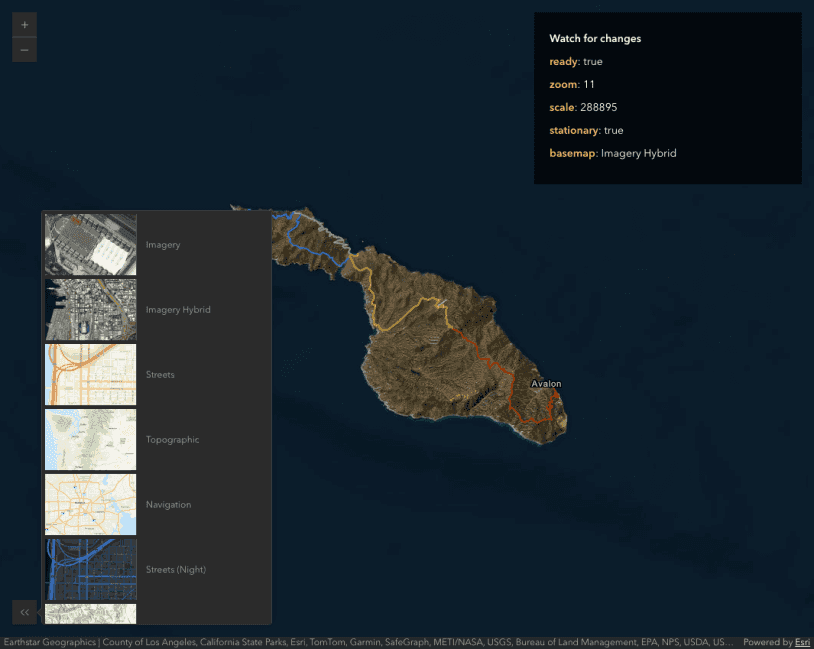
Watch for component changes
Watch for changes in components
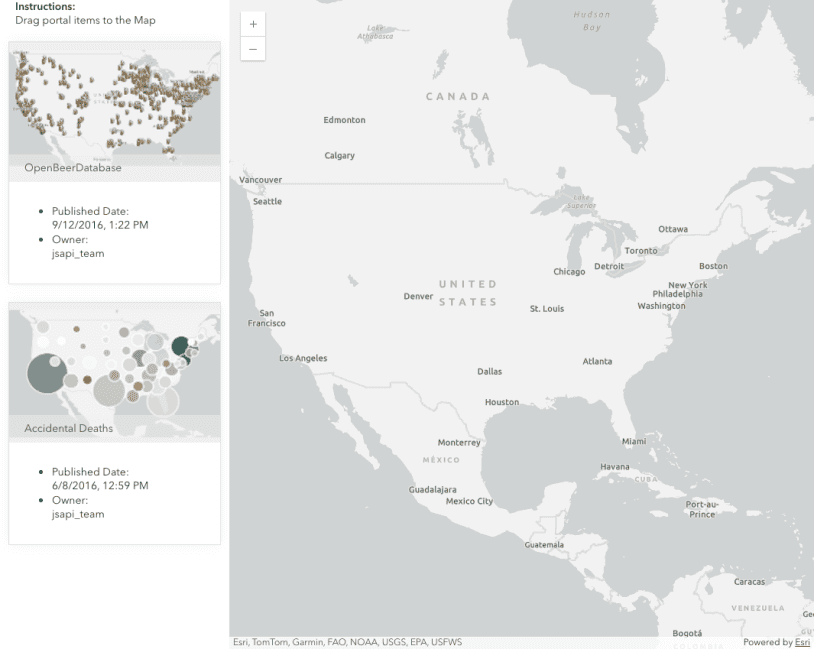
Drag and drop portal items
Load portal items via drag & drop